Authors
Publication
Metrics
Quick Actions
Quick Answers
What methodology did the authors use?
uringscope presents a model-driven reconstruction of per-request flows from kernel events, using a portable attachment method to unstable tracepoints via BTF-probed variants, CO-RE field flavors, and position-independent reads, integrated into a single static binary for multi-language observability of io_uring across kernel versions 5.15–6.17. More in Methodology →
What are the key results?
Aggregated per-request reconstruction achieves visibility with 0.7–9.9% throughput overhead on device-bound NVMe workloads, outperforming full-fidelity alternatives. — A lightweight correctness mode detects submission-boundary hazards using the same reconstruction with evidence, supporting incident debugging. More in Key Results →
Why is this work significant?
Provides portable, low-overhead, language-agnostic io_uring observability that reconstructs per-request flows from shared-memory rings, addressing instability of tracepoints and improving incident debugging and operational reliability. More in Significance →
What are the main limitations?
Limited visibility on the submission side for inlined libraries or non-io_uring library paths; some paths require inlined or direct ring reads to observe. — Observability surface is bounded by the last K requests per ring and depends on application deployment (non-virtualized environments may differ). More in Limitations →
Abstract
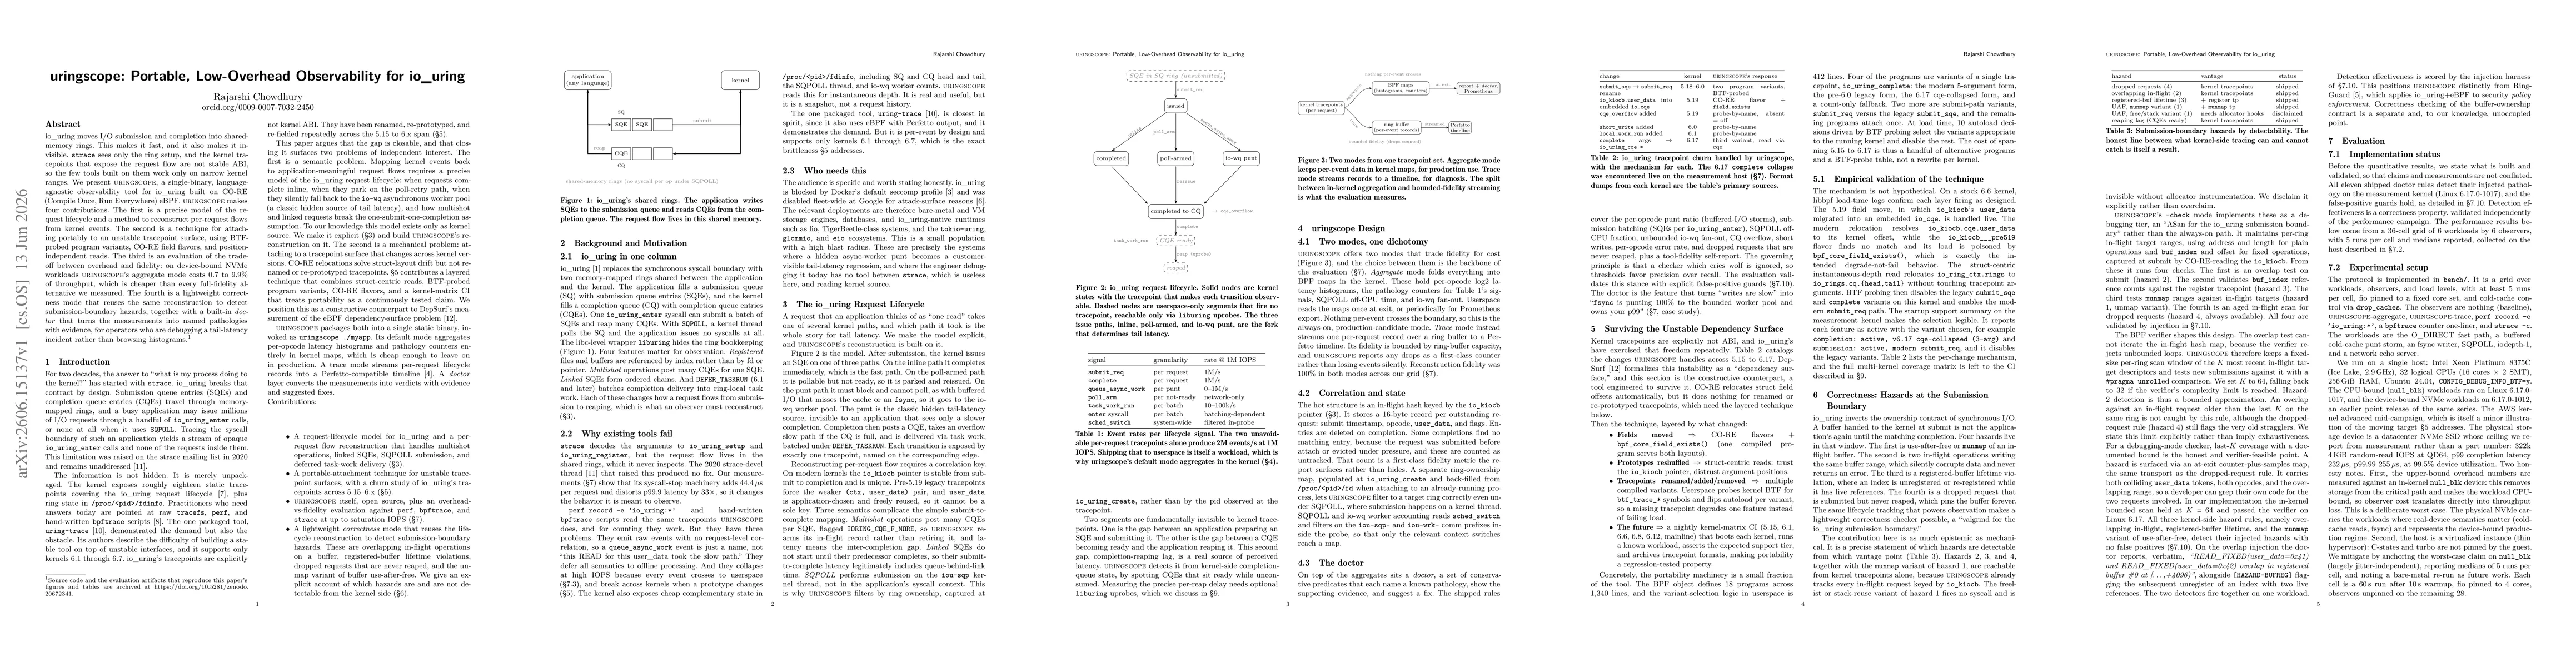
io_uring moves I/O submission and completion into shared-memory rings. This makes it fast, and it also makes it invisible. strace sees only the ring setup, and the kernel tracepoints that expose the request flow are not stable ABI, so the few tools built on them work only on narrow kernel ranges. We present uringscope, a single-binary, language-agnostic observability tool for io_uring built on CO-RE (Compile Once, Run Everywhere) eBPF. uringscope makes four contributions. The first is a precise model of the request lifecycle and a method to reconstruct per-request flows from kernel events. The second is a technique for attaching portably to an unstable tracepoint surface, using BTF-probed program variants, CO-RE field flavors, and position-independent reads. The third is an evaluation of the tradeoff between overhead and fidelity: on device-bound NVMe workloads uringscope's aggregate mode costs 0.7 to 9.9% of throughput, which is cheaper than every full-fidelity alternative we measured. The fourth is a lightweight correctness mode that reuses the same reconstruction to detect submission-boundary hazards, together with a built-in doctor that turns the measurements into named pathologies with evidence, for operators who are debugging a tail-latency incident rather than browsing histograms.
AI Key Findings
Generated Jun 16, 2026
Methodology — What approach did the authors take?
uringscope presents a model-driven reconstruction of per-request flows from kernel events, using a portable attachment method to unstable tracepoints via BTF-probed variants, CO-RE field flavors, and position-independent reads, integrated into a single static binary for multi-language observability of io_uring across kernel versions 5.15–6.17.
Key Results — What are the main findings?
- Aggregated per-request reconstruction achieves visibility with 0.7–9.9% throughput overhead on device-bound NVMe workloads, outperforming full-fidelity alternatives.
- A lightweight correctness mode detects submission-boundary hazards using the same reconstruction with evidence, supporting incident debugging.
- The tooling yields stable observability across io_uring lifecycle edges (SQEs to CQEs) despite unstable kernel tracepoints and lifecycle changes.
- Evaluation against perf, bpftrace, and strace demonstrates lower overhead and higher fidelity than prior approaches.
Significance — Why does this research matter?
Provides portable, low-overhead, language-agnostic io_uring observability that reconstructs per-request flows from shared-memory rings, addressing instability of tracepoints and improving incident debugging and operational reliability.
Technical Contribution — What is the technical contribution?
A request-lifecycle model for io_uring with a per-request flow reconstruction, a portable attachment technique for unstable tracepoints using BTF, CO-RE, and struct-centric reads, an overhead-vs-fidelity evaluation, and a lightweight correctness mode plus an evidence-backed doctor for operators.
Novelty — What is new about this work?
First single-binary, language-agnostic observability tool for io_uring that reconstructs per-request flows across multiple kernel versions, using CO-RE and BTF-probed variants to attach to unstable tracepoints with measurable overhead and built-in correctness assurances.
Limitations — What are the limitations of this study?
- Limited visibility on the submission side for inlined libraries or non-io_uring library paths; some paths require inlined or direct ring reads to observe.
- Observability surface is bounded by the last K requests per ring and depends on application deployment (non-virtualized environments may differ).
- Legacy 5.15 tracepoints offer only counters without full per-request trace fidelity; ongoing maintenance is required for lifecycle changes across kernels.
Future Work — What did the authors propose for future work?
- Extend visibility to more in-flight edge cases and larger overlap windows between SQEs and CQEs.
- Improve support for inlined completion-peek paths and direct CQE ring reads to broaden observability.
- Automate deployment adaptations for newer kernel versions beyond 6.x and reduce maintenance overhead of lifecycle model.
Paper Details
How to Cite This Paper
@article{chowdhury2026uringscope,
title = {uringscope: Portable, Low-Overhead Observability for io_uring},
author = {Chowdhury, Rajarshi},
year = {2026},
eprint = {2606.15137},
archivePrefix = {arXiv},
primaryClass = {cs.OS},
}
Chowdhury, R. (2026). uringscope: Portable, Low-Overhead Observability for io_uring. arXiv. https://arxiv.org/abs/2606.15137
Chowdhury, Rajarshi. "uringscope: Portable, Low-Overhead Observability for io_uring." arXiv, 2026, arxiv.org/abs/2606.15137.
PDF Preview
Similar Papers
Found 4 papersHigh-Performance DBMSs with io_uring: When and How to use it
Matthias Jasny, Muhammad El-Hindi, Tobias Ziegler et al.
Extended flag gadgets for low-overhead circuit verification
Dripto M. Debroy, Kenneth R. Brown
Low-Resolution Overhead Thermal Tripwire for Occupancy Estimation
Mertcan Cokbas, Janusz Konrad, Prakash Ishwar
Comments (0)