Publication
Metrics
AI Quick Summary
This research presents a machine learning method using historical and current map color compositions to predict economic statistics. It successfully forecasts population density in 1950s Sub-Saharan Africa and various economic factors in South Korea from 1930 to 2015, demonstrating the potential of maps as predictive tools in economic analysis.
Paper Preview
Abstract
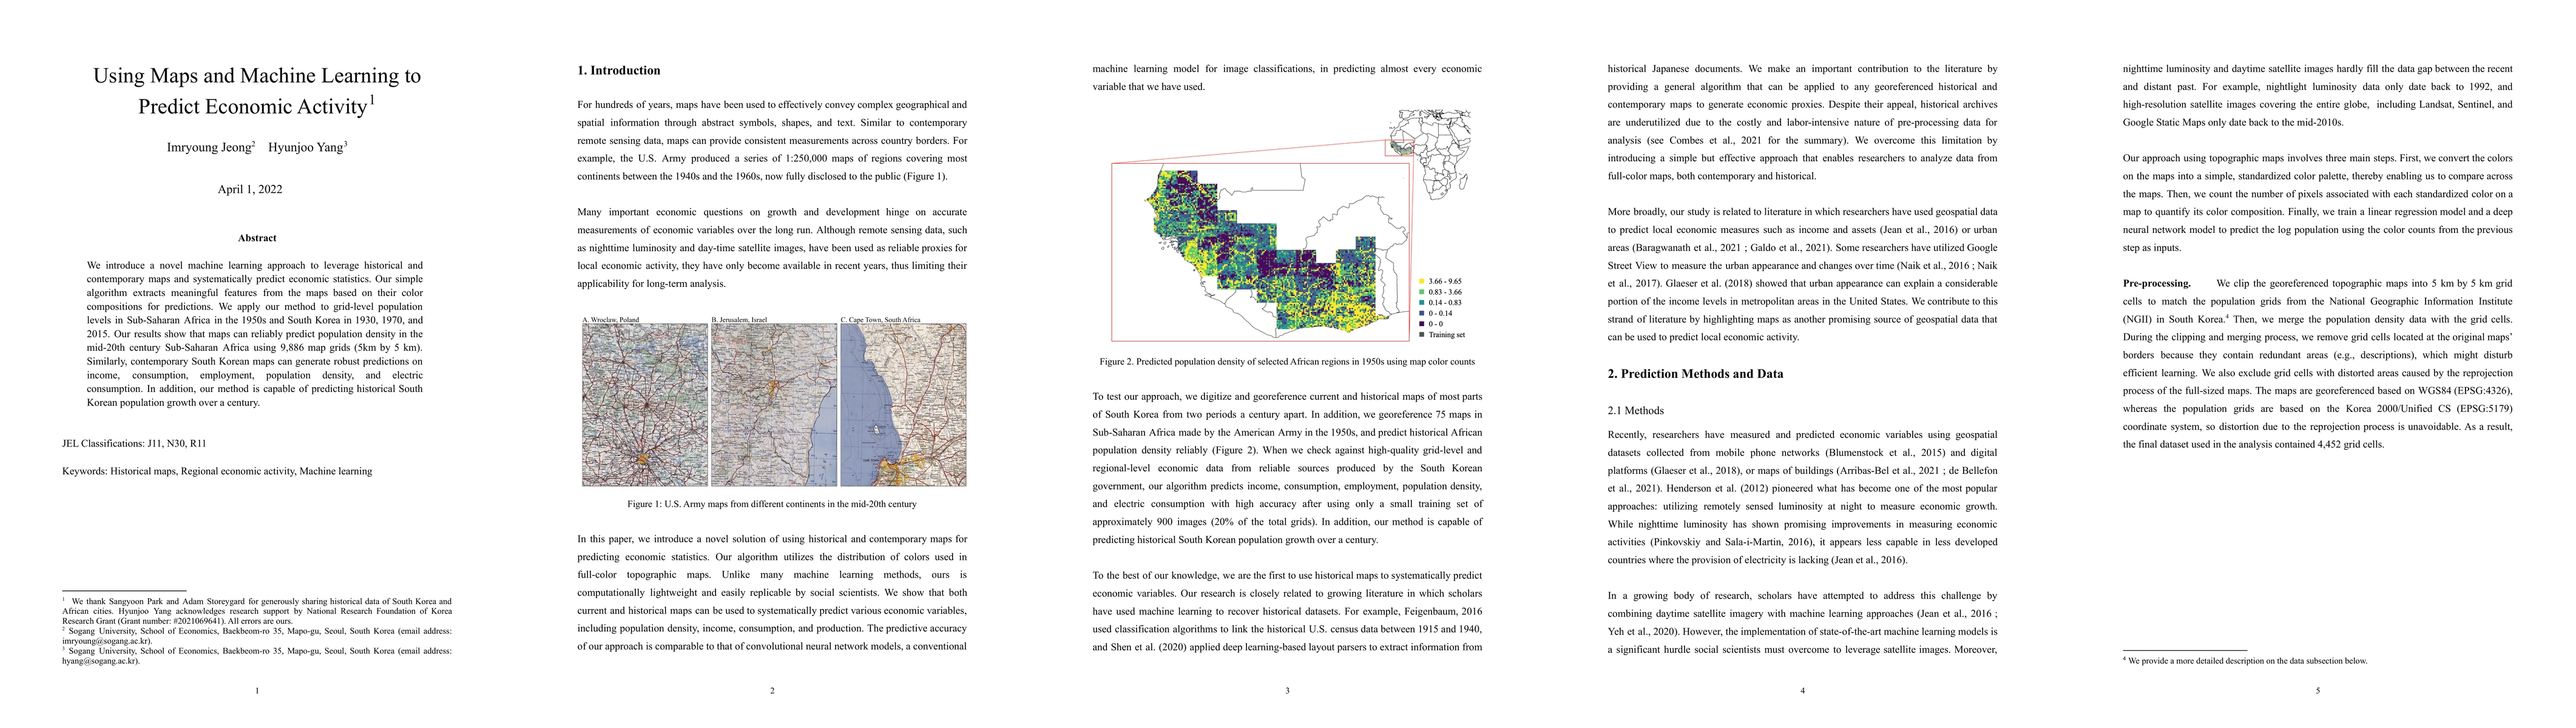
We introduce a novel machine learning approach to leverage historical and contemporary maps and systematically predict economic statistics. Our simple algorithm extracts meaningful features from the maps based on their color compositions for predictions. We apply our method to grid-level population levels in Sub-Saharan Africa in the 1950s and South Korea in 1930, 1970, and 2015. Our results show that maps can reliably predict population density in the mid-20th century Sub-Saharan Africa using 9,886 map grids (5km by 5 km). Similarly, contemporary South Korean maps can generate robust predictions on income, consumption, employment, population density, and electric consumption. In addition, our method is capable of predicting historical South Korean population growth over a century.
AI Key Findings
Get AI-generated insights about this paper's methodology, results, significance, and more — seven facets brought into focus.
Impact
Paper Details
Authors
PDF Preview
Key Terms
Citation Network
Current paper (gray), citations (green), references (blue)
Display is limited for performance on very large graphs.
Discussion 0