VisConductor: Affect-Varying Widgets for Animated Data Storytelling in Gesture-Aware Augmented Video Presentation
Publication
Metrics
AI Quick Summary
VisConductor introduces gesture-aware widgets for controlling animated data visualizations in augmented video presentations, enabling dynamic, interactive, and engaging remote content delivery. Studies show that this tool effectively supports both presenters and audiences in engaging remote presentations.
Paper Preview
Abstract
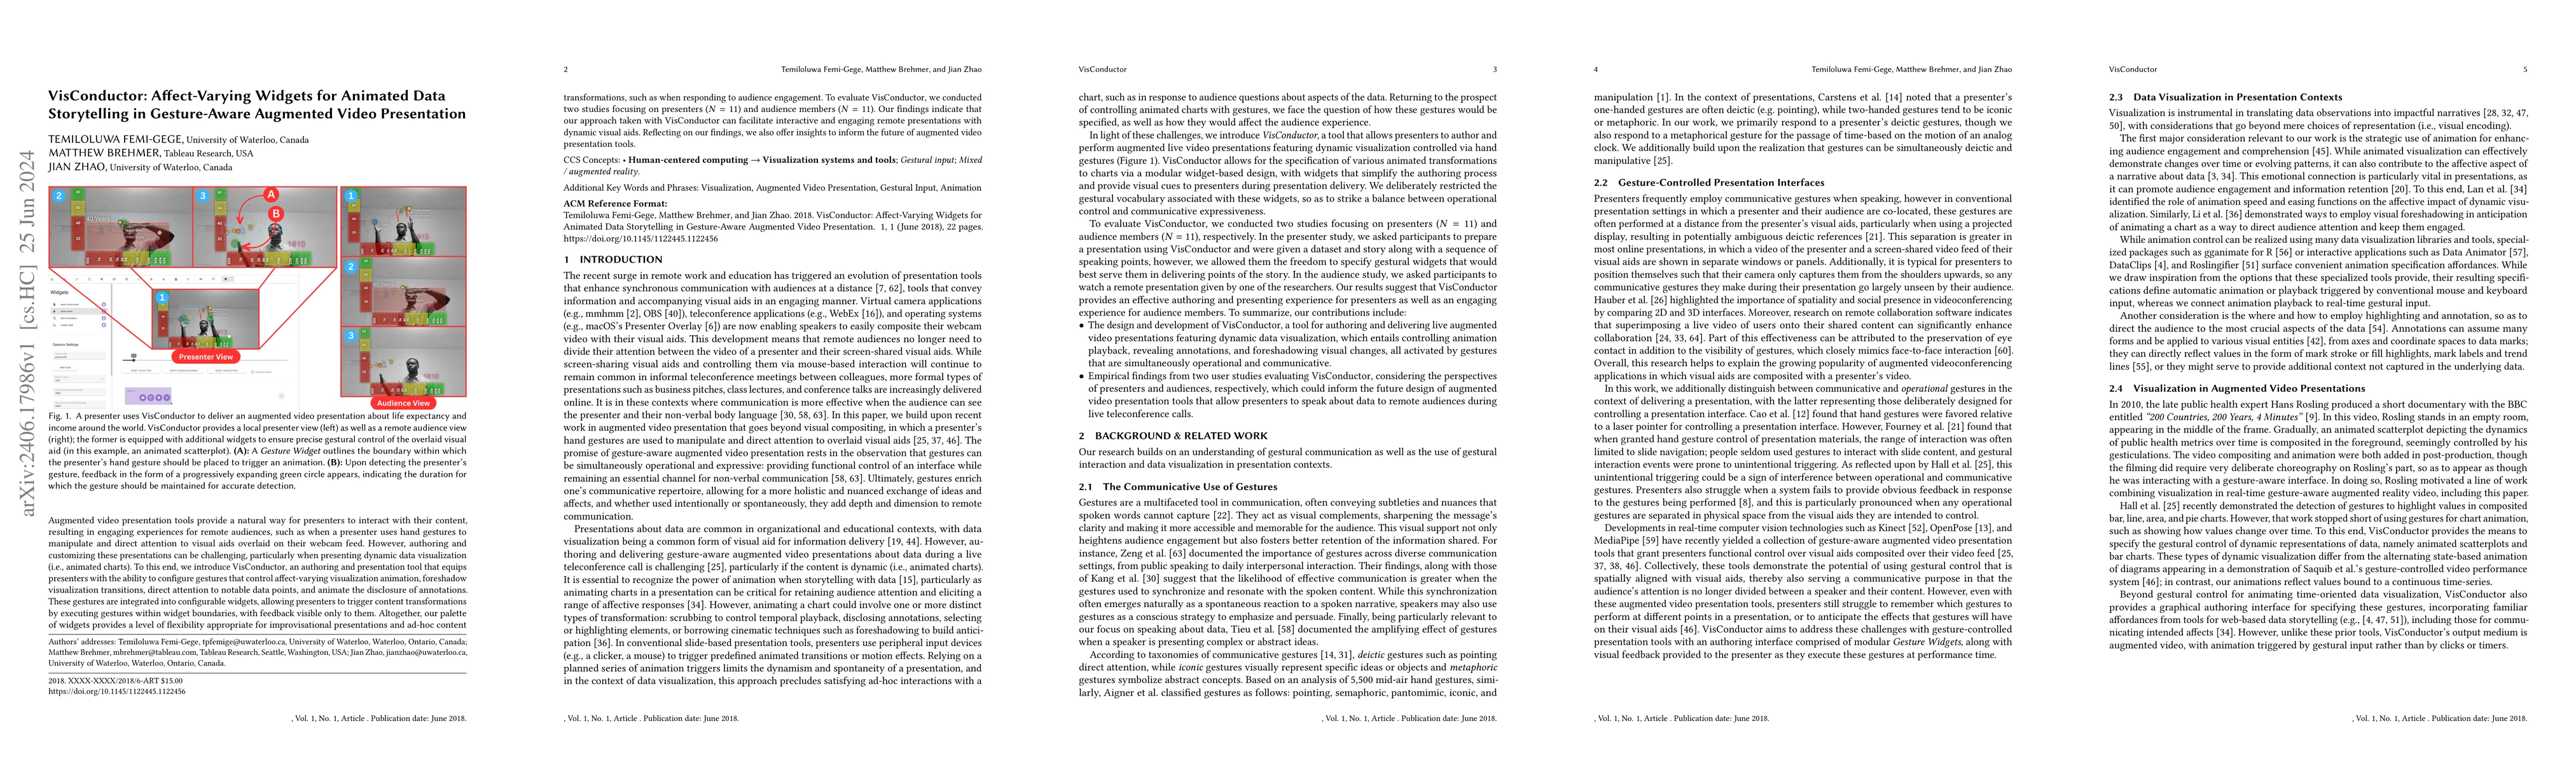
Augmented video presentation tools provide a natural way for presenters to interact with their content, resulting in engaging experiences for remote audiences, such as when a presenter uses hand gestures to manipulate and direct attention to visual aids overlaid on their webcam feed. However, authoring and customizing these presentations can be challenging, particularly when presenting dynamic data visualization (i.e., animated charts). To this end, we introduce VisConductor, an authoring and presentation tool that equips presenters with the ability to configure gestures that control affect-varying visualization animation, foreshadow visualization transitions, direct attention to notable data points, and animate the disclosure of annotations. These gestures are integrated into configurable widgets, allowing presenters to trigger content transformations by executing gestures within widget boundaries, with feedback visible only to them. Altogether, our palette of widgets provides a level of flexibility appropriate for improvisational presentations and ad-hoc content transformations, such as when responding to audience engagement. To evaluate VisConductor, we conducted two studies focusing on presenters (N = 11) and audience members (N = 11). Our findings indicate that our approach taken with VisConductor can facilitate interactive and engaging remote presentations with dynamic visual aids. Reflecting on our findings, we also offer insights to inform the future of augmented video presentation tools.
AI Key Findings
Get AI-generated insights about this paper's methodology, results, significance, and more — seven facets brought into focus.
Impact
Paper Details
Authors
PDF Preview
Key Terms
Citation Network
Current paper (gray), citations (green), references (blue)
Display is limited for performance on very large graphs.
Discussion 0