Visual Inference and Graphical Representation in Regression Discontinuity Designs
Publication
Metrics
AI Quick Summary
This study examines how accurately readers interpret statistical information from graphs in regression discontinuity designs, finding that bin widths and fit lines significantly affect visual inference accuracy. Recommendations suggest using small bins without fit lines for better graph construction, and visual inference complements traditional econometric methods with comparable or lower false positive rates.
Paper Preview
Abstract
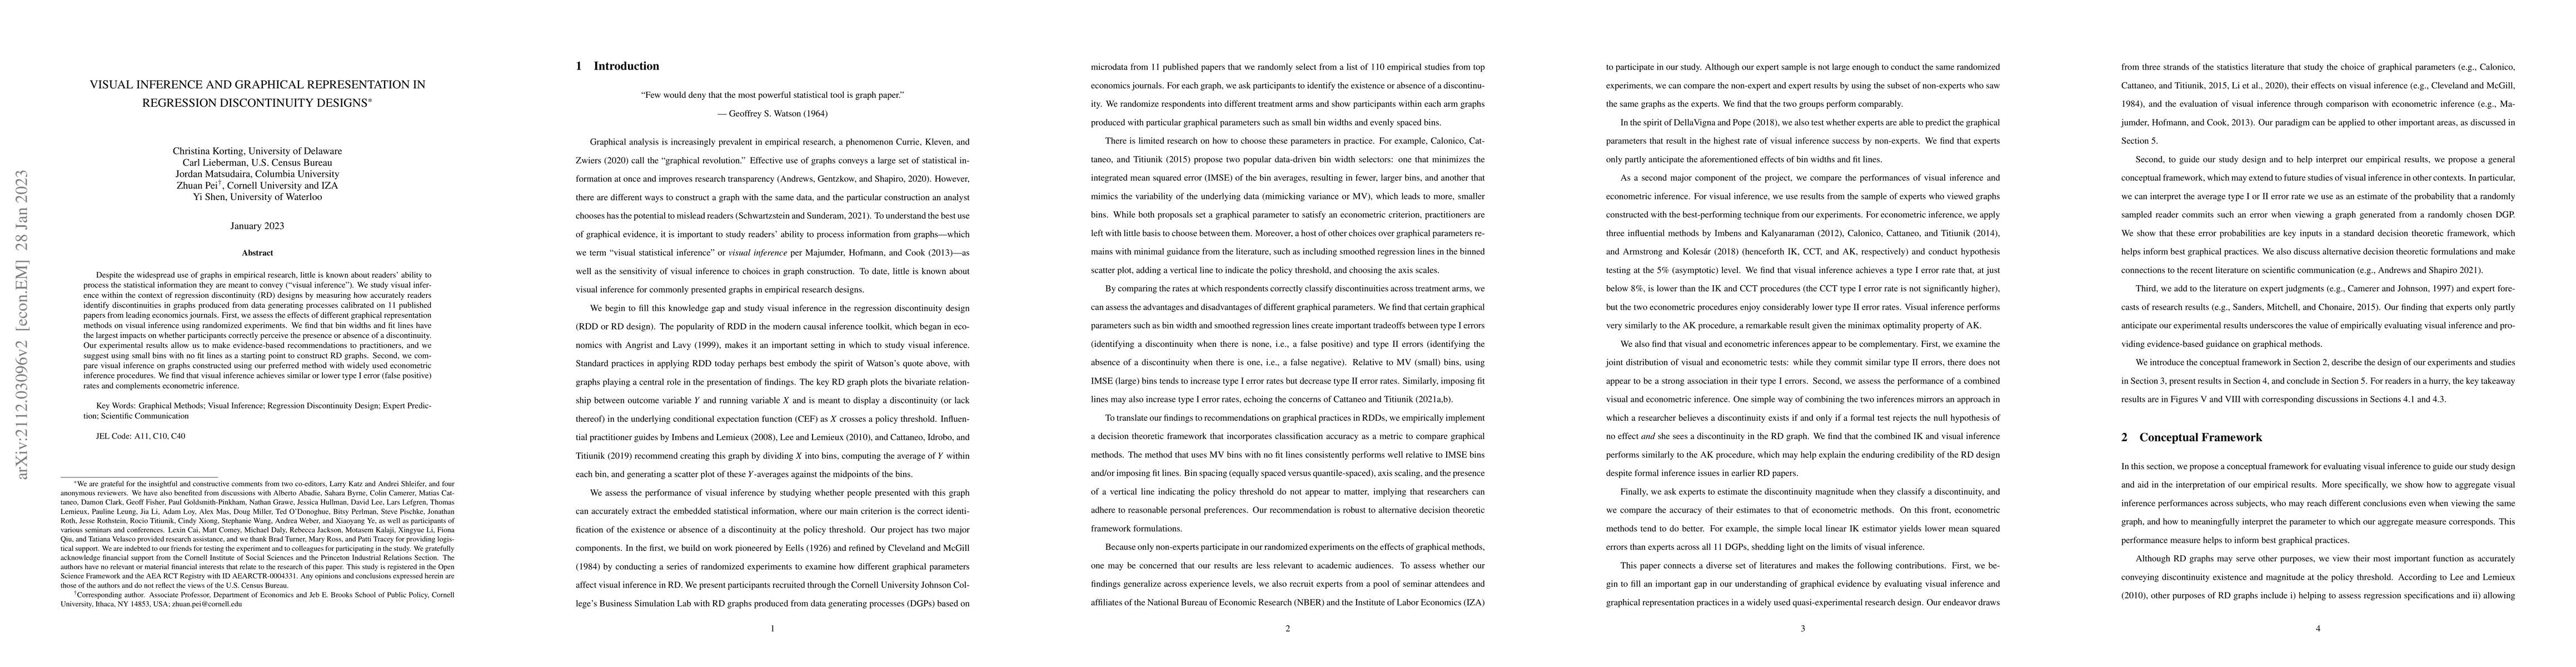
Despite the widespread use of graphs in empirical research, little is known about readers' ability to process the statistical information they are meant to convey ("visual inference"). We study visual inference within the context of regression discontinuity (RD) designs by measuring how accurately readers identify discontinuities in graphs produced from data generating processes calibrated on 11 published papers from leading economics journals. First, we assess the effects of different graphical representation methods on visual inference using randomized experiments. We find that bin widths and fit lines have the largest impacts on whether participants correctly perceive the presence or absence of a discontinuity. Our experimental results allow us to make evidence-based recommendations to practitioners, and we suggest using small bins with no fit lines as a starting point to construct RD graphs. Second, we compare visual inference on graphs constructed using our preferred method with widely used econometric inference procedures. We find that visual inference achieves similar or lower type I error (false positive) rates and complements econometric inference.
AI Key Findings
Get AI-generated insights about this paper's methodology, results, significance, and more — seven facets brought into focus.
Impact
Paper Details
Authors
PDF Preview
Key Terms
Citation Network
Current paper (gray), citations (green), references (blue)
Display is limited for performance on very large graphs.
Discussion 0