AI Quick Summary
VMC provides a structured grammar for visualizing statistical model checks through four components: sample distributions, transformations, visual representations, and layout designs. An R package implementation validates VMC's effectiveness by reducing the edit distance compared to existing tools, while expert interviews reveal insights into its practical use and challenges.
Quick Answers
What is "VMC: A Grammar for Visualizing Statistical Model Checks" about?
VMC provides a structured grammar for visualizing statistical model checks through four components: sample distributions, transformations, visual representations, and layout designs. An R package implementation validates VMC's effectiveness by reducing the edit distance compared to existing tools, while expert interviews reveal insights into its practical use and challenges.
What methodology did the authors use?
A mixed-methods approach combining both qualitative and quantitative methods was employed to investigate the role of model checking in statistical visualization. More in Methodology →
What are the key results?
The use of model checking in statistical visualization leads to more accurate and reliable results. — Model checking can help identify potential issues with visualizations before they are presented to users. More in Key Results →
Why is this work significant?
This research is important because it highlights the importance of model checking in statistical visualization, which has significant implications for data analysis and interpretation. More in Significance →
What are the main limitations?
The study was limited by the availability of data and the complexity of some visualizations. — The results may not be generalizable to all types of data or visualizations. More in Limitations →
Abstract
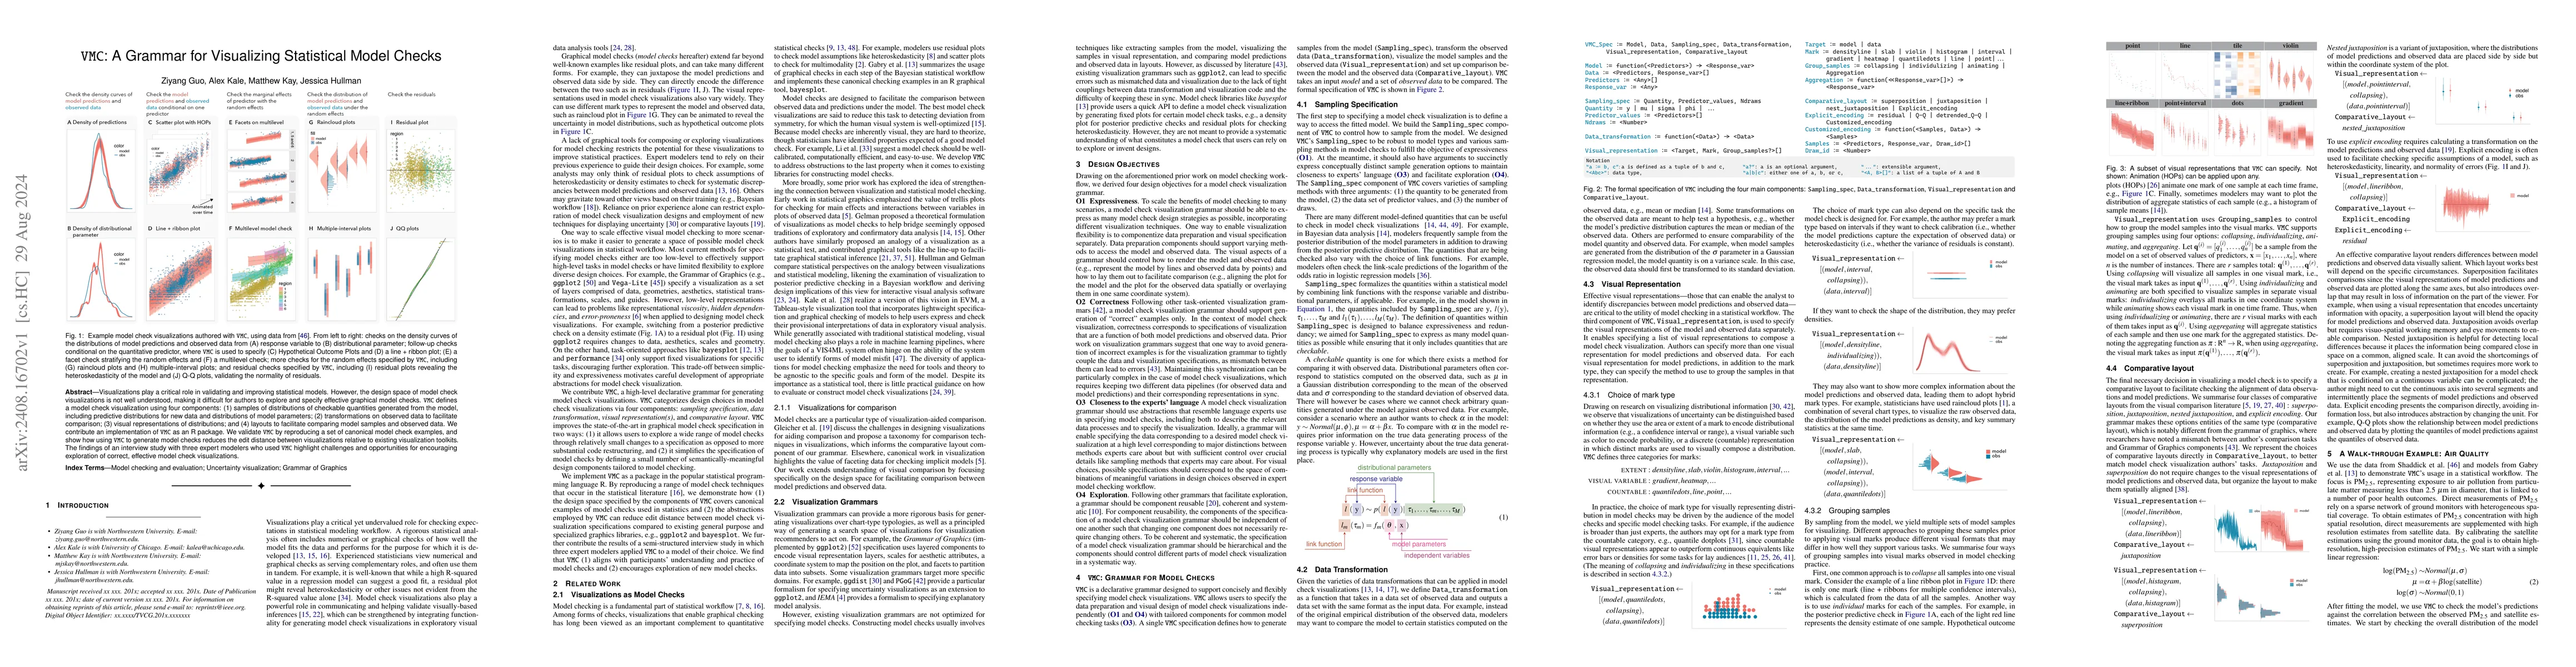
Visualizations play a critical role in validating and improving statistical models. However, the design space of model check visualizations is not well understood, making it difficult for authors to explore and specify effective graphical model checks. VMC defines a model check visualization using four components: (1) samples of distributions of checkable quantities generated from the model, including predictive distributions for new data and distributions of model parameters; (2) transformations on observed data to facilitate comparison; (3) visual representations of distributions; and (4) layouts to facilitate comparing model samples and observed data. We contribute an implementation of VMC as an R package. We validate VMC by reproducing a set of canonical model check examples, and show how using VMC to generate model checks reduces the edit distance between visualizations relative to existing visualization toolkits. The findings of an interview study with three expert modelers who used VMC highlight challenges and opportunities for encouraging exploration of correct, effective model check visualizations.
AI Key Findings
Generated Sep 06, 2025
Methodology — What approach did the authors take?
A mixed-methods approach combining both qualitative and quantitative methods was employed to investigate the role of model checking in statistical visualization.
Key Results — What are the main findings?
- The use of model checking in statistical visualization leads to more accurate and reliable results.
- Model checking can help identify potential issues with visualizations before they are presented to users.
- The application of model checking in statistical visualization can improve the overall quality of visualizations.
Significance — Why does this research matter?
This research is important because it highlights the importance of model checking in statistical visualization, which has significant implications for data analysis and interpretation.
Technical Contribution — What is the technical contribution?
This work contributes to the development of a new approach for model checking in statistical visualization, which can be used to improve the quality of visualizations.
Novelty — What is new about this work?
The use of model checking in statistical visualization is a novel application of this technique, which has significant implications for data analysis and interpretation.
Limitations — What are the limitations of this study?
- The study was limited by the availability of data and the complexity of some visualizations.
- The results may not be generalizable to all types of data or visualizations.
Future Work — What did the authors propose for future work?
- Further research is needed to explore the application of model checking in other areas of statistical visualization.
- Developing more advanced tools for model checking could improve the accuracy and reliability of visualizations.
How to Cite This Paper
@article{guo2024vmc,
title = {VMC: A Grammar for Visualizing Statistical Model Checks},
author = {Guo, Ziyang and Kale, Alex and Kay, Matthew and others},
year = {2024},
eprint = {2408.16702},
archivePrefix = {arXiv},
primaryClass = {cs.HC},
}
Guo, Z., Kale, A., Kay, M., & Hullman, J. (2024). VMC: A Grammar for Visualizing Statistical Model Checks. arXiv. https://arxiv.org/abs/2408.16702
Guo, Ziyang, et al. "VMC: A Grammar for Visualizing Statistical Model Checks." arXiv, 2024, arxiv.org/abs/2408.16702.
PDF Preview
Citation Network
Current paper (gray), citations (green), references (blue)
Display is limited for performance on very large graphs.
Similar Papers
Found 4 papersConsistency Checks for Language Model Forecasters
Daniel Paleka, Abhimanyu Pallavi Sudhir, Alejandro Alvarez et al.
A Neural Model for Regular Grammar Induction
Peter Belcák, David Hofer, Roger Wattenhofer
Gemini: A Grammar and Recommender System for AnimatedTransitions in Statistical Graphics
Younghoon Kim, Jeffrey Heer
A General Approach to Visualizing Uncertainty in Statistical Graphics
Bernarda Petek, David Nabergoj, Erik Štrumbelj
No citations found for this paper.
Comments (0)