01
MethodologyHow they did it
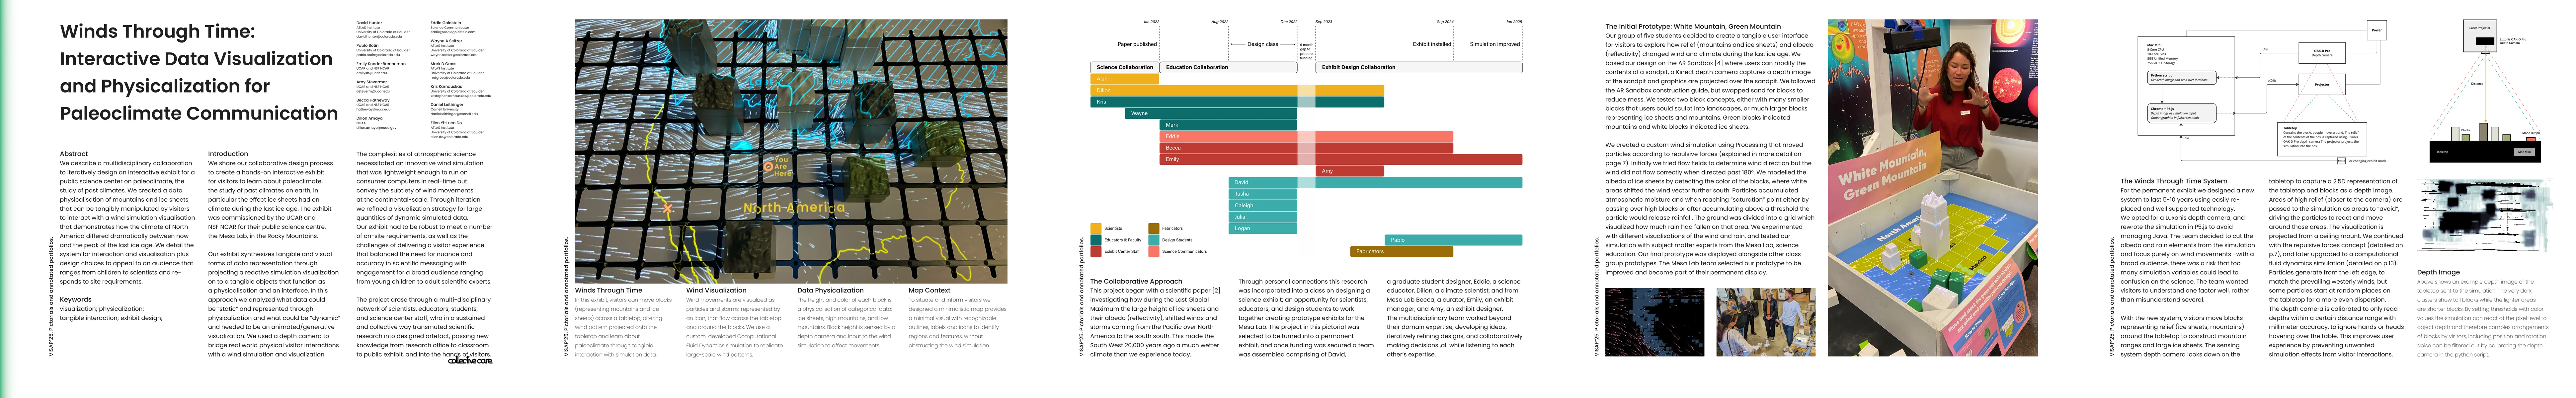
The research involved a multidisciplinary collaboration to design an interactive exhibit for a public science center, combining data visualization, physicalization, and user testing to communicate paleoclimate concepts.
Discussion 0