Contents
1302.4932
A utotnating Computer Bottleneck Detection with Belief Nets
John S. Breese Russ Blake
Microsoft Research One Microsoft Way
Redmond, WA, 98052-6399 ([email protected],[email protected])
Abstract
We describe an application of belief networks to the diagnosis of bottlenecks in computer systems. The technique relies on a high level functional model of the interaction be tween application workloads, the Windows NT operating system, and system hardware. Given a workload description, the model pre dicts the values of observable system counters available from the Windows NT performance monitoring tool. Uncertainty in workloads, predictions, and counter values are charac terized with Gaussian distributions. During diagnostic inference, we use observed perfor mance monitor values to find the most prob able assignment to the workload parameters.
In this paper we provide some background on automated bottleneck detection, describe the structure of the system model, and dis cuss empirical procedures for model calibra tion and verification. Part of the calibration process includes generating a dataset to es timate a multivariate Gaussian error model. Initial results in diagnosing bottlenecks are presented.
1 Introduction
Improving the performance of computer programs is a central theme in computer science. Considerable theo retical research (e.g. complexity analysis) and applied development (e.g. optimizing compilers) have been fo cused on improving performance, typically consider ing worst-case conditions in completely specified com puting environments. However, the actual, real-world performance of a program is inherently uncertain. We typically do not know the user's patterns of access of the program's functionality. We do not know the spe cific performance characteristics of the software and hardware on the particular machine in question. And typically we do not have perfect measurements of in ternal system states; rather there are some limited set of metered outputs from which we can determine per formance. In general, there has been relatively little work addressing the uncertain aspects of performance analysis in real-world, dynamic environments.
In this paper, we use the formalism of belief net works and probability as a framework for modeling the various types of uncertainty inherent in performance analysis, in particular the detection of bottlenecks. Most previous diagnostic applications have used be lief networks consisting entirely of discrete variables (e.g. [Beckerman et al., 1992]). There also have been systems developed that address interpreting results from a functional analysis in a discrete belief network [Breese et al., 1992]. Recently, there have been inte grated continuous/discrete approaches [Olesen, 1993], under the restriction that in the continuous portion of the network the variables have a linear-additive joint Gaussian distribution. In this paper, we develop a belief network that encodes a functional model of a computer operating system. The inference method combines expert assessments (the priors over hypothe ses and the model structure) with an empirically es timated error model. Since we make no assumptions about the nature of the underlying causal model, in ference provides an estimate of the most probable ex planation, not a complete posterior distribution.
In Sections 2 and 3, we discuss fundamental issues in performance analysis and bottleneck detection for those readers unfamiliar with the domain. In Section 4, we present issues in developing, calibrating, and ver ifying the model of the operating system. In Section 5, we present methods for inferring system behavior from observables, including learning an error model for model predictions, and in Section 6 present empir ical results. Eventual applications of this diagnostic capability include support for hardware purchase de cision making, advanced software development tools,
and dynamic system tuning.
2 Performance Analysis
The literature on computer performance evaluation has been largely concerned with answering the follow ing question: Given a planned workload, what selec tions of possible computer equipment, interconnection schemes, protocols, and algorithms should be made to produce satisfactory performance? This problem is generally attacked by determining the relevant char acteristics of the workload to be applied and the rel evant characteristics of the computer system perfor mance behavior. A model of the proposed system is constructed, verified against either the actual equip ment or a simulation, and used to predict the abil ity of the system to handle the proposed workload [Dowdy, 1989).
Several forms of evaluation have been proposed, each with varying tradeoffs. Analytic models, typically queuing theoretic models, are inexpensive to run and permit lots of experimental explorations. How ever, they often must make mathematical assump tions which do not reflect real system constraints ([Schweitzer et a!., 1993] and its references). Discrete event simulation models (e.g. [Yu et al., 1985]) match the internal structure and workflow algorithms of the proposed system in intricate detail, but precisely due to their detail are difficult to construct and expensive to run, reducing the number of experimental questions which can be asked. Nonetheless they provide inter esting information difficult to obtain otherwise, such as the marginal distribution of response times.
Models have also been built using Operational Anal ysis, a measurement-based technique pioneered by Buzen. [Buzen, 1976, Buzen and Shum, 1987]. Oper ational models are simple and easily verifiable on data collected during any specified time interval. Opera tional models rely on long run averages and therefore lack detail provided by queuing and simulation mod els, but provide indispensable first-order (i.e., average) performance metrics.
Atomic models [Blake, 1979, Gray, 1987] are a refine ment of operational models which assign atomic per formance values to fundamental system operations. Operational service times at devices can be thought of as molecules of device consumption; atomic models depict these molecules as being made up of atoms of device consumption combined to reflect the structure of the operating system. Atomic models permit de tailed operational models to be constructed and veri fied for existing or proposed systems, are computation ally simple, but like operational models provide only average performance metrics.
All of these types of models need a description of the workload which will be applied to the systems by the anticipated application. Application workloads are naturally expressed in terms of use of the facili ties the application makes available (e.g., open a doc ument or print a report.) When possible, the original workload used to drive the model can be taken from traces of real system activity on a pre-existing sys tem [Yu et al., 1985]. Methods have been developed for hierarchically decomposing application functional actions into system level calls for input into models [Graf, 1987, Raghavan et al., 1987]. All of this litera ture assumes the workload is known; the problem is in specifying it economically at the right level of detail for consumption by the model.
Over the past decade there has been a shift away from monolithic applications on dedicated hardware to a client/server environment where inter-communicating applications are thrown together on a mix of servers. Ferrari has noted that "no systematic methodolo gies are known to reduce a multi-computer work load's description to a more compact and represen tative model of that workload" [Ferrari, 1989]. The independent construction of the applications and op erating systems-combined with their inter-dependent operation-make it very difficult, if not impossible, to specify the workload. Furthermore, much of the work load applied to a system may not be the direct plan of the application designer at all. For example the amount of paging traffic induced by placing a particu lar application onto a particular system is seldom the intent of the application designer, since typically the application co-exists on the system with other appli cations, and the cumulative effect determines paging behavior. These very real concerns threaten to render the large body of effort thus far expended on computer performance modeling irrelevant, because the work load to be supplied to any model cannot be known a pnon.
The thrust of our research is to overcome this fun damental problem by using probabilistic methods to infer the most probable existing workload from the performance measures provided by an existing sys tem. In the situation where a new application is to be added to an existing configuration, the inferred work load can then be combined algebraically with the an ticipated application workload derived using the con ventional techniques referenced above. If the inter process interactions are too strong for the anticipated application workload to be characterized in isolation [Ferrari, 1989], a prototype of the new application em bedded in the expected environment can be measured to infer the new composite workload. The resulting workload can be used to drive the many sorts of mod-
els discussed above, enabling classical analyses such as identifying the bottleneck and its causes, predicting the effect of equipment purchases, or predicting the effects of changes in operating system algorithms.
Previous attempts to automate bottleneck detec tion expertise have been constructed using rule-based techniques and have focused on performance tuning [Irgon et al., 1988, Domanski, 1989]. These methods have no explicit representation of a workload or a model of the system. While shown to be useful for automating tuning, a rule-based approach cannot be easily manipulated to extrapolate changes in the work load, differences in hardware configuration, or revi sions in operating system algorithms. In addition these methods provide no explicit methodology for manag ing uncertainty in the heuristics or their mapping to the rules.
3 Bottleneck Detection
Computer performance bottlenecks are typified by the overconsumption of some hardware resource. Usually this results in the underconsumption of other hardware resources resulting in a delay completing the workload. Once a particular resource is identified as the bottle neck, a number of remedies exist. These include dis tributing the load across additional instances of that resource, installing a faster resource, or redesigning the workload to use another resource instead. These ac tions will resolve the bottleneck by reducing the time spent using the bottlenecking resource, possibly even shifting the bottleneck to another component. Bot tlenecks cannot be eliminated, only moved, because there is always some resource which can be faster to the benefit of the workload's completion time.
A transaction is a unit of work on a computer system. The notion of a transaction is meant in the widest sense of an interaction with the system at a level of abstraction convenient to the workload: saving a file, sending a piece of e-mail, or compiling a program. The total time the transaction uses on each system resource is called the demand for that resource. Based on these sorts of fundamental notions, we can characterize bot tlenecks using well established Operational Laws of Computer System Performance [Buzen, 1976].
Let D; be the demand for resource i and Dj be the demand for resource j. The Consistency Law states:
where U; is the utilization of resource i. Utilization is the proportion of time that a resource is actually in use. This tells us that the devices will be busy in relation to the demand for them.
The throughput of a device measures the number of transactions per second a resource or system can ser vice. One consequence of the Consistency Law is that resource utilization may not be maximum in order for a system to be achieving maximum throughput, T m , defined in units of transactions/second. The maximum throughput for any resource i is
Clearly, the resource with the smallest rm in the sys tem for this transaction will determine the maximum throughput the system can achieve. This resource is the bottleneck. Making any other resource faster can never yield more throughput, it can only make the in correctly improved resource have lower utilization.
For example suppose that a transaction requires 0.3 seconds of processor time and 0.5 seconds of disk time, and no other resource time in a single processor, sin gle disk system. The processor can handle 3.3 trans actions/second, while the disk can handle 2 transac tions/second. So the overall system can handle only 2 transactions per second, at which point the disk will be saturated with utilization = 1. By the Consistency Law, the utilization of the processor at that point will be 0.3/0.5 = 0.6, or 60%. This gives rise to what is known as the Throughput Law, which says that for all devices, the overall throughput of the system, T, is given by the following:
Several problems arise which prevent the simplistic de tection of bottlenecks by merely observing device uti lization. The first problem is one of inadequate system instrumentation. Frequently, resource utilizations are not measured. This is partly due to a lack of fast, inexpensive, accurate clocks for timing the usage of resources, and partly due to a lack of computer indus try coordination concerning the metering of resource activity and access to that information throughout the hardware hierarchy. Even in a modern system such as Microsoft's Windows NT which supports over 500 dif ferent performance metrics [Blake, 1995], inadequate instrumentation remains an impediment to bottleneck detection. Gradual improvement is being made in these areas, but for the foreseeable future there is often a need to infer device utilization indirectly.
Another problem confounding simple bottleneck de tection is that certain resources are used to satisfy fundamentally different workload requirements. In the above example we deduced that the disk was the bot tleneck, but we cannot simply conclude that a faster
disk is the correct solution. Modern computer systems use disks and local area networks for both virtual mem ory and file storage. A shortage of RAM can cause disk activity as easily as file activity can, so the correct so lution might be to buy more RAM, not faster disks. Even if the activity is simple file activity, modern sys tems also use RAM to cache file data, so even if the activity is pure file access the addition of RAM may still be the right solution. Conversely if the activity is one-time sequential file access, it is unlikely that addi tional RAM will be of assistance, and a faster disk is required.
Which of these causes of the bottleneck prevails in a given case is key to the correct remedy. To answer this question we must infer the bottleneck's cause from existing system metrics, an inherently uncertain en deavor. That is the intent of this research.
4 A Model of Computer System Performance
The system model we have developed combines work load attributes with calibrated operating system char acteristics and calibrated hardware resources to pre dict performance monitor counters. To accomplish this it must approximate the algorithm the operat ing system uses to allocate the workloads to resources. Despite the wealth of services offered by modern oper ating systems, such a model can be built at a fairly high level of abstraction with reasonable accuracy [Blake, 1979, Gray, 1987].
A high level of abstraction is possible because a surprisingly small number of basic operations com prise the majority of sustained activity inherent in most bottlenecks. This is in part due to the kernel [Ritchie and Thompson, 1974] and microker nel [Accetta et al., 1 986] approaches to operating sys tem construction. In this design paradigm, shared in large part by the Windows NT operating system [Custer, 1993], system services are built on top of a relatively small number of primitive functions compris ing the kernel of the operating system. Knowing the instruction path lengths of those kernel primitives at the root of sustained operations is sufficient to charac terize the majority of system activity, since most non primitive services are constructed using these atomic services as building blocks.
In such an atomic model of an operating system, the workload is most naturally specified at the level of the important subset of calls to invoke operating system services. Such simplifications, while providing concise, powerful models, contribute to an underlying uncer tainty that the abstract model will accurately match
actual system behavior.
The model we have constructed addresses the domain of the server in a network, a system which provides services to other computers over network connections. This is a domain of particular interest to bottleneck detection since the responsiveness of the network is fre quently limited by bottlenecks in the networks servers. We have deferred treatment of workstation graphics and the network as a whole.
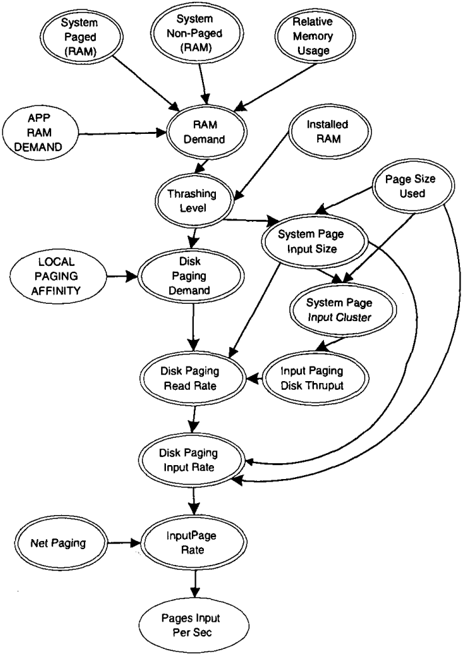
The portion of the model which determines the amount of pressure on RAM page frames will illustrate its con struction. A belief network of the model of paging behavior on Windows NT appears in Figure 1. The figure shows the structure of the model. The values of variables shown in double ovals are deterministic func tions of the values of their predecessors. Deterministic nodes with no predecessors are constants based on the calibrated hardware or software, or are functions of variables in other portions of the model.
40 Breese and Blake
The application workload parameters are shown in Figure 1 as chance nodes ( single ovals ) at the upper left. The APP RAM DEMAND is the amount of RAM the application must access at steady state. The LO CAL PAGING AFFINITY is a number between 0 and 1 indicating the fraction of active virtual memory that is on the local server, as opposed to the fraction that is elsewhere on the network. At the bottom of Figure 1 is a chance node denoting a system counter or met ric, Pages Input Per Second. This is the rate of input page traffic, a key system performance counter indi cating how severely the system is thrashing or mov ing pages between RAM and disk or network. The other deterministic nodes in Figure 1 denote the in ternal operating system state variables that are well characterized when their predecessors are known, but are typically unmetered and hence unobservable.
4.1 Calibration
In applying the model it is necessary to calibrate the hardware resource maximum bandwidths. This is ide ally done on the system under test. Complex interac tions between processor, memory, bus, controller, and device speeds make it difficult to measure the maxi mum throughput of a device in one system and ex trapolate that throughput maximum to a different en vironment. Even identical processors with the same clock speed can deliver wildly different performance due to differences in size and design of the memory cache subsystem. Such differences can only be de tected by calibration on a system of identical design and construction.
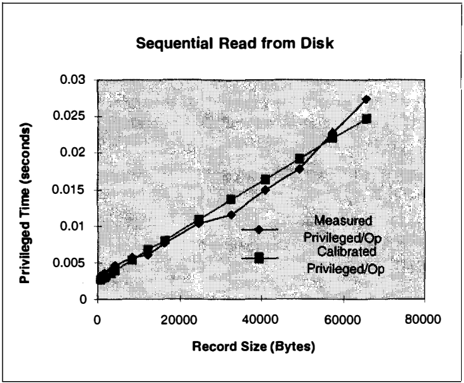
A synthetic workload generator is used to apply known workloads for calibration. The limits of throughput are collected for each resource over a range of key pa rameters, and placed into a data base for later ex traction. When possible, simple linear regressions are performed to extract parameters for resource charac teristics. Figure 2 illustrates one such regression. The processor overhead for disk operations is greatly de pendent on the type of disk controller installed in the system. The fit is good, but deviations introduce ad ditional uncertainty into the model.
4.2 Verification
Before the model can be put to use it is necessary to verify its accuracy. Let w be a vector of workload pa rameters of length m. Let 2p = f( w) be the vector of predicted counter values of length n. The synthetic workload generator is used to construct a series of one dimensional workloads. Each generated workload ex ercises a single system service, varying a key workload parameter w;, while holding the others fixed. Such a
workload might be the sequential reading of a file from disk, with w; being the size of the record read, and taking on a sequence of increasing record sizes. These synthetic workloads are applied to a system, and the vector of actual performance counters, Ca, are logged for each value assumed by the key workload parameter W;.
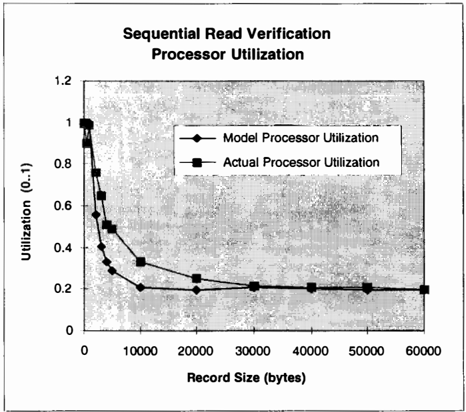
An identical series of one-dimensional workloads is then applied to the model, and the predicted perfor mance counters 2p are recorded for each level of w; . The results of the model's predictions are compared to the actual performance counters from the real sys tem. Figure 3 illustrates a comparison of a particular actual counter c{ to a corresponding model predicted counter value c{, over a series. of values assumed by a key workload parameter w;.
4.3 Model Refinement
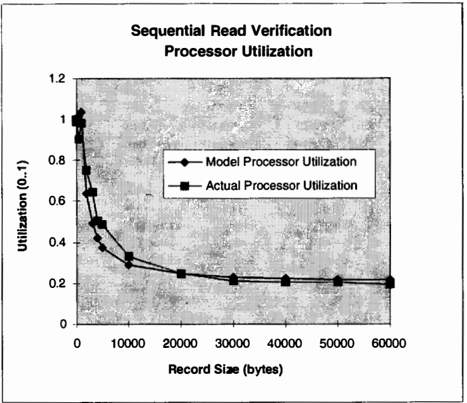
Verification results can be used to refine the model specification. For example we were concerned about the deviation in Figure 3 of model predicted processor utilization from that observed when the workload was applied to the real system. Examination of the atomic model intermediate values showed that the major com ponent of processor demand was the processor being used by the operating system to read the data from the disk. In the model which produced Figure 3 this was expressed as a linear function of the application's read size in bytes.
A more refined model of this activity can be obtained by first regressing operating system processor usage against the size of a read from disk, as shown in Fig-
ure 2. The operating system processor usage for read ing from disk during sequential reads can then be de termined from this regression by evaluating the regres sion formula at the size of the read-ahead record used by the operating system. The read-ahead size depends on the operating system kernel in Windows NT and not on the application record size. The operating sys tem overhead for each read-ahead multiplied by the ratio of application read size to system read-ahead size gives the processor overhead for sequential reading.
This new model produces the more accurate verifica tion depicted in Figure 4. Although the refinement is an improvement over that shown in Figure 3, it is not perfect and the discrepancy is a continuing source of uncertainty.
One important initial question concerned the robust ness of the model with respect to other computer sys tems than the one on which it is initially tested. As of this writing we have verified the model to acceptable levels across a number of systems, including an Intel 486, an Intel Pentium, and a DEC Alpha, all running Windows NT.
5 Inference
During inference we wish to determine those values of the workload parameters that best explain the ob served performance counter values. As before, w is a vector of workload parameters of length m and Cp = !( w) is the vector of predicted counter values of length n. As before, let Ca be the vector of actual counter values corresponding to 2p. The function f
captures the dependence of the counter values on the workload and has been described in Section 4. In this section we describe two methods for reasoning with this model, that is finding the value of w that best explains Ca.
5.1 Inversion
For an initial formulation of this problem we choose to not represent uncertainty explicitly. We let 2p = Ca and then the best explanation is obtained by solving for workload parameters:
Unfortunately, we cannot solve for w analytically due to numerous discontinuities and non-linearities in the model f. The discontinuities arise in discrete shifts in operating system algorithms, such as differences in file system implementation when the record size is a mul tiple of the page size. Thus, in applying this technique we use numerical methods to search for the w* that is a solution to:
where the a; are weighting or normalization factors. We refer to this inference method as inversion.
We have used a Monte Carlo technique to explore the solution surface and provide evidence that there is a single solution for a variety of workloads, searching over a substantial number of samples.
5.2 Most Probable Explanation
From a probabilistic perspective, the best explana tion of the observed counters is that workload assign ment with maximum probability given the data, that is the assignment that is the most probable explana tion (MPE) for the observations.
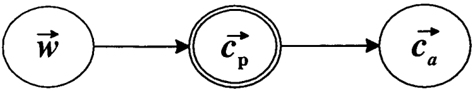
The uncertainty structure for this problem is shown in Figure 5 as a belief network. The network represents the conditional independencies we have asserted in this domain [Pearl, 1988]. The functional relationship be tween workload (w) and predicted counters (C"p), the atomic model, is reflected in the double-oval represen tation in Figure 5.
Although the inversion method has been effective in initial experiments in identifying bottlenecks for pure workloads, it ignores several critical factors. It is non Bayesian to the extent that it disregards prior infor mation regarding the distribution of application work loads. Also, it does not explicitly account for modeling and measurement uncertainty in the relationship be tween actual and predicted counters. For example the fact that the measurement system is running intro duces some systematic biases into the observed coun ters that are not explicitly modeled. The probabilistic inference measure accounts for these issues implicitly by modeling the error in the predictions.
Uncertainty in the belief network is characterized by Pr( wl�), the prior distribution of workload parameters, and Pr( Ca IC"p, �) the uncertain relationship between the predicted and actual counter values. In these expres sions, � is background information including such fac tors as the installed hardware and the version of the operating system software 1 .
The MPE assignment w* is that set of workload pa rameters w that has the maximum probability given the observed counters, that is
Given the belief network model, we can write the joint
1 Recall that model parameters relating to inherent hardware and software speed on a particular machine and release of the operating system are fixed during calibration.
probability of the variables of interest as:
and we have
Since the denominator is a constant in any particular case, Equation 2 becomes:
where k is a constant.
In evaluating this expression, we made two sets of as sumptions. First, we assumed that the workload pa rameters are marginally independent, as indicated in Figure 5. In various experiments, we have assumed these parameters to be either uniformly or lognormally distributed. With lognormally distributed workloads we have:
where Jli, <T;, and a; are the logarithmic mean, stan dard deviation, and minimum value respectively for workload component w;, i = 1 ... m. The values of these parameters are provided by direct assessment from an expert.
Second, we assume a multivariate Gaussian error model, that is ca = f( w) + ? where ? ,..., N (jl,, �) and jl, is the vector of mean errors and � is an n by n covariance matrix [DeGroot, 1970]. We esti mate the mean errors and covariance from a sample of known workloads, model predictions, and actual counter values on the target system. Using techniques from [DeGroot, 1970], we can update the parameters of the error model by assuming that the distribution for jl, is multivariate normal and the distribution for �-l is Wishart. For purposes of this study, we will estimate jl, using the sample mean error and estimate � with the sample covariance from a set of verification samples.
Using procedures similar to those applied during veri fication, we can run a set of controlled experiments on the target machine to generate model error data. For a set of sampled known workloads, we generate model
| App Workload | Counters |
|---|---|
| Inte·r-opemtion cpu times: -Sequential Write -Sequential Read -Random Read -Random Write Sequential Read Size Sequential Write Size Random Read Size Random Write Size Random Read Extent Random Write Extent RAM Demand | System.PctPriv System.PetUser System.SystemCal!Rate Disk.DiskReadByteRate Disk.DiskReadRate Disk.DiskWriteByteRate Disk.DiskWriteRate Cache.CopyReadHitsPct Cache.CopyReadsPerSec Cache.LazyWritePgsPerSec Memory.PgFaultsPerSec Memory.CacheFaultsPerSec Memory.PageslnputPerSec Memory.PagesOutputPerSec |
predictions ( using the calibrated model ) and collect ac tual counter values. This is the sample for estimating the covariance matrix.
Since the actual error given a set of workload param eters is just ca -J( w), then the probability of the ob served counter values, given the model f and w is cal culated as follows.
where c = (211') - n/2/E/-112. Equations 4 and 5 are used to evaluate Equation 3.
As discussed previously, the function f is not well be haved since it incorporates various thresholding behav iors and integer constraints in the operating system. Therefore these optimization problems cannot be per formed analytically and we have used numerical search techniques to find solutions. We discuss these results in the following section.
6 Implementation and Results
The Windows NT system model and inference proce dure have been implemented in Microsoft Excel. We utilize the Excel Solver feature to provide the numer ical optimization procedure to search for the desired workload vector w under the inversion method ( Equa tion 1) as well as the MPE assignment ( Equation 3). The application workload parameters ( w) and coun ters ( Ca, S,) that are in the model are listed in Table 1.
In order to test the inference procedures, we impose a set of known workload parameters on a given platform and collect actual performance monitor counters. The model is then used to infer the workloads. Our test suite consists of the following cases which vary as to the nature of the bottleneck and its cause:
- Sequential Read
- Sequential Write
- Random Read
- Random Write
- Paging
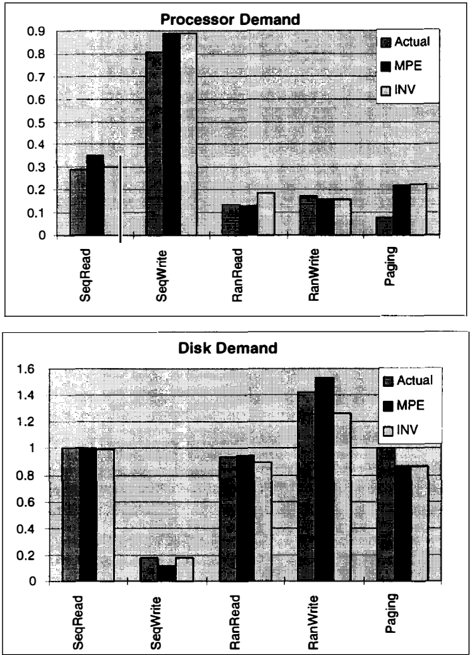
In each of these cases, the both the inversion and MPE methods are able to identify the correct bottleneck. For the MPE method, we have been able to estimate the error model on a verification set of over 180 cases representing model predictions and actual values for three different machine configurations. Even with this sparse dataset, performance is encouraging. The Fig ure 6 shows that for every scenario, the model is find ing the correct bottleneck and a good approximation of demand.
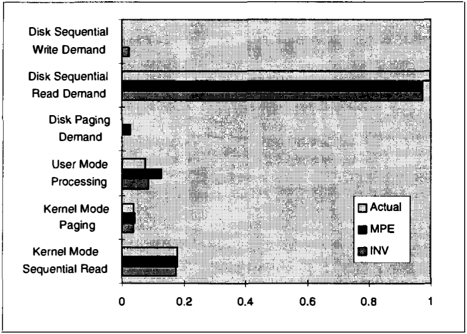
In Figure 7, we see additional detail regarding uti lizations for the case of Sequential Reads. Again the actual levels of each variable along with inferred val ues using the MPE and inversion methods are shown. Again, both methods are finding the correct solution.
To this point in development, both methods have been able to correctly identify pure workloads and bottle necks. We anticipate that for more diverse, real-world loads, the MPE method using an error model esti mated on the target machine will provide the best performance. In addition, in the cases we studied, the MPE method converges to the solution much faster than inversion. This is probably due to the improved directional information provided by using a full covari ance matrix.
7 Conclusions and Future Work
We have developed a core model and inference method ology for detecting computer system bottlenecks. We are currently extending and verifying the model in net work and graphics subsystems. The probabilistic in ference methodology relies on a substantial amount of data during verification to learn the error model. For tunately, in the realm of computer performance anal ysis it is relatively easy to generate the needed data and we are working to automate that data collection effort.
We have presented this material primarily in terms of detecting bottlenecks, a diagnostic task. However, as in medicine, diagnosis is rarely an end in itself ultimately we wish to "treat" the patient. In the computer domain, the primary classes of therapy are changing hardware (e.g. adding memory to improve performance) and redesigning software to utilize less critical resources.
We plan to use similar approaches to predict the ef fects of changes to application workload parameters. The model can predict throughput and bottlenecks given an increment to application workloads. It also can be used by software developers to predict the per formance of their application, and to help determine which portions of the program merit additional design and implementation effort.
Finally, since the model includes many variables re lating to operating system design and algorithms, this approach can address issues relating to the structure of the operating system itself. This would include off line design studies, for example, estimating the possi ble system-wide effects of different paging algorithms. Similar models could also potentially be used for dy namic tuning of system operating parameters, such as cache sizes, in response to inferred application load ings.
Acknowledgments
The authors thank David Heckerman and the anony mous referees for useful comments and suggestions.
References
[Accetta et al., 1986] Accetta, M., Baron, R., Bolos ky, W., Golub, D., Rashid, R., Tevanian, A., and Young, M. (1986). Mach: a new kernel for UNIX development. In Proceedings of USENIX Associa tion Summer Conference, pages 93-112, Atlanta.
[Blake, 1979] Blake, R. (1979). Tailor: A simple model that works. In Proceedings Conference on Simula tion, Measurement, and Modeling of Computer Sys tems, pages 1-11, Boulder, CO. ACM.
[Blake, 1995] Blake, R. (1995). Optimizing Windows NT. Microsoft Press, Redmond, WA.
[Breese et al., 1992] Breese, J., Horvitz, E., Peot, M., Gay, R., and Quentin, G. (1992). Automated decision-analytic diagnosis of thermal performance in gas turbines. In Proceedings International Gas Turbine And Aeroengine Congress and Exposition. American Society of Mechanical Engineers. 92-GT399.
[Buzen, 1976] Buzen, J. (1976). Fundamental opera tional laws of computer system performance. Acta Informatica, 7:167-182.
[Buzen and Shum, 1987] Buzen, J. and Shum, A. W. (1987). A unified operational treatment of rps recon nect delays. In Proceedings Sigmetrics Conference on Measurement and Modeling of Computer Sys tems, pages 78-92, Banff, Alberta, Canada. ACM.
[Custer, 1993] Custer, H. (1993). Inside Windows NT. Microsoft Press, Redmond, WA.
[DeGroot, 1970] DeGroot, M. (1970). Optimal Statis tical Decisions. McGraw-Hill, New York.
[Domanski, 1989] Domanski, D. (1989). A PROLOG based expert system for tuning MVS/XA. Perfor mance Evaluation Review, 16:30-47.
[Dowdy, 1989] Dowdy, L. (1989). Performance predic tion modeling: A tutorial. In Proceedings Sigmetrics and Performance '89 International Conference on Measurement and Modeling of Computer Systems, page 214, Berkeley, California. ACM.
[Ferrari, 1989] Ferrari, D. (1989). Workload charac terization for tightly-coupled and loosely-coupled systems. In Proceedings Sigmetrics and Perfor mance '89 International Conference on Measure ment and Modeling of Computer Systems, page 210, Berkeley, California. ACM.
[Graf, 1987] Graf, I. (1987). Transformation between different levels of workload characterization for ca pacity planning. In Proceedings Sigmetrics Confer ence on Measurement and Modeling of Computer Systems, pages 78-92, Banff, Alberta, Canada. ACM.
[Gray, 1987] Gray, J. (1987). A view of database system performance measures. In Proceedings Sig metrics Conference on Measurement and Modeling of Computer Systems, pages 3-4, Banff, Alberta, Canada. ACM.
[Heckerman et al., 1992] Heckerman, D., Horvitz, E., and Nathwani, B. (1992). Toward normative expert systems: Part I. The Pathfinder project. Methods of Information in Medicine, 31:90-105.
[Irgon et al., 1988] Irgon, A., Dragoni, A., and Huleatt, T. (1988). Fast: A large scale expert system for application and system software perfor mance tuning. In Proceedings Sigmetrics Conference on Measurement and Modeling of Computer Sys tems, pages 151-156, Sante Fe, New Mexico. ACM.
[Olesen, 1993] Olesen, K. G. (1993). Causal proba bilistic networks with both discrete and continuous variables. IEEE Transactions on Pattern Analysis and Machine Intelligence, 15(3).
[Pearl, 1988] Pearl, J. (1988). Probabilistic Reasoning in Intelligent Systems. Morgan Kaufman, San Ma teo, Ca.
[Raghavan et al., 1987] Raghavan, S., Vasukiarnrnai yar, D., and Haring, G. (1987). Generative net workload models for a single server environment. In Proceedings Sigmetrics Conference on Measurement and Modeling of Computer Systems, pages 118-127, Nashville, Tennesee. ACM.
[Ritchie and Thompson, 1974] Ritchie, D. M. and Thompson, K. (1974). The UNIX time-sharing sys tem. Communications of the ACM, 17(7):365-375.
[Schweitzer et al., 1993] Schweitzer, P., Serazzi, G., and Broglia, M. (1993). A survey of bottleneck anal ysis in closed networks of queues. In Proceedings Performance Evaluation of Computer and Commu nication Systems, pages 491-508, Berlin, Germany. ACM.
[Yu et al., 1985] Yu, P., Dias, D., Robinson, J., Iyer, B., and Cornell, B. (1985). Modelling of central ized concurrency control in a multi-system envi ronment. In Proceedings Sigmetrics Conference on Measurement and Modeling of Computer Systems, pages 183-191, Austin, Texas. ACM.