Contents
1301.6745
二
How to Elicit Many Probabilities
L.C. van der Gaag, S. Renooij,
C.L.M. Witteman,
Department of Computer Science Utrecht University P.O. Box 80.089 3508 TB Utrecht The Netherlands { linda, silja } @cs. uu.nl
Psychological Laboratory Utrecht University P.O. Box 80.140 3508 TC Utrecht The Netherlands C. Witteman@fss. uu.nl
Abstract
In building Bayesian belief networks, the elic itation of all probabilities required can be a major obstacle. We learned the extent of this often-cited observation in the construc tion of the probabilistic part of a complex influence diagram in the field of cancer treat ment. Based upon our negative experiences with existing methods, we designed a new method for probability elicitation from do main experts. The method combines various ideas, among which are the ideas of transcrib ing probabilities and of using a scale with both numerical and verbal anchors for mark ing assessments. In the construction of the probabilistic part of our influence diagram, the method proved to allow for the elicita tion of many probabilities in little time.
B.M.P. Aleman, and B.G. Taal The Netherlands Cancer Institute Antoni van Leeuwenhoekhuis Plesmanlaan 121 1066 CX Amsterdam The Netherlands number of variables. Based upon this protocol, 80% of the patients show a favourable response to the ther apy instilled. In the context of a project aimed at the development of a more fine-grained protocol with a higher favourable response rate, an influence diagram is being developed for patient-specific therapy selec tion for oesophageal carcinoma. The influence diagram is destined for use in the Antoni van Leeuwenhoekhuis.
1 INTRODUCTION
As more and more Bayesian belief networks are be ing developed for complex problem domains, it is be coming increasingly apparent that the elicitation of all probabilities required is not an easy task. In fact, the elicitation of probabilities is often referred to as a major obstacle in building a Bayesian belief network [ Jensen, 1995, Druzdzel & Van der Gaag, 1995]. We experienced the extent to which probability elicitation can be an obstacle to advancement in the construc tion of the probabilistic part of a complex influence diagram in the field of cancer treatment.
The Antoni van Leeuwenhoekhuis in the Netherlands, hosting the Netherlands Cancer Institute, is spe cialised in the treatment of cancer patients. In the hos pital, every year some hundred patients receive treat ment for oesophageal carcinoma. Patients with oe sophageal carcinoma currently are assigned to a ther apy by means of a standard protocol, involving a small
The oesophagus influence diagram is being hand crafted with the help of two experts in oncology from the Netherlands Cancer Institute. After carefully modeling the characteristics of an oesophageal carci noma and the possible effects of the various different therapeutic alternatives available in the graphical part of the diagram, we focused on the elicitation of the probabilities required for the diagram's quantitative part. As in many problem domains, various differ ent sources of probabilistic information appeared to be readily available for the elicitation task. Neither data collection nor a thorough literature review, how ever, yielded any usable results. The single remaining source of probabilistic information, therefore, was the knowledge and personal clinical experience of the two domain experts involved in the project.
For eliciting the conditional probabilities required for the oesophagus influence diagram, we set out us ing various well-known methods with our domain experts: we used a numerical scale for marking assessments and we used the concept of lotteries [Morgan & Henrion, 1990]. The various problems we encountered with these methods and the amount of time these methods tended to take for the separate assessments, soon revealed that the elicitation of the large number of probabilities required was infeasible with these methods.
Based upon our negative experiences with existing methods, we designed a new method for eliciting probabilities from domain experts. We tailored our method to eliciting a large number of probabilities in little time. As assessments obtained in little
time can be quite inaccurate, we envisage the use of our method as the first step in an iterative proce dure of stepwise refinement of probability assessments [Coupe et al., 1999]. Our method combines various different ideas. Among these are the ideas of present ing conditional probabilities as fragments of text and of providing a scale for marking assessments with both numerical and verbal anchors. Using our method in the construction of the probabilistic part of the oe sophagus influence diagram, we elicited from our do main experts the conditional probabilities required at a rate of 150- 200 probabilities per hour. In an eval uation interview, the experts indicated that they had felt very comfortable with the method.
The paper is organised as follows. In Section 2, we provide some details of the oesophagus influence di agram and .discuss our initial experiences with prob ability elicitation for the diagram. In Section 3, we describe the method we designed for eliciting a large number of probabilities from domain experts. In Sec tion 4, we evaluate the use of our method in the con struction of the probabilistic part of the oesophagus influence diagram; more specifically, we comment on the observations put forward by the domain experts using the method. The paper is rounded off with some conclusions in Section 5.
2 THE OESOPHAGUS INFLUENCE DIAGRAM
As a consequence of a lesion of the oesophageal wall, for example as a result of frequent reflux, a carci noma may develop in a patient's oesophagus. An oe sophageal carcinoma has various characteristics that influence its prospective growth. These characteristics include the location of the carcinoma in the oesopha gus, the histological type of the carcinoma, its length, and its macroscopic shape. An oesophageal carcinoma typically invades the oesophageal wall and upon fur ther growth may invade neighbouring structures such as the trachea and bronchi. In due time, the carcinoma may give rise to lymphatic metastases in distant lymph nodes and to haematogenous metastases in, for exam ple, the lungs and the liver of the patient. The depth of invasion and the extent of the metastases of the carcinoma largely influence a patient's life expectancy.
While establishing the presence of an oesophageal car cinoma in a patient is relatively easy, the selection of an appropriate therapy is a far harder task. In the Antoni van Leeuwenhoekhuis, various different thera peutic alternatives are available, ranging from surgical removal of the oesophagus, to radiotherapy, and po sitioning a prosthesis in the oesophagus. The effects aimed at by instilling a therapy include removal or reduction of the patient's primary tumour and an im proved passage of food through the oesophagus. The various therapeutic alternatives available differ in the extent to which these effects can be attained. Instilla tion of a therapy further is expected to be accompa nied not just by beneficial effects but also by various complications; these complications can be very serious and may even lead to death. The effects and com plications to be expected from the various therapeu tic alternatives available for a patient depend on the characteristics of his or her carcinoma, on the depth of invasion of the carcinoma into the oesophageal wall and neighbouring structures, and on the extent of the carcinoma's metastases. It will be evident that the possible effects and complications require careful bal ancing before a therapy is decided upon.
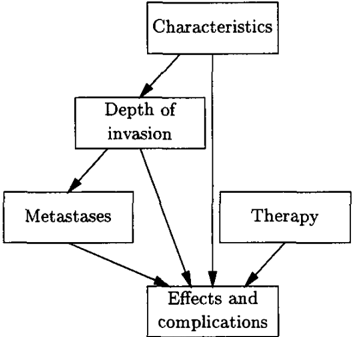
The overall structure of the oesophagus influence di agram is shown in Figure 1. The graphical part of the diagram was handcrafted with the help of two do main experts from the Netherlands Cancer Institute; the construction of this graphical part took approxi mately two years, with one two-hour interview every two or three weeks. The influence diagram currently
includes one decision node and over 70 chance nodes. Of these, 40 chance nodes pertain to the characteris tics of an oesophageal carcinoma, to the depth of its invasion, and to the extent of its metastases; the re maining chance nodes model the possible effects and complicatio n s of the various therapies available. For the chance nodes, a total of almost 3000 probabilities is required.
So far, we focused our elicitation efforts on the part of the diagram that pertains to the characteristics, depth of invasion, and metastases of an oesophageal carcinoma. This part constitutes a coherent and self supporting Bayesian belief network. The 40 nodes in-
valved require some thousand probability assessments. The node requiring the largest number of assessments, 144, models the staging of the carcinoma; this node is a deterministic node, classifying an oesophageal carci noma according to the depth of its invasion and the ex tent of its metastases. The non-deterministic node re quiring the largest number of probability assessments is the node describing the result of an echo-endoscopic examination of a patient's oesophagus with respect to the depth of invasion of the carcinoma in the oe sophageal wall; it requires 80 assessments.
The elicitation of the probabilities required for the 40 nodes indicated above proved to be a major obstacle in the construction of our influence diagram. As in many problem domains, various sources of probabilis tic information were available. We collected data from historical patient records and we performed a litera ture review. Unfortunately, the Netherlands being a low-incidence country for oesophageal carcinoma, we were not able to compose an up-to-date, large and rich enough data collection to allow for reliable assessment of the probabilities required; after due consideration, we decided instead to save the collected data for eval uation purposes. Our literature review, although very thorough, also did not result in ready-made assess ments; in fact, hardly any results reported in the lit Prature turned out to be usable for our influence dia gram. The single remaining source of probabilistic in formation, therefore, was the knowledge and personal clinical experience of the two domain experts involved in the project. The problems of bias and poor cali bration that, unfortunately, are typically encountered when eliciting judgemental probabilities from experts are widely known [Kahneman et al., 1982].
In our first efforts to elicit conditional probabilities for the oesophagus influence diagram from our domain ex perts, we focused on the use of a probability scale for marking assessments, on the frequency method, and on the concept of lotteries, as well-known methods for probability elicitation [Morgan & Henrion, 1990, Gigerenzer & Hoffrage, 1995]. These methods were dPsigned to avert to at least some extent the typ ical problems found with human probability assess ment. Before commenting on our experiences with these methods, we would like to emphasise that, prior to the construction of the oesophagus influence dia gram, the domain experts involved had little or no ac quaintance of expressing their knowledge and clinical experience into numbers.
The probability scale we used in the elicitation was a horizontal line with the three anchors 0, 0.5, and 1. The domain experts were asked to mark their assess ments for all conditional probabilities pertaining to a single variable given some conditioning context on the same line. The probabilities to be assessed were presented to them in mathematical notation. Unfor tunately, the experts involved in the project had some difficulties working with the mathematical notation. In addition, they felt quite uncomfortable with the probability scale, as it gave them very little to go by. The request to mark various assessments on a single line further appeared to introduce a bias towards aes thetically distributed marks.
With the frequency method, the domain experts were asked to envisage a population of one hundred patients suffering from an oesophageal carcinoma with certain characteristics. They were asked to assess the num ber of patients from among this population who would show a characteristic under study. Since oesophageal carcinoma has a low incidence in the Netherlands, vi sualising one hundred patients with certain specific characteristics turned out to be a demanding, if not impossible, task.
The use of lotteries for probability elicitation, unfor tunately, also entailed various difficulties. The domain experts indicated that they often felt confronted with lotteries that were very hard to conceive because of the rare, or unethical, situations they represented. More over, the use of lotteries tended to take so much time that it soon became apparent that the elicitation of several thousands of conditional probabilities in this way was quite infeasible.
3 THE ELICITATION METHOD
For the probabilistic part of the oesophagus influence diagram, several thousands of conditional probabili ties had to be assessed. As we argued in the previous section, these probabilities had to be elicited from the domain experts involved in the construction of the dia gram. Experience with well-known methods for prob ability elicitation had shown that assessing all prob abilities required was no easy task. Based upon the negative experiences with these methods, we designed a new method for eliciting probabilities from domain experts that is tailored to the elicitation of a large number of conditional probabilities in little time. In this section, we present our method; its use will be commented upon in Section 4.
Our method for probability elicitation from domain ex perts combines various different ideas. Although sev eral of these ideas were presented before by others, we combined and enhanced them to yield a novel and, as we will argue in the next section, effective elicitation method. At the heart of our method lies the idea of presenting domain experts with a separate figure for every conditional probability that needs to be assessed. Figure 2 shows, as an example, the figure pertaining
Consider a patient with a polypoid oesophageal carci noma; the carcinoma has a length of less than 5 em. How likely is it that this carcinoma invades into the muscu laris propria {T2} of the patient's oesophageal wall, but not beyond?
to the conditional probability
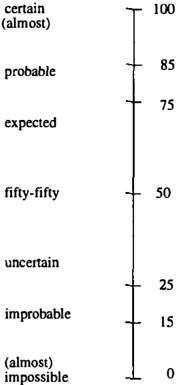
for the oesophagus influence diagram. On the left of the figure is a fragment of text that transcribes the conditional probability to be assessed. Using a frag ment of text to denote a probability circumvents the need to use mathematical notation. The fragment is stated in terms of likelihood rather than in terms of frequency to forestall difficulties with the assessment of a conditional probability for which the conditioning context is quite rare. To facilitate the assessment of a required probability, a vertical scale is depicted to the right of the text fragment. Indicated on this scale are various different numerical and verbal anchors. We will presently comment on the specific anchors used.
The figures pertaining to the various conditional prob abilities to be assessed are grouped in such a way that the probabilities from the same conditional distribu tion can be taken into consideration simultaneously; the figures are presented in groups of two or three on consecutive single-sided sheets of paper. Explic itly grouping related probabilities has the advantage of reducing the number of times a mental switch of conditioning context is required of the domain experts during the elicitation.
The probability scale to be used with our method spec ifies both numerical and verbal anchors. Research on human probability judgement has indicated that most people tend to feel more at ease with verbal probabil ity expressions than with numbers. Verbal expressions of probability are considered to be more natural than numerical probabilities, easier to understand and com- municate, and better suited to convey the vagueness of one's opinions [Wallsten et al., 1993]; this observa tion also holds for physicians and other health workers [Merz et al., 1991]. Words, however, should not self evidently be preferred to numbers, as neither should numbers to words. In fact, the two modes of commu nicating probabilistic information can both be used [Brun & Teigen, 1988]. Motivated by these observa tions, we decided to search for a probability scale for marking assessments that is based on both numbers and verbal probability expressions.
To develop a scale of verbal probability expressions to be used with numbers, we undertook four separate studies. In the first study, we asked subjects to pro vide a list of the verbal probability expressions they commonly use. This study yielded seven most fre quently used expressions, being (translated from the corresponding Dutch expressions) "certain" , "proba ble", "expected" , "fifty-fifty" , "uncertain" , "improba ble", and "impossible" . In the second study, (other) subjects were asked to rank order these expressions. The results from this study indicated that the seven verbal probability expressions had a considerably sta ble rank ordering between subjects. To establish the relative distances among the seven expressions, in the third study, subjects were asked to compare each pair of expressions and assess the degree to which the two expressions conveyed the same probability. The dis tances yielded by this study were used to project the verbal probability expressions onto a numerical scale. The expression "certain" was calculated to be equiva lent to 100%, "probable" to be equivalent to approx imately 85%, and "expected" approximately to 75%; "fifty-fifty" was calculated to be equal to 50%, "uncer-
二
tain" approximately to 25%, "improbable" to approx imately 15%, and "impossible", to conclude, was cal culated to denote 0%. Using this projection of verbal probability expressions onto numbers, the fourth study focused on the question whether decisions were influ enced by the mode in which probability information was presented. The results indicated that the decisions made were independent of whether the probability in formation was expressed numerically or verbally. We would like to note that the four studies included sub jects from the field of medicine. For further details of the studies, we refer the reader to an extended paper [Renooij & Witteman, 1999].
The fact that the subjects in our studies interpreted the verbal probability expressions as intended, moti vated us to further elaborate on a scale with both nu merical and verbal anchors for use as an aid for prob ability elicitation. Since the verbal probability expres sions were explicitly intended as independent anchors on the scale rather than as translations for the nu merical probabilities, we decided to position the verbal probability expressions close by rather than simply be side the numerical anchors. We further decided to add the moderator "(almost)" to the most extreme ver bal expressions to indicate the positions of very small and very large probabilities. The resulting probability scale is the scale shown in Figure 2.
4 EVALUATION OF THE ELICITATION METHOD
We used our newly designed method for probability elicitation from domain experts in the construction of the probabilistic part of the oesophagus influence di agram. In this section, we evaluate the use of our method. More specifically, we comment upon the ob servations put forward by the domain experts involved. In addition, we briefly review the preliminary results from an initial evaluation of the influence diagram in the making.
4.1 USING THE METHOD
The elicitation of the conditional probabilities required for the part of the oesophagus influence diagram out lined in Section 2, took approximately two months, with one two-hour interview with the domain experts every two weeks. Each interview focused on a small coherent part of the diagram. Prior to every inter view, the elicitors spent some ten hours preparing the fragments of text to be presented with our probability scale to the experts.
In the first interview, the domain experts were in formed of the basic ideas underlying the new elicitation method. The intended use of the probability scale was detailed to them. In addition, the experts were told that their initial probability assessments would be sub jected to a sensitivity analysis to reveal the sensitivi ties of the diagram's results to the various assessments, and that we would try and refine the most influential ones later on in the project; for details of our proce dure for stepwise refinement of assessments, we refer the reader once again to [Coupe et al., 1999]. The ba sic idea of sensitivity analysis was explained to the domain experts in depth to reassure them that rough assessments for the requested conditional probabilities would suffice at this stage in the construction of the influence diagram.
Following the last interview, the domain experts were asked to evaluate the new method we had used with them for probability elicitation. For this purpose, a written evaluation form was designed so as to not influ ence their observations. In the evaluation, the domain experts indicated that they had felt very comfortable with the elicitation method. They found the method most effective and much easier to use than any method for probability elicitation they had used before.
We recall from Section 3 that one of the ideas under lying our method for probability elicitation is the use of a fragment of text to indicate a conditional prob ability that needs to be assessed. The use of these fragments of text seemed to work very well. The two domain experts mentioned that they had had no dif ficulties understanding the described patient charac teristics. During the interviews, the elicitors had of ten noted that the described characteristics served to call to mind various different concrete patients. Al though the experts could not envisage a large group of patients with certain specific characteristics, their ex tensive clinical experience with cancer patients in gen eral and their knowledge of reactive growth of cancer cells, along with information recalled from literature, enabled them to provide the requested assessments.
With respect to the probability scale used for marking assessments, the domain experts indicated that they had found the presence of both numerical and verbal anchors helpful. They mentioned that, upon thinking about a conditional probability to be assessed, they used words as well as numbers. Depending on how fa miliar they felt with the characteristics described in a fragment of text, they preferred using verbal or numer ical expressions. The more uncertain they were about the probability to be assessed, for example, the more they were inclined to think in terms of words. The verbal anchors on the scale then helped them to deter mine the position that they felt expressed the proba bility they had in mind.
The two domain experts further mentioned that they had felt comfortable with the specific verbal anchors used with the probability scale. They indicated, how ever, that the expression "impossible" is hardly ever used in oncology. Especially in their communication with patients, oncologists appear to prefer the more cautious expression "improbable" to refer to almost impossible events. As a consequence, our domain ex perts tended to interpret the expression "improbable" as a 5% or even smaller probability rather than as a probability of around 15%. Since the probability scale provided both words and numbers, they had no dif ficulties indicating what they meant to express. The experts also mentioned that an extra anchor around 40% would have been useful. Note that these ob servations pertain to the lower half of the scale only. We would like to add to these observations that our probability scale hardly accommodates for indicating extreme probability assessments, that is, assessments very close to 0 or 1. During the various interviews, however, the domain experts never seemed to want to express such extreme assessments. When asked about extreme probabilities, they confirmed our observation.
Another idea underlying our method is the idea of grouping the figures used in such a way that the prob abilities from the same conditional distribution can be taken into consideration simultaneously. During the elicitation interviews, the domain experts were ad vised first to focus on the probabilities from a condi tional distribution that were the easiest to assess, and then to distribute the remaining probability mass over the more difficult probabilities. This turned out to be a most effective heuristic for eliciting assessments for variables with more than two or three values.
To conclude, we would like to point out that, during the earlier, rather unsuccessful, elicitation efforts, our domain experts had acquired some acquaintance of ex pressing their knowledge and personal clinical experi ence into numbers. As a result, they now appeared to be less daunted by the assessment task.
4.2 THE USE OF TRENDS
During the elicitation interviews with our domain ex perts, the concept of trend emerged. We use the term to denote a fixed relation between two conditional probability distributions for the same variable given different conditioning contexts.
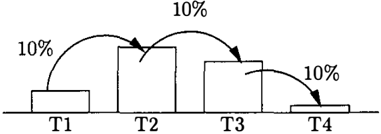
To illustrate the concept of trend, we address the vari able Invasion modelling the depth of invasion of an oesophageal carcinoma into the wall of a patient's oe sophagus. This variable can take one of the values Tl, T2, T3, and T4; the higher the number indicated in the value, the deeper the carcinoma has invaded into the oesophageal wall and the worse off the pa tient is. For the variable Invasion, various conditional probabilities had to be assessed, pertaining to differ ing shapes and varying lengths of a carcinoma. Upon assessing the conditional probabilities required for the variable Invasion, the domain experts started with the probabilities for the depth of invasion of a polypoid oe sophageal carcinoma with a length of less than 5 cen timeters. They subsequently indicated that patients with ulcerating tumours of this length were 10% worse off with regard to the depth of invasion of the carci noma than patients with equivalent polypoid tumours. They thus explicitly related two conditional probabil ity distributions for the variable Invasion to one an other. As trends appeared to be a quite natural way of expressing probabilistic information, we encouraged our domain experts to provide trends wherever appro priate.
We designed a generic method for handling the trends provided by our domain experts in an intuitively ap pealing and mathematically correct way. The method is best explained in terms of the example trend stated above. Suppose that, given a polypoid oesophageal carcinoma of less than 5 centimeters, the probabilities for the four different values of the variable Invasion have been assessed at x1, x2, x3, and x4 - x; be ing the probability assessment for the value Ti. After consultation with our domain experts, we interpreted the specified trend as follows: 10% of the patients with a polypoid tumour of less than 5 centimeters with Ti for its depth of invasion would have had Ti + 1 for the depth of invasion if the tumour would have been an ulcerating tumour, i = 1, 2, 3. The basic idea of the interpretation of the trend is depicted in Figure 3. For the probability assessments Yt, Y2, Y3, and Y4 for
the different values of the variable Invasion given an ulcerating oesophageal carcinoma of less than 5 cen timeters, we thus find
+--X! -0.10
Yt ·X! Y2 +--X2 -0.10 · X2 + 0.10 ·X! Y3 +--X3 -0.10 · X3 + 0.10 · X2 Y4 +--X4 + 0.10 · X3
It is readily verified that the resulting assessments Yt, Y2, Y3, and Y4 each lie between 0 and 1, and together
add up to 1. In addition, it will be evident that this method for handling trends can easily be generalised to variables with another number of values and to trends specifying other percentages and other directions of change.
4.3 AN INITIAL EVALUATION OF THE DIAGRAM
With our new method, we elicited from the domain experts involved all conditional probabilities required for the part of the oesophagus influence diagram that pertains to the characteristics, depth of invasion, and metastases of an oesophageal carcinoma. As men tioned before in Section 2, this part of the diagram constitutes a coherent and self-supporting Bayesian belief network; it provides for predicting the stage of a patient's oesophageal carcinoma from the results of various different diagnostic tests. To get some prelim inary insight in the quality of the influence diagram in the making, we performed an initial evaluation of the 40-node belief network with patient data from 184 patients, available from the Netherlands Cancer Insti tute. Before detailing this evaluation and its results, we would like to note that the data collection used is known to be biased, to contain inconsistencies, and to be incomplete in a non-random way.
For each patient from our data collection, we instan tiated, in the belief network, all nodes pertaining to diagnostic tests for which a test result was available for the patient under consideration. These diagnos tic tests range from a biopsy of the primary tumour to an echo-endoscopic examination of the oesophagus, and an X-ray of the patient's chest. From the thus partially instantiated belief network, we computed the most likely stage of the patient's oesophageal carci noma and compared it with the stage recorded in the data. The stage of an oesophageal carcinoma can be either I, IIA, liB, III, IVA, or IVB.
For 29 patients from our data collection, unfortu nately, the stage of the oesophageal carcinoma was not recorded, which left us with 155 patients for our eval uation. In 94 of these 155 patients, the stage of the carcinoma recorded in the data matched the stage with highest probability computed from the belief network. Under the assumption that the stages recorded in the data are correct, therefore, in 61% of the patients the network predicted the correct stage. We would like to note that this percentage is not uncommon in evalua tions of knowledge-based systems [Berner et al., 1994].
Careful examination of the data of the patients for which the belief network returned an incorrect stage learned that the network's prediction deviated from the data most notably for patients with an oesophageal carcinoma of stage IVB. For some 70% of the patients with a IVB-staged carcinoma, another stage was pre dicted by the network; the stage IVB was quite often yielded as the second most likely stage, however. Af ter removing all patients with a IVB-staged carcinoma from our data collection, the network predicted the correct stage for 68% of the remaining patients.
To conclude our initial evaluation, we re-addressed the data of patients for whose oesophageal carcinoma the belief network predicted a stage that differed from the stage recorded in the data; in doing so, we once again included the patients with a IVB-staged carcinoma. Since most probability assessments for the network had been rounded off at 5%, we investigated the effect, on the percentage of correct predictions, of consider ing certain stages as (almost) correct. To this end, we considered an oesophageal carcinoma as (almost) cor rectly staged by the network, if for the stage recorded in the data a probability was computed from the net work that differed by at most 5% from the probability of the most likely stage. The percentage of correct pre dictions then approached 70%. Given that the proba bilities used are rough, initial assessments and that the patient data definitely require clearing out, the results from the initial evaluation are quite encouraging.
5 CONCLUSIONS
We experienced the extent to which probability elici tation can be an obstacle to advancement in the con struction of the probabilistic part of the oesophagus influence diagram. Motivated by our negative ex periences with existing methods, we designed a new method for eliciting probabilities from domain experts. Our method combines various different ideas, among which are the ideas of transcribing probabilities and of using a scale with both numerical and verbal anchors. We used our new elicitation method for eliciting the probabilities required for the oesophagus influence di agram and evaluated its use with the domain experts involved. The experts indicated that they found the method much easier to use than any method for prob ability elicitation they had used before.
For the construction of the oesophagus influence dia gram, our newly designed elicitation method entailed a major breakthrough. Prior to the use of our method, we had spent over a year experimenting, on and off, with other methods for probability elicitation without success. Using our elicitation method, the probabili ties for a major part of the oesophagus influence di agram were elicited in just two months' time. Our method tends to take considerable time on the part of the elicitors in preparing the various interviews with the experts. However, the ease with which probabili-
ties are elicited with the method makes this time cer tainly well spent.
References
- [Berner et al., 1994] E.S. Berner, G.D. Webster, A.A. Shugerman, J.R. Jackson, J. Algina, A.L. Baker, E.V. Ball, C.G. Cobbs, V.W. Dennis, E.P. Frenkel, L.D. Hudson, E.L. Mancall, C.E. Rack ley, and O.D. Taunton (1994). Performance of four computer-based diagnostic systems. The New Eng land Journal of Medicine, vol. 330, pp. 1792- 1796.
- [Brun & Teigen, 1988] W. Brun and K.H. Teigen (1988). Verbal probabilities: ambiguous, context dependent, or both ? Organizational Behavior and Human Decision Processes, vol. 41, pp. 390- 404.
- [Coupe et al., 1999] V.M.H. Coupe, L.C. van der Gaag, and J.D.F. Habbema (1999). Sensitivity analysis: an aid for belief-network quantification, submitted for publication.
- [Druzdzel & Van der Gaag, 1995] M.J. Druzdzel and L.C. van der Gaag (1995). Elicitation of proba bilities for belief networks: combining qualitative and quantitative information. Proceedings of the Eleventh Conference on Uncertainty in Artificial Intelligence, pp. 141 - 148.
- [Gigerenzer & Hoffrage, 1995] G. Gigerenzer and U. Hoffrage (1995). How to improve Bayesian reason� ing without instruction: frequency formats. Psy chological Review, vol. 102, pp. 684- 704.
- [Jensen, 1995] A.L. Jensen (1995). Quantification ex perience of a DSS for mildew management in win ter wheat. In: M.J. Druzdzel, L.C. van der Gaag, M. Henrion, and F.V. Jensen. Working Notes of the Workshop on Building Probabilistic Networks: Where Do the Numbers Come From ?, pp. 23 -31.
- [Kahneman et al., 1982] D. Kahneman, P. Slovic, A. Tversky (1982). Judgment under Uncertainty: Heuristics and Biases. Cambridge University Press.
- [Merz et al., 1991] J.F. Merz, M.J. Druzdzel, and D.J. Mazur (1991). Verbal expressions of probability in informed consent litigation. Medical Decision Mak ing, vol. 11, pp. 273 - 281.
- [Morgan & Henrion, 1990] M.G. Morgan, M. Henrion (1990). Uncertainty, a Guide to Dealing with Un certainty in Quantitative Risk and Policy Analysis. Cambridge University Press, Cambridge.
- [Renooij & Witteman, 1999] S. Renooij, C.L.M. Wit teman (1999). Talking probabilities: communicat ing probabilistic information with words and num bers, submitted for publication.
- (Wallsten et al., 1993) T.S. Wallsten, D.V. Budescu, R. Zwick (1993). Comparing the calibration and coherence of numerical and verbal probability judg ments. Management Science, vol. 39 (2), pp. 176190.