Contents
1204.3844
On how percolation threshold affects PSO performance
Blanca Cases, Alicia D'Anjou, Abdelmalik Moujahid
Computational Intelligence Group of the University of the Basque Country.
P. Manuel de Lardiz´ abal n. 1, 20018 San Sebasti´ an, Spain
Abstract. Statistical evidence of the influence of neighborhood topology on the performance of particle swarm optimization (PSO) algorithms has been shown in many works. However, little has been done about the implications could have the percolation threshold in determining the topology of this neighborhood. This work addresses this problem for individuals that, like robots, are able to sense in a limited neighborhood around them. Based on the concept of percolation threshold, and more precisely, the disk percolation model in 2D, we show that better results are obtained for low values of radius, when individuals occasionally ask others their best visited positions, with the consequent decrease of computational complexity. On the other hand, since percolation threshold is a universal measure, it could have a great interest to compare the performance of different hybrid PSO algorithms.
Keywords: Particle Swarm Optimization parameters, Percolation theory, Hybrid PSO.
1 Introduction
Percolation theory appears in very different random structures, including spread of diseases, fire propagation in forests, phase transition in solids, diffusion in disordered media, etc. There are number of good reviews of the percolation theory [10,11]. This theory is particularly well adapted to describe global physical properties, such as the connectivity and conductivity behaviour of geometrically complex systems. This work analyzes the role of percolation threshold, a universal measure of connectivity in graphs, to analyze the convergence of swarms algorithms as a function of the expected number of neighbors at initial step. And therefore, to develop a framework to compare the performance of hybrid PSO algorithms. The analysis of the performance of different hybrid PSO algorithms has been addressed in different works [4,7,3]. However, in this work, we focus on the concept of percolation threshold as a useful tool to define the parameter space for which the performance of the basic PSO algorithm is enhanced.
The basic model of PSO by Eberhart, Kennedy and Shi [8,6] is an stochastic optimization method for D -dimensional functions. Given a population of P individuals i, 1 ≤ i ≤ P , uniformly distributed on an D -dimensional hypercube of size S in points x i = ( x i 1 , . . . , x id , . . . , x iD ), each individual moves to next position according to a velocity vector v i = ( v i 1 , . . . , v id , . . . , v iD ) both calculated according to (1):
where values rand (1 . 0) and Rand (1 . 0) are drawn at random according to a uniform distribution in the interval [0 , 1]. Velocity v i ( t +1) is a randomized linear combination of three forces: ( i ) inertia, weighted by parameter w ∈ [0 , 1], ( ii ) the personal attraction c 1 to the position p i where the minimum value of a function f ( p i ) was found, and ( iii ) the social attraction to the position p g i of the best goal remembered by the neighbors of individual i in a given topology.
In many works, the neighborhood of each individual includes the whole population and the best goal p g = p g i is visible for all the agents in a blackboard architecture. In these cases, the gain in efficiency runs in parallel to the lose of autonomy of agents in the model. For realistic purposes, as in swarm robotics, the notion of Euclidean neighborhood is a building block since sensors and effectors have physical limits. Some authors [12,14] have carried out social network statistical studies to address the effects of neighborhood topology in PSO algorithms, concluding that the topology used conditions strongly the convergence of these algorithms.
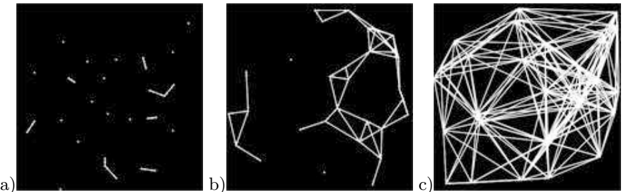
In this work, based on the so called continuum or disk percolation model [1], we investigate the effect of the percolation threshold according to the topology of geometric graphs. A geometric graph is a 2D representation of a graph: given a neighborhood radius R and a square board of size S, let { x 1 , . . . , x P } be the initial positions of individuals composing the swarm selected at random following a uniform distribution. The geometric graph is built connecting each node to all neighboring nodes in radius R. Percolation disk theory allows the calculus of the radius R , that ensures a mean of a neighbors per node (called the area or degree) with parameters of population of P individuals and world size S , according to (2).
We study experimentally the convergence of PSO algorithms focusing on the concept of percolation. The percolation concept comes from chemistry and refers to the way a liquid flows through a porous medium, like a large piece of pumice stone and sets what is the probability that the center of the stone is wet when we immerse it in water. Other example is making coffee: if ground coffee is fine grained, under a determined threshold for the diameter of grain, water stagnates, while over this threshold water falls through coffee. In terms of random graphs, percolation is identified to the phenomenon of passing from numerous small connected components to a connected one as a function of the number of expected neighbors a . The critical value of a receives the name of percolation threshold a c .
Percolation is a complex phenomenon which suggests that agents in a swarm only need a minimum of social information to perform the optimization task, being redundancy a source of futile complexity. It has been proved [1] with confidence 99.99% the following bound for the critical percolation threshold a c and the corresponding critical value R c , obtained as the average degree over the squares of any size S :
We will show experimentally that neighborhoods of critical radius R c are enough to reach goals in a minimum number of steps. The following definitions and parameters were set in order to compare results with those of [2,5,13].
- -Neighbors are determined by the euclidean distance d : let x i be the position of individual i , N R ( x i ) = { x i 1 , . . . , x i n i } is the set of neighboring individuals in radius R , that is d x i , x i j ≤ R, 1 ≤ j ≤ n i .
- -Experimental parameters are exactly those given in [5]: a swarm of P = 30 individuals and square side S = 200 and center (0,0). Velocity module | v | = √ v 2 1 + v 2 2 is limited by x max = v max = 100, meaning that individuals move a step forward in the direction of vector v with step length s ( v ) = v max if | v | > v max and s ( v ) = | v | otherwise. Clerc's [2] optimal parameters c 1 = c 2 = 1 . 49445 and constant constriction factor w = 0 . 729 where used.
- ( ) -The neighbors best value of function f known by agent i in its neighborhood is defined as: p g i = min f { p i j : x i j ∈ N R ( x i ) } , that is, the position p i j remembered by neighbors (at current position x i j ) minimizing goal function f . The social best of x i is defined as the mean neighbors best value at final step, ∑ p g i P .
- -Benchmark functions are those used in [5,13]. The model has been implemented in Netlogo 4.1, running in concurrent mode (individuals are updated once the run step ends) with a float precision of 16 decimals. An experiment consists in 100 runs for each function, 20 for each instance of parameter R.
- -We compare results for Clerc's parameters set [2,5] w = 0 . 729 , c 1 = c 2 = 1 . 49445 and Trelea's parameters w = 0 . 6 , c 1 = c 2 = 0 . 7. Since disk percolation threshold is a 2D measure, the dimension will be D = 2 for the scope of this work. The domain of the benchmark functions will be x max = 100 = v max , as well as the goal, 0.01 for all functions. In this way results concerning percolation threshold can be easily compared.
2 Analysis of goals as a function of the expected degree at initial step.
Applying equation (2), we explore the success of PSO algorithm as a function of radius R ( a ) according to a longitudinal study of the mean degree expected at initial step.
- -Dataset A: 0 . 000 ≤ a ≤ 0 . 9, meaning that only a fraction of the individuals has neighbors: from 0.0 to 0.9 with step 0.1. Table 1 shows the corresponding neighborhood radius R ( a ). Each function is run 20 times, so for each R ( a ) 100 runs were completed.
- -Dataset B: 1 ≤ a ≤ 30, from the minimum (1 neighbor) to the maximum (29 neighbors) plus one, 30 neighbors with step 1. Neighborhood radius R varies in the interval 20 . 601 ≤ R ≤ 112 . 838.
- -Best global value registers at each run step the best position remembered by any agent, that is best -global -val ( t ) = min { f ( p i ( t )) : 1 ≤ i ≤ P } , updated every time that an individual finds a smaller value x i ( t +1) < best -global -val ( t ).
- -Mean best neighbors value is the average social information over all the individuals, best -neighbors -val i ( t ) = min { f ( p j ( t )) : } , updated every time that an individual finds a smaller value x i ( t +1) < best -global -val ( t ).
Varying the benchmark function and the radius of neighborhood as parameters, each pair 20 runs, with goal precision 0.01 and a maximum number of iterations P 2 = 900, results in table 2. Even including the case of neighborhood radius R = 0, the performance of the PSO algorithm does better for graphs with initial mean degree 0 ≤ a ≤ 0 . 9: with the only exception of f 1 the mean best global values are successful reaching the goal 0 . 01. As was expected, the objective function has to do in the performance of the algorithm: it is harder to optimize function f 1 , but never ceases to amaze that respecting to the social force, less neighbors means better performance of PSO. In a further section we will analyze accurately the performance of the algorithm for values a = 0 and 0 < a ≤ 0 . 9. The mean iterations (over a maximum of P 2 = 900) averaged over all runs is similar for datasets A and B.
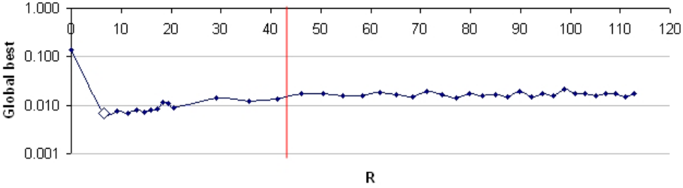
Figure 2 shows mean values of the best global as a function of neighborhood radius R ( a ) calculated according to (2). As it can be appreciated, the best result corresponds to a disk radius R ( a ) = 6 . 515 where the degree a = 0 . 100 is the first one being explored. This means that initial configurations, where 10% of individuals have a neighbor, give the best performance. Note that a < log (log ( P )) =
| Function | Goals | Best global | Steps | |||||
|---|---|---|---|---|---|---|---|---|
| A | B | A | B | A goal | B goal | A all | B all | |
| Spherical f 0 | 95.50% | 100.00% | 0.01 | 0.00 | 92 | 56 | 129 | 56 |
| Rosenbrock f 1 | 52.00% | 9.00% | 0.09 | 0.06 | 588 | 370 | 738 | 852 |
| Rastrigin f 2 | 95.00% | 100.00% | 0.01 | 0.00 | 82 | 58 | 123 | 58 |
| Griewank f 3 | 100.00% | 100.00% | 0.00 | 0.00 | 2 | 2 | 2 | 2 |
| Schaffer f 6 | 100.00% | 100.00% | 0.00 | 0.00 | 5 | 4 | 5 | 4 |
| Total | 88.50% | 81.80% | 0.02 | 0.02 | 108 | 38 | 199 | 195 |
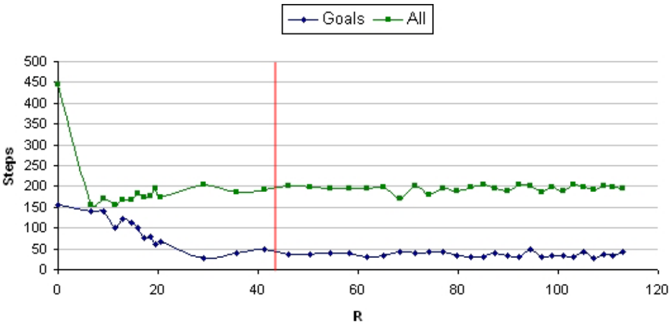
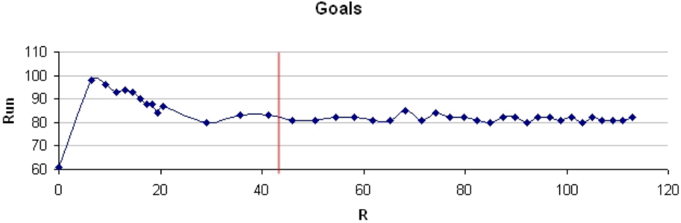
0 . 169 since P = 30 and hence each run has computational complexity at most of the order of P log (log ( P )). Over the critical radius R c the mean global best stops increasing to become constant. As one might expect, Fig. 2 shows that the
Mean global best. All runs.
only memory of the best personal value gives comparatively a poor score. Even so, this score is over the 60%. The importance of social information is crucial: surprisingly the smallest number of initial neighbors gives the majority of the goals. Near of the percolation threshold R c /similarequal 43 , 758 the score starts remaining constant. Finally, the mean iterations needed for success, with a limit of P 2 = 900, reach the minimum at R = 6 . 515. From this value, the mean over all the runs slightly increases becoming constant, near to 195 steps, for values upper
to R c /similarequal 43 . 758. On the other hand, the average over successful runs decreases until the threshold R c is passed reaching a constant value near in mean to 36 steps.
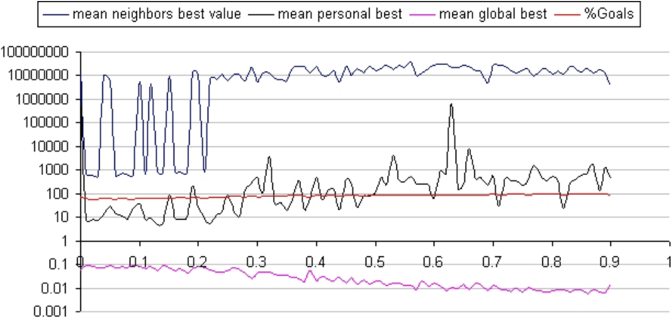
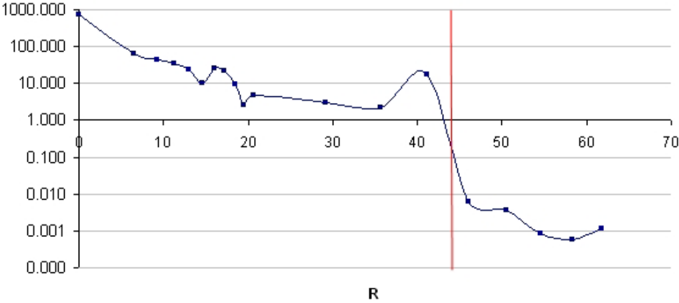
The mean value of social best, that is the average value of the best personal value of neighbors, was measured at final step. The mean over all runs is presented in Fig. 2. Beyond value R = 61 . 804 the mean reaches value 0 rounded to 3 decimals. This occurs because some individuals fly outside the limits of the board having 0 neighbors. This curve, as will be shown in next section, seems to be very sensible to the variations of R , decreasing drastically at critical radius R c .
Mean of best neighborspersonalvalue at final step
3 Exploring the disk percolation threshold
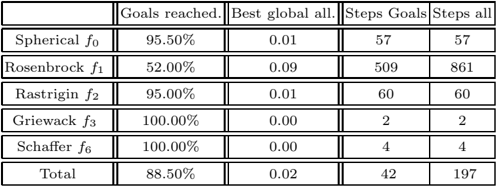
Values of R around critical radius R c were finely explored varying degree a along the interval [4 . 37 , 4 . 515] just before the critical threshold a c = 4 . 512 with step 0.001. Hence R ( a ) varies in the interval [43 . 066 , 43 . 775] in intervals of 0.01. Each instance of parameter R was run 100 times, 20 for each function f i . Table 3 shows the means of goals, the best global value reached and final step. Comparing to table 2, the total of successful runs equals the goals of dataset A, 88.5%, as well as the mean best global value, 0.02. The difference with dataset A is in the number of steps: at critical radius R c the performance of PSO algorithm decreases to mean of 42 iterations in successful runs, near to the 38 steps reached in dataset B. Mean steps, 197, are just in the middle of the 199 obtained for dataset A and the 195 of dataset B. As a conclusion, the performance of PSO algorithm with a c between 4 and 5 neighbors is the same as with large values, even when the neighborhood comprises all agents.
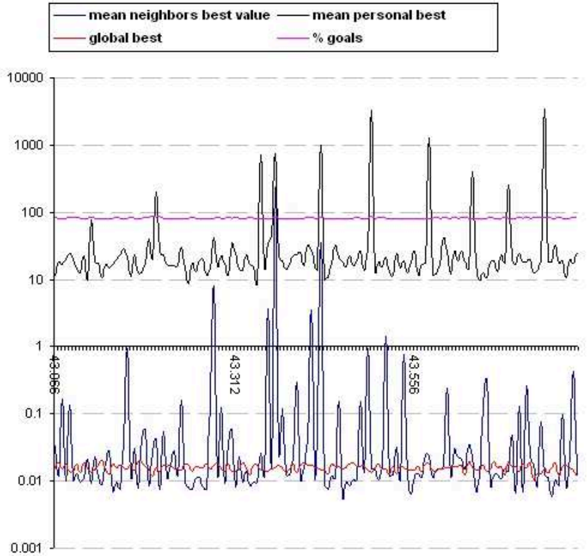
In closing, the curves of mean social and personal values are represented in Fig. 3 together with the global best value and the percentage of goals. Pearson correlations were calculated between all the series being the most significant the negative correlation between goals and global best, -0.385. We conjecture that the lack of correlation between variables is a characteristic of the interval around the critical radius.
4 Exploring R in the the interval [0 , 0 . 9]
As it has been reported in Fig. 2 the minimum value of global best occurs at a = 0 . 1 , R ( a ) = 6 . 515. For the same radius, the Fig. 2 shows a maximum of successful runs. This suggest that PSO does better with less, but some, social
| Goals reached. | Best global all. | Steps Goals | Steps all | |
|---|---|---|---|---|
| Spherical f 0 | 95.50% | 0.01 | 57 | 57 |
| Rosenbrock f 1 | 52.00% | 0.09 | 509 | 861 |
| Rastrigin f 2 | 95.00% | 0.01 | 60 | 60 |
| Griewack f 3 | 100.00% | 0.00 | 2 | 2 |
| Schaffer f 6 | 100.00% | 0.00 | 4 | 4 |
| Total | 88.50% | 0.02 | 42 | 197 |
contact: degree a = 0 . 1 means that only one in ten individuals has one neighbor at initial step. The interval R ∈ [0 , 0 . 9] , or equivalently a ∈ [0 , 0 . 001909] was explored to investigate the pass of having no neighbors to have a minimum of social contact. A total of 91 instances of R with 20 runs per function were executed. Table 4 shows surprising results: the 94.13% of the runs were successful in the interval [0 . 75 , 0 . 9] with the only handicap of longer iterations, reaching a mean of 258 steps.
| function | Goals | Steps all | |||
|---|---|---|---|---|---|
| 0.0-0.25 | 0.26-0.50 | 0.51-0.75 | 0.75-0.90 | 0.75-0.90 | |
| Spherical f 0 | 60.58% | 91.20% | 99.60% | 100.00% | 262 |
| Rosenbrock f 1 | 2.88% | 19.80% | 50.60% | 70.67% | 750 |
| Rastrigin f 2 | 60.19% | 90.00% | 99.80% | 100.00% | 265 |
| Griewank f 3 | 100.00% | 100.00% | 100.00% | 100.00% | 3 |
| Schaffer f 6 | 100.00% | 100.00% | 100.00% | 100.00% | 9 |
| Total | 64.73% | 80.20% | 90.00% | 94.13% | 258 |
Figure 4 shows that high values of social information are related to increasing goals and decreasing global values. To corroborate this tendency, the Pearson coefficient of correlation was calculated in table 5. A very significant positive correlation exists between the percentage of goals with R and the mean social best: the major the dispersion of neighbors the major the goals. Conversely, the goals go in a very significant negative correlation with global best: the less the best global value the more the goals . The mean best global value decreases as radius R and social best increase.
| Correlation | R | Social best | Personal best | Global best | Goals | Steps |
|---|---|---|---|---|---|---|
| R | 1 | - | - | - | - | - |
| Social best | 0.591 | 1 | - | - | - | - |
| Personal best | -0.122 | 0.024 | 1 | - | - | - |
| Global best | -0.908 | -0.712 | 0.049 | 1 | - | - |
| Goals | 0.956 | 0.720 | -0.058 | -0.947 | 1 | - |
| Steps | -0.96 | -0.668 | 0.042 | 0.915 | -0.967 | 1 |
5 Comparing different domain through degree a .
Experiments in previous sections were made over the same domain conditions of f 0 and f 6 : x max = 100 , S = 200. Disk percolation theory gives us a way to relate
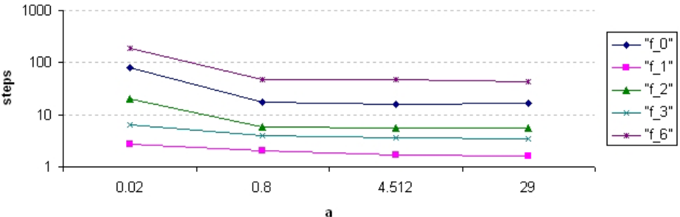
the expected number of neighbors a to neighborhood radius R of individuals in spite of different values of parameters of the world, population P and square side S , were supplied. In table 6 we report values of R for different degree values a 1 = 0 . 00151, a 2 = 0 . 8, a 3 = 29 and at a critical radius a c = 4 . 512, calculated according to (2). Table 6 shows that conditions x max = 100 = S 2 and P = 30 give for each a a corresponding radius R ( a ) in the intervals studied in previous sections: R (0 . 00151) = 0 . 8 ∈ [0 . 75 , 0 . 9] analyzed in section 4, R (0 . 8) = 18 . 426 in dataset A and R (29) = 110 . 941 in dataset B of section 2 and the critical radius R c = R ( a c ) in section 3. We wonder if a change of parameters values will report different patterns of PSO convergence.
| f | a c | S | P | R c | f a c | S | P | R c |
|---|---|---|---|---|---|---|---|---|
| f 0 | 0.00151 | 200 | 30 | 0.801 | f 0 0.800 | 200 | 30 | 18.426 |
| f 1 | 0.00151 | 60 | 30 | 0.240 | f 1 0.800 | 60 | 30 | 5.528 |
| f 2 | 0.00151 | 10.24 | 30 | 0.041 | f 2 0.800 | 10.24 | 30 | 0.943 |
| f 3 | 0.00151 | 1200 | 30 | 4.803 | f 3 0.800 | 1200 | 30 | 110.558 |
| f 6 | 0.00151 | 200 | 30 | 0.801 | f 6 0.800 | 200 | 30 | 18.426 |
| f 0 | 4.512 | 200 | 30 | 43.760 | f 0 29 | 200 | 30 | 110.941 |
| f 1 | 4.512 | 60 | 30 | 13.128 | f 1 29 | 60 | 30 | 33.282 |
| f 2 | 4.512 | 10.24 | 30 | 2.241 | f 2 29 | 10.24 | 30 | 5.680 |
| f 3 | 4.512 | 1200 | 30 | 262.561 | f 3 29 | 1200 | 30 | 665.648 |
| f 6 | 4.512 | 200 | 30 | 43.760 | f 6 29 | 200 | 30 | 110.941 |
For each value of parameter a the experiment was repeated 500 times, 100 for each function f i . All the runs converged with the goal precision given in [5,13]. Hence, the only variable to compare is the mean number of steps, given in Fig. 5. The same pattern of convergence appears: at small values of a < R ( a ) ∈ [0 . 75 , 0 . 9] all the experiments converge, but more steps are needed. From the percolation threshold, a universal measure, the number of steps slightly decreases.
6 Conclusions
We show in this work that percolation threshold is a tool to analyze the convergence of swarms as a function of the expected number of neighbors at initial step. While traditionally PSO algorithm is based on the external calculus of the global best goal by reasons of convergence, we present here experiments suggesting that, for one hand, very small amounts of information, translated to very low values of a are enough to provoke the convergence of PSO swarms. Moreover, better scores of convergence are found. On the other hand, a low degree a c = 4 . 512 is enough to both purposes: convergence to the minimum and short runs. The steps needed for convergence become constant from this critical value. Hence, more neighbors do the same than a c neighbors. Disk percolation threshold is a measure for 2D systems. Efforts will be made in investigating the calculus of percolation thresholds for higher dimension. An idea to do that is to compare the area of the circle of radius R to the surface of the square πR 2 /S 2 looking for the value of radius R ′ such that a D-dimensional hypersphere of this radius maintain the same proportion with respect to the volume of the hyperboard.
This work can be extended in a further development, comparing previous hybrid PSO approaches and using more benchmark functions. Moreover, we think it is of great interest to study the implications of percolation threshold in fuzzy neurocomputing areas [9], since percolation is considered as a second order state transition phenomenon, having hence a crisp nature.
References
- Bollobs, B., Riordan, O.: Percolation. Cambridge University Press, UK (2006)
- Clerc, M., Kennedy, J.: The particle swarm explosion, stability, and convergence in a multidimensional complex space. IEEE Transactions on Evolutionary Computation 6(1), 58-73 (2002)
- Corchado, E., Abraham, A., Ponce Leon Ferreira de Carvalho, A.C.: Hybrid intelligent algorithms and applications. Inf. Sci. 180(14), 2633-2634 (2010)
- Corchado, E., Gra˜ na, M., Wozniak, M.: Editorial: New trends and applications on hybrid artificial intelligence systems. Neurocomputing 75(1), 61-63 (2012)
- Eberhart, R.C., Shi, Y.: Comparing inertia weights and constriction factors in particle swarm optimization. In: Proceedings of the IEEE Conference on Evolutionary Computation, ICEC. vol. 1, pp. 84-88 (2000)
- Eberhart, R.C., Shi, Y.: Particle swarm optimization: Developments, applications and resources. In: Proceedings of the IEEE Conference on Evolutionary Computation, ICEC. vol. 1, pp. 81-86 (2001), http://www.scopus.com/inward/record.url?eid=2-s2.0-0034863568&partnerID=40&md5=6ffd3565ce1de09c39 cited By (since 1996) 890
- Garca, S., Fernndez, A., Luengo, J., Herrera, F.: Advanced nonparametric tests for multiple comparisons in the design of experiments in computational intelligence and data mining: Experimental analysis of power. Information Sciences 180(10), 2044-2064 (2010), http://linkinghub.elsevier.com/retrieve/pii/S0020025509005404
- Kennedy, J.: Particle swarm: Social adaptation of knowledge. In: Proceedings of the IEEE Conference on Evolutionary Computation, ICEC. pp. 303-308 (1997), http://www.scopus.com/inward/record.url?eid=2-s2.0-0030645460&partnerID=40&md5=470218cf1b1e57d900 cited By (since 1996) 436
- Pedrycz, W., Aliev, R.A.: Logic-oriented neural networks for fuzzy neurocomputing. Neurocomputing 73(1-3), 10-23 (2009)
- Sahimi, M.: Applications of Percolation Theory. Taylor and Francis, UK (1994)
- Stauffer, D., Aharony, A.: Introduction to Percolation Theory. Taylor and Francis, UK (1992)
- Toscano-Pulido, G., Reyes-Medina, A.J., Ram´ ırez-Torres, J.G.: A statistical study of the effects of neighborhood topologies in particle swarm optimization. Studies in Computational Intelligence 343, 179-192 (2011), http://www.scopus.com/inward/record.url?eid=2-s2.0-79954459982&partnerID=40&md5=f86b8162a6a53632f cited By (since 1996) 0
- Trelea, I.C.: The particle swarm optimization algorithm: Convergence analysis and parameter selection. Information Processing Letters 85(6), 317-325 (2003), http://www.scopus.com/inward/record.url?eid=2-s2.0-0037475094&partnerID=40&md5=9a90a1d64dd52d02eb cited By (since 1996) 552
- Zhang, L., Mu, H.P., Jiao, C.Y.: Particle swarm optimization with highly-clustered scale-free neighborhood model. In: Proceedings -2010 3rd IEEE International Conference on Computer Science and Information Technology, ICCSIT 2010. vol. 2, pp. 661-663 (2010), http://www.scopus.com/inward/record.url?eid=2-s2.0-77958576686&partnerID=40&md5=c1905cef787722044 cited By (since 1996) 0