Academic Profile
Statistics
Similar Authors
Papers on arXiv
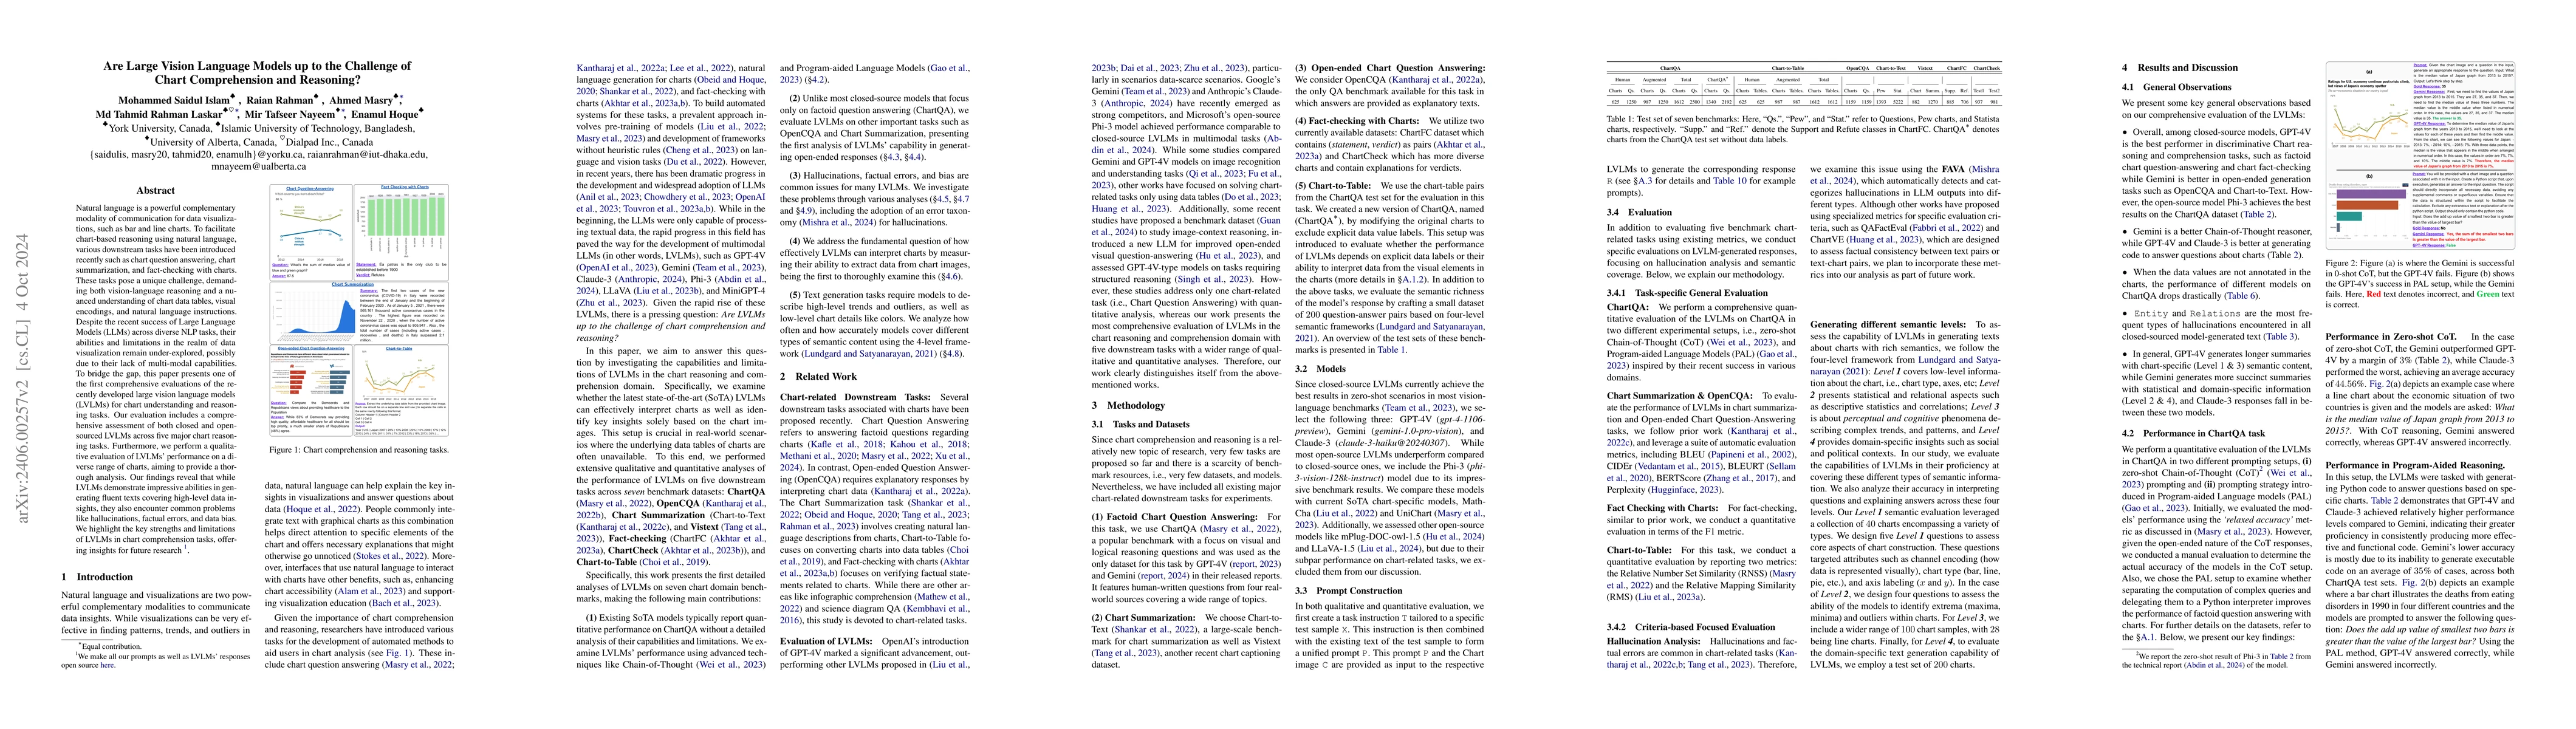
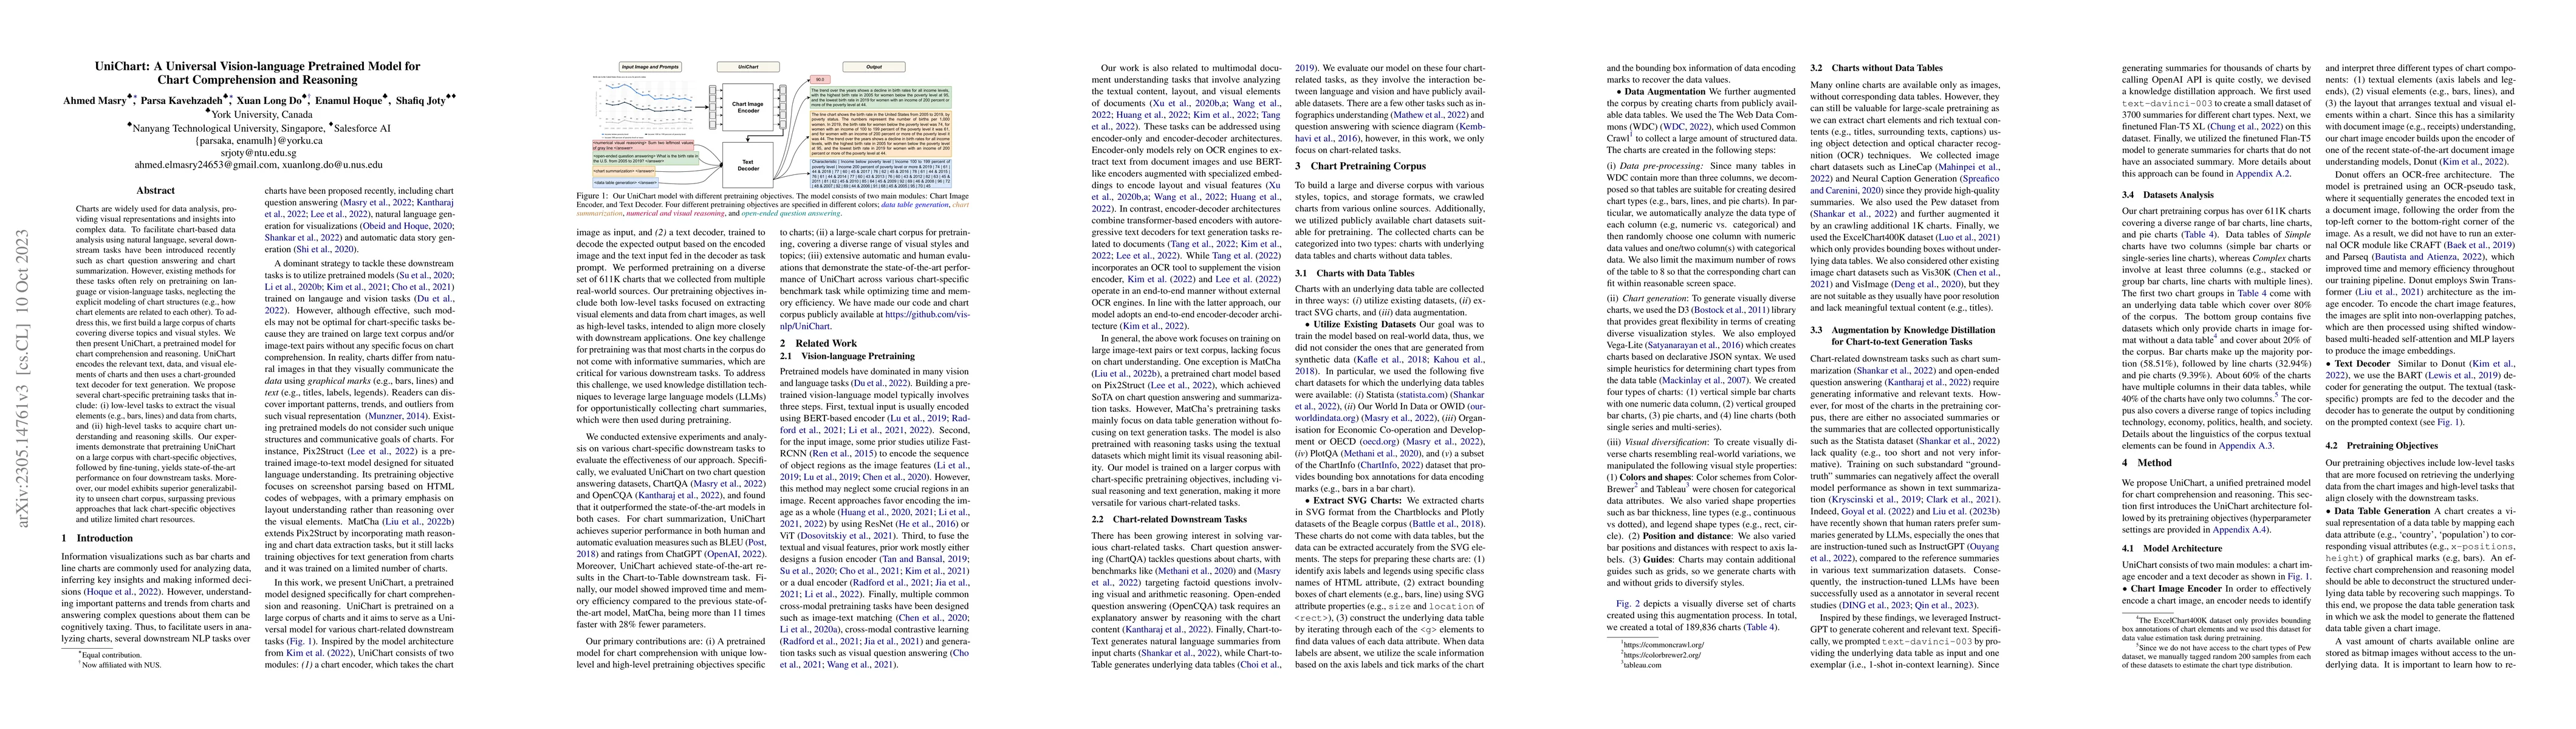
Natural language is a powerful complementary modality of communication for data visualizations, such as bar and line charts. To facilitate chart-based reasoning using natural language, various downs...
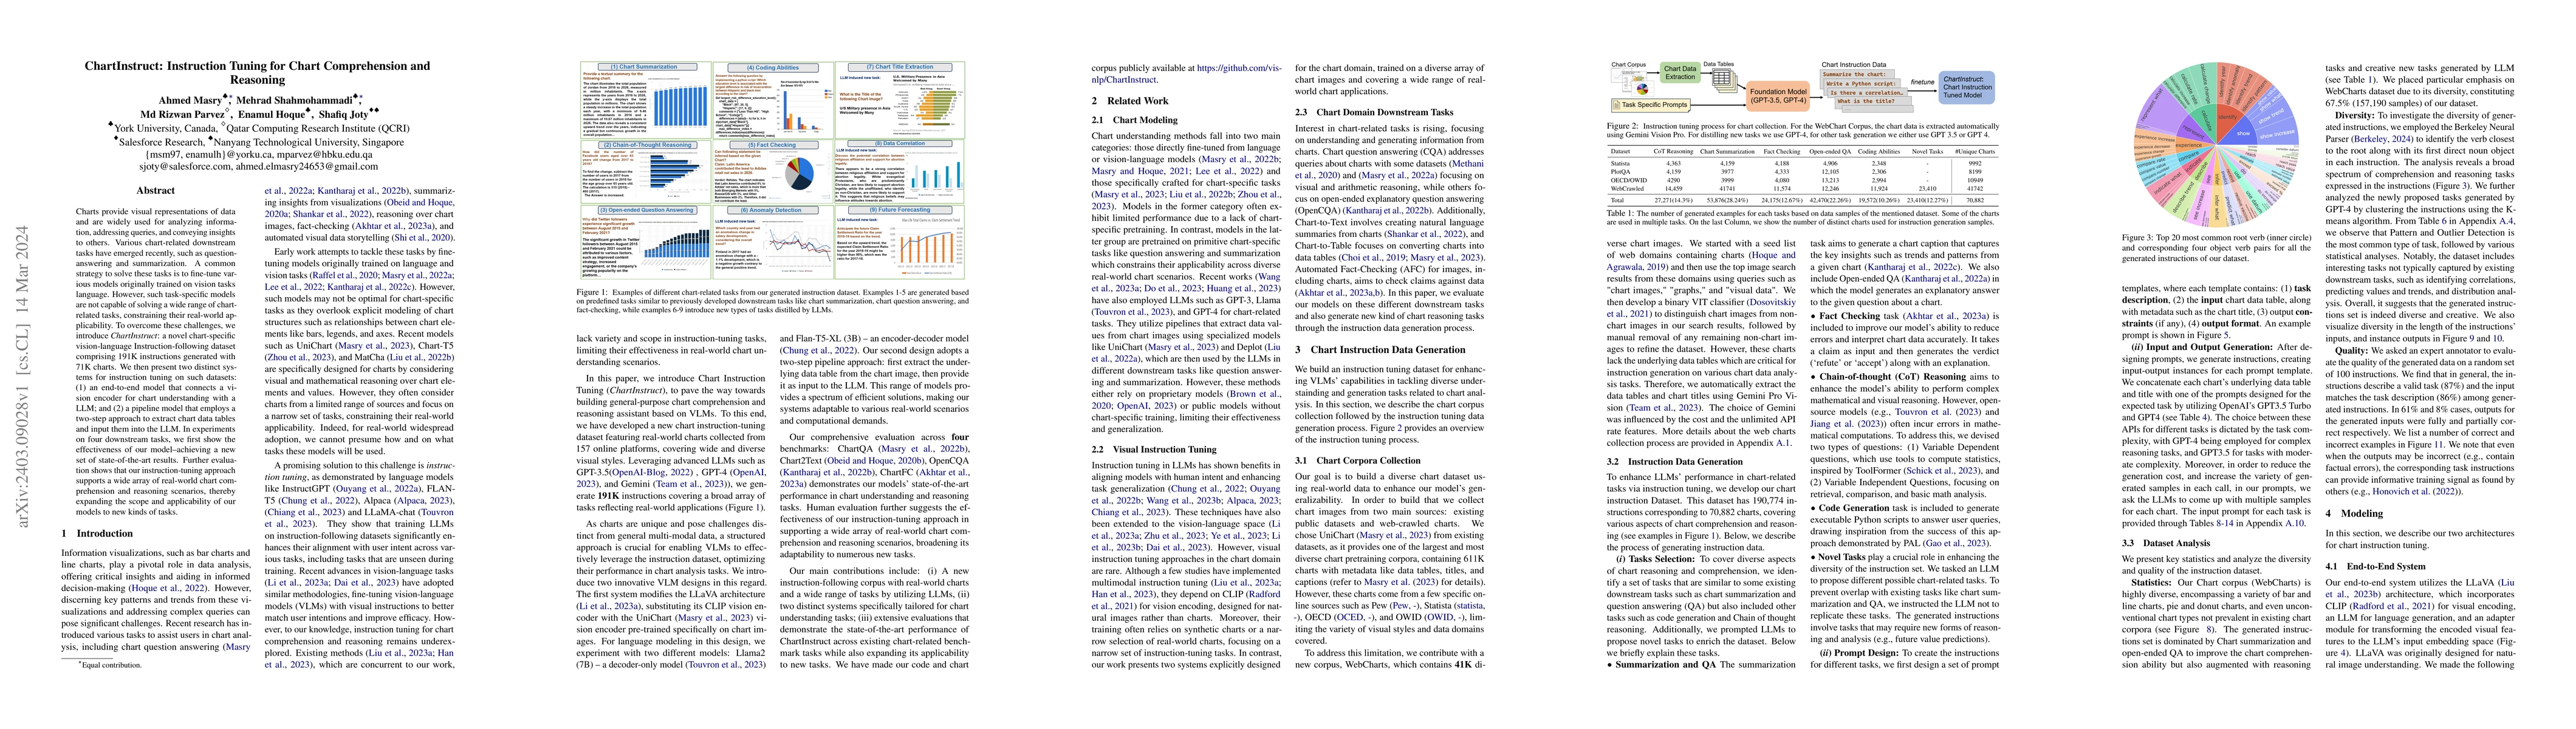
Charts provide visual representations of data and are widely used for analyzing information, addressing queries, and conveying insights to others. Various chart-related downstream tasks have emerged...
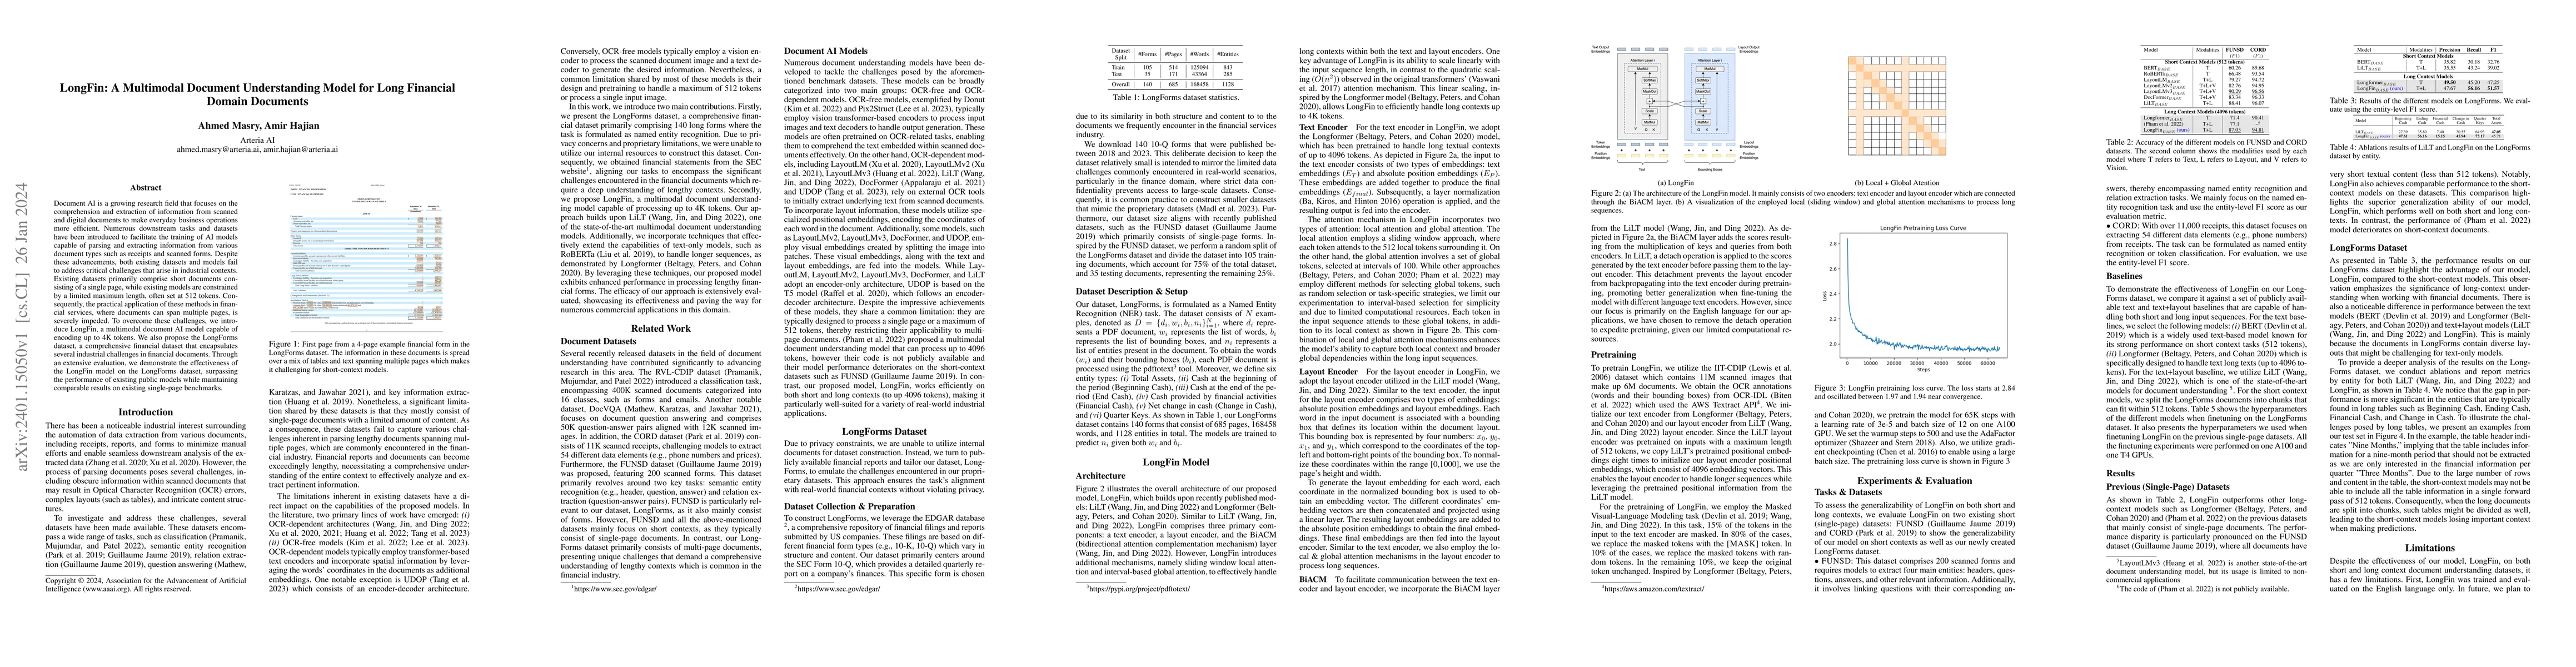
Document AI is a growing research field that focuses on the comprehension and extraction of information from scanned and digital documents to make everyday business operations more efficient. Numero...
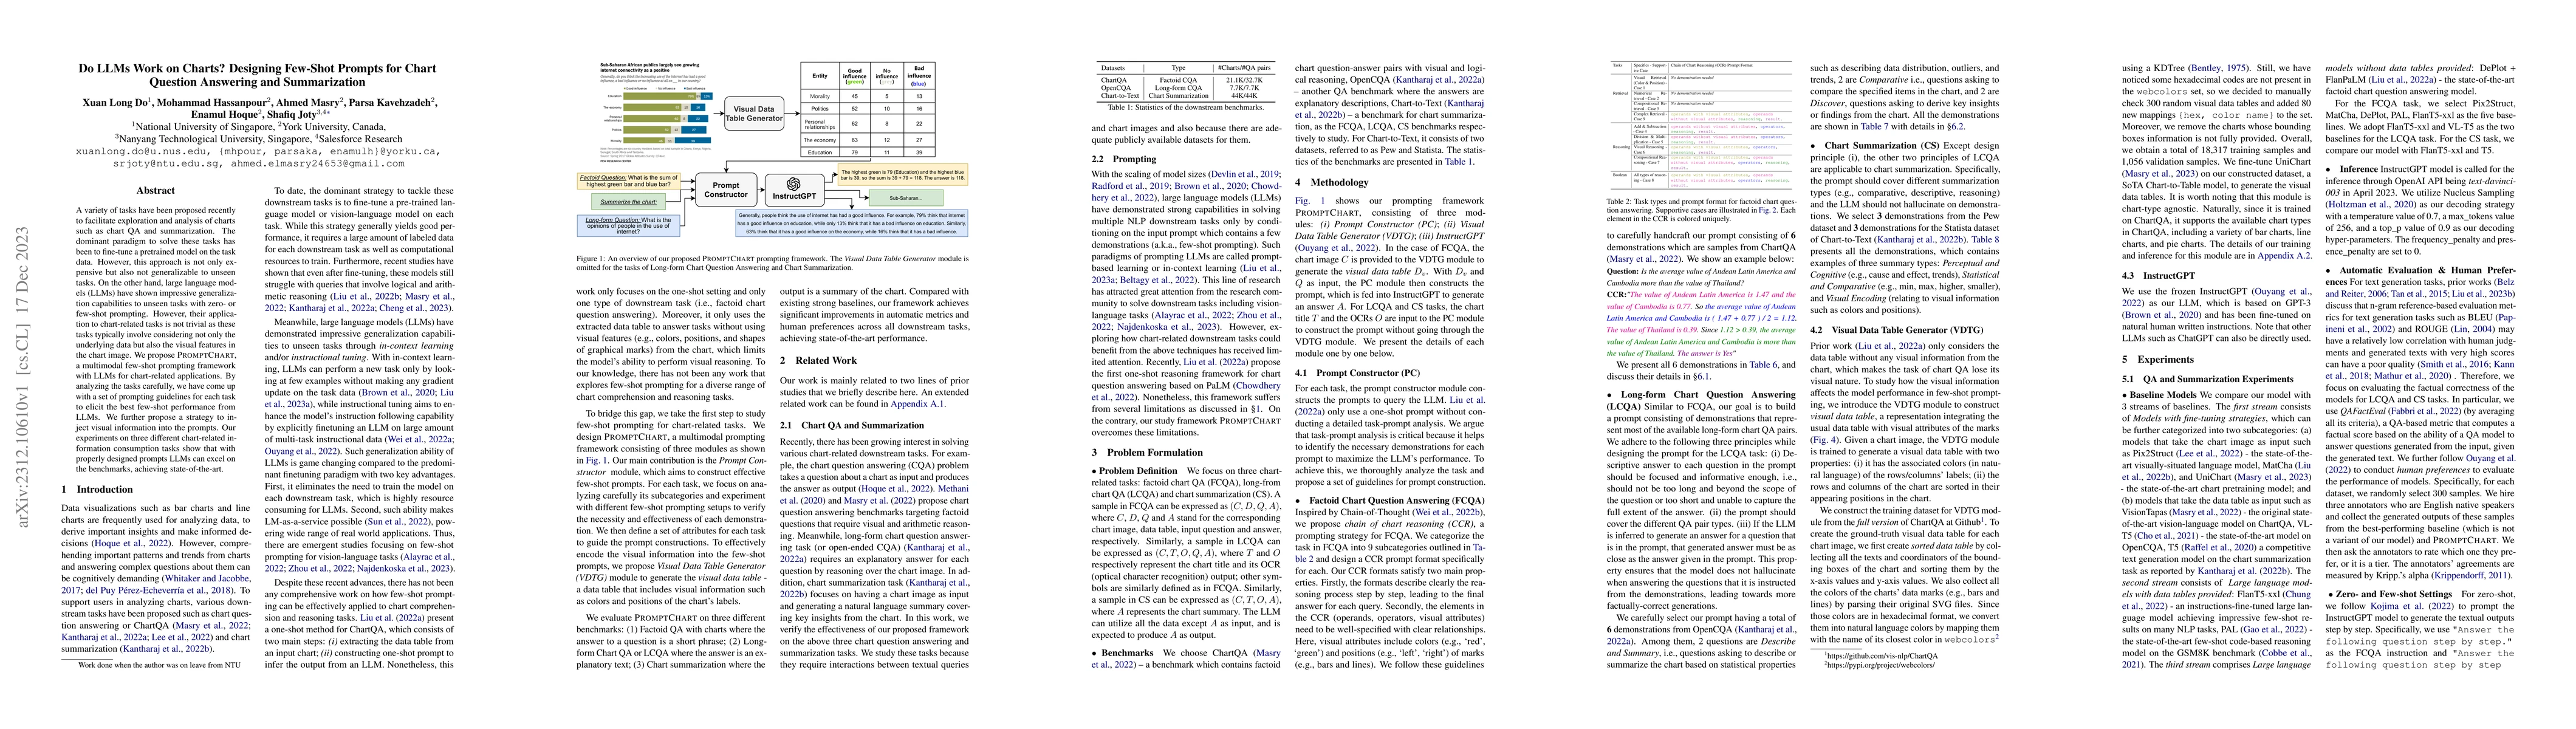
A number of tasks have been proposed recently to facilitate easy access to charts such as chart QA and summarization. The dominant paradigm to solve these tasks has been to fine-tune a pretrained mo...
Charts are very popular for analyzing data, visualizing key insights and answering complex reasoning questions about data. To facilitate chart-based data analysis using natural language, several dow...
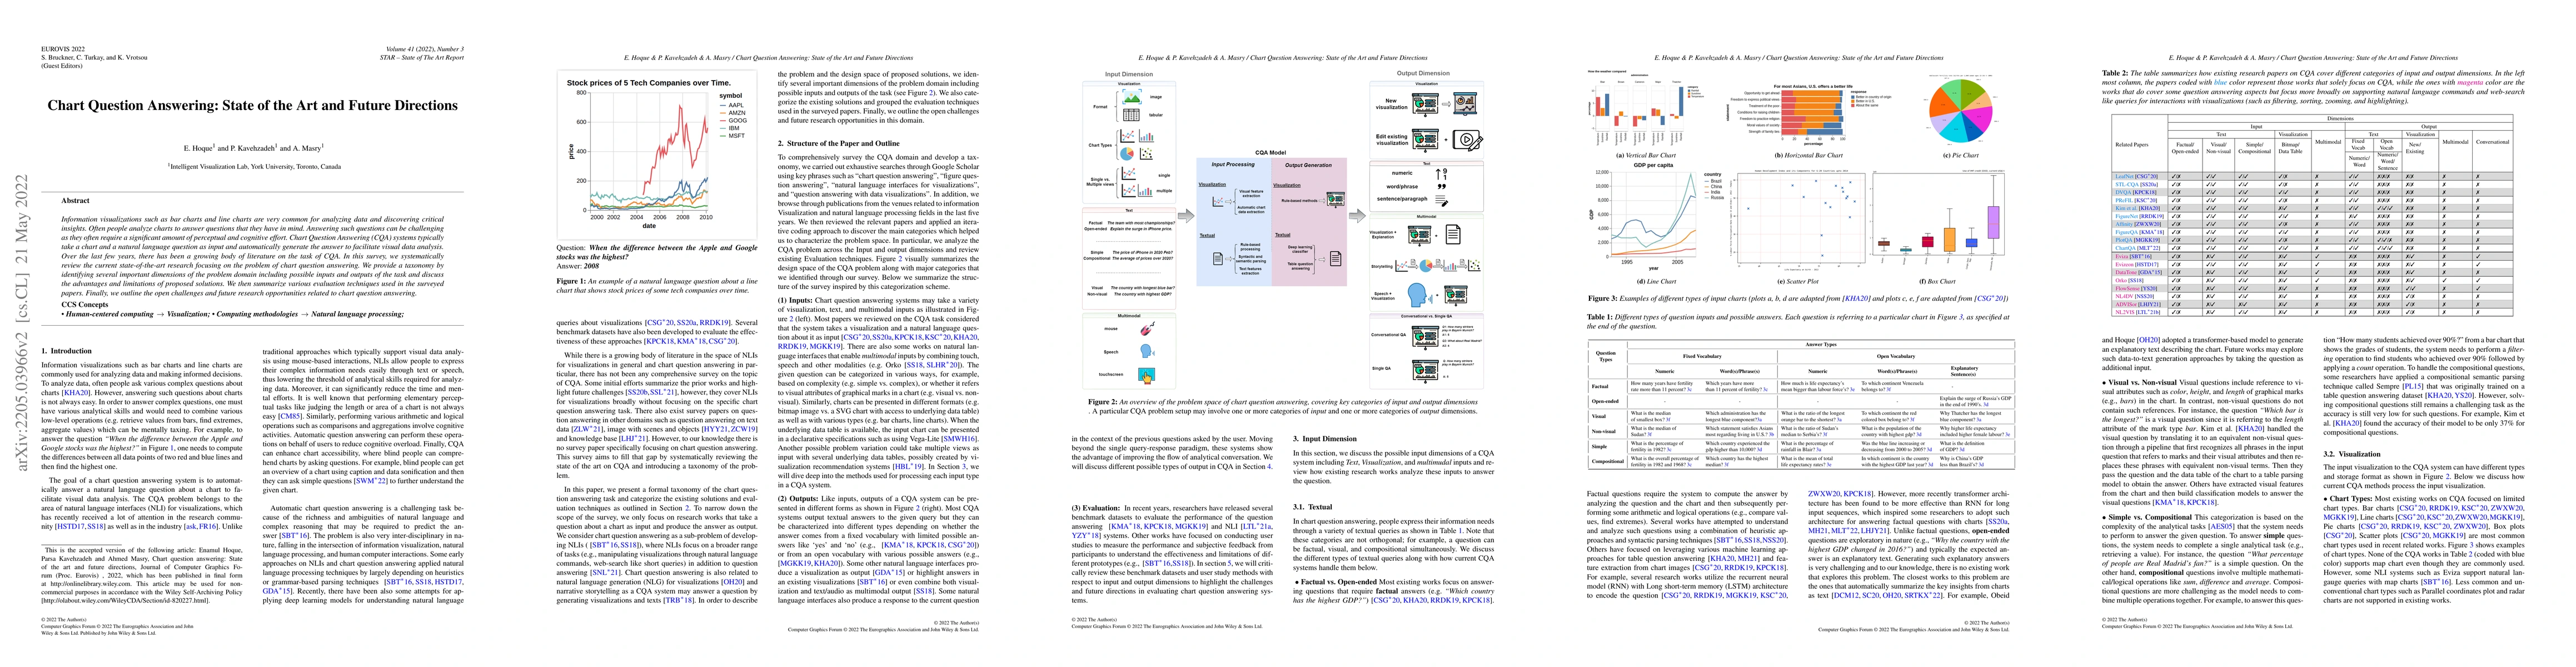
Information visualizations such as bar charts and line charts are very common for analyzing data and discovering critical insights. Often people analyze charts to answer questions that they have in ...
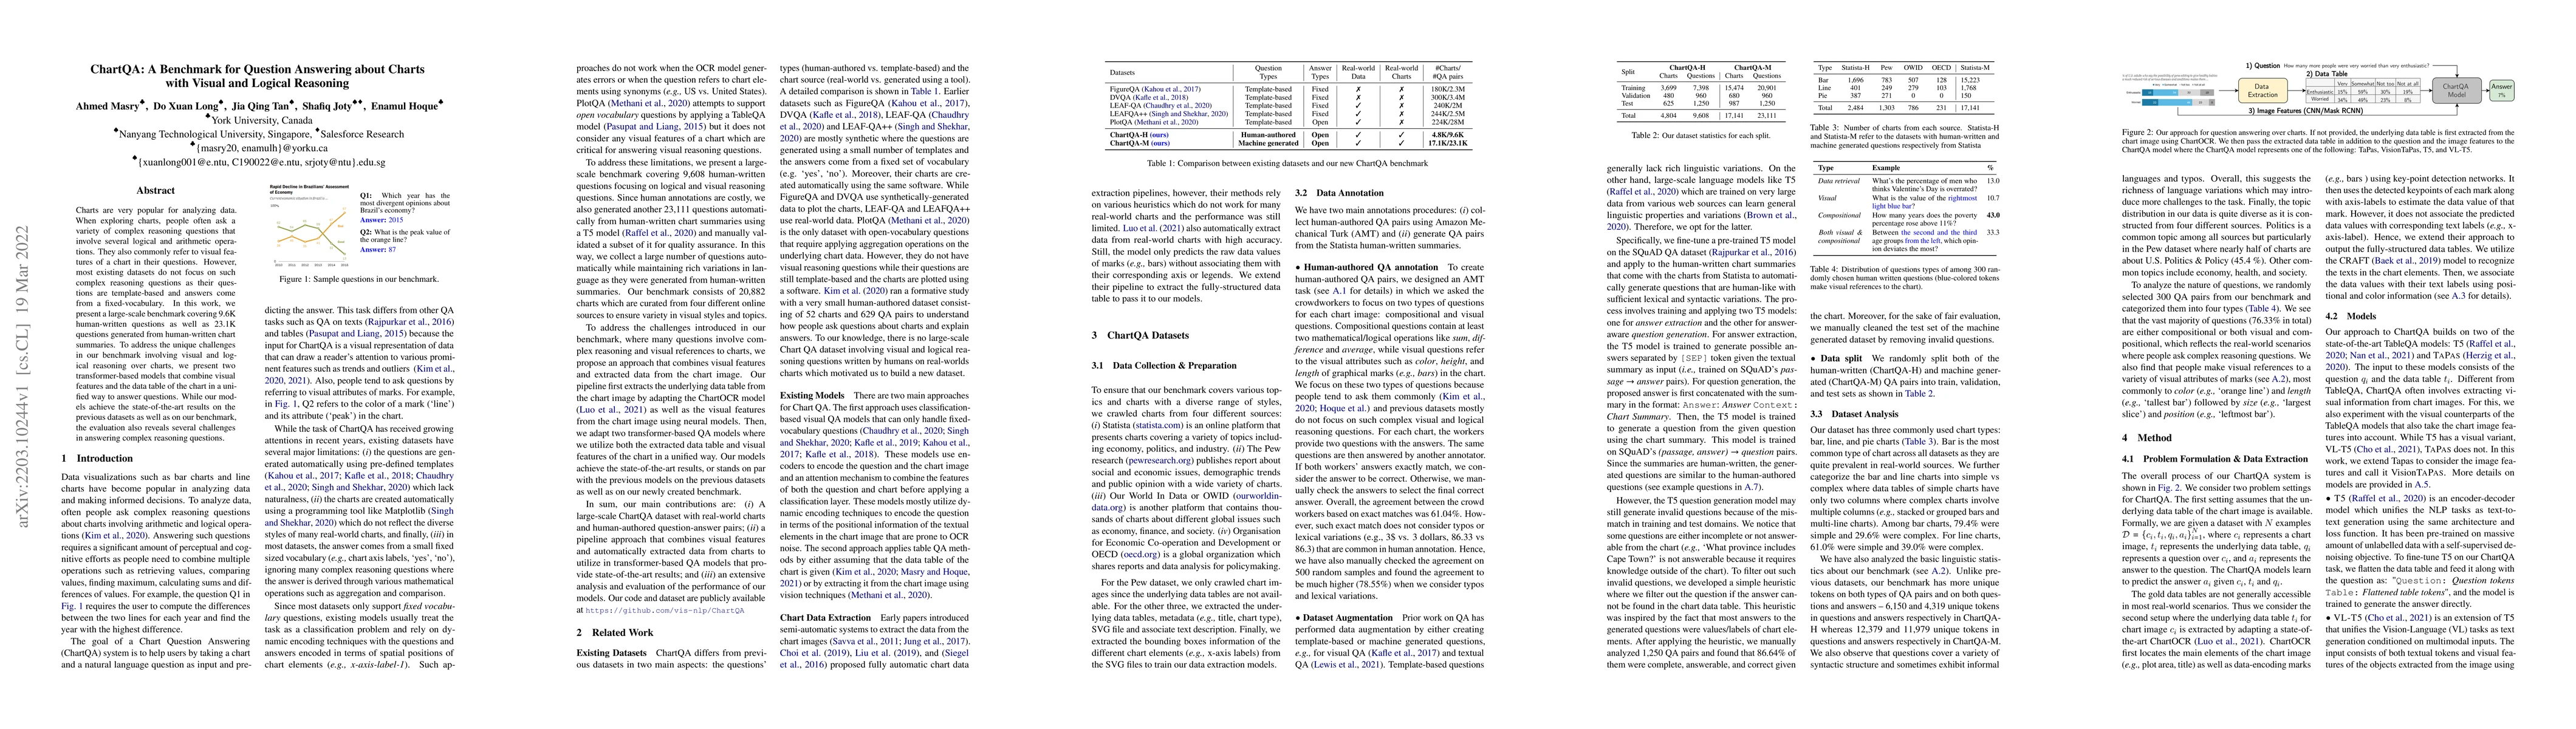
Charts are very popular for analyzing data. When exploring charts, people often ask a variety of complex reasoning questions that involve several logical and arithmetic operations. They also commonl...
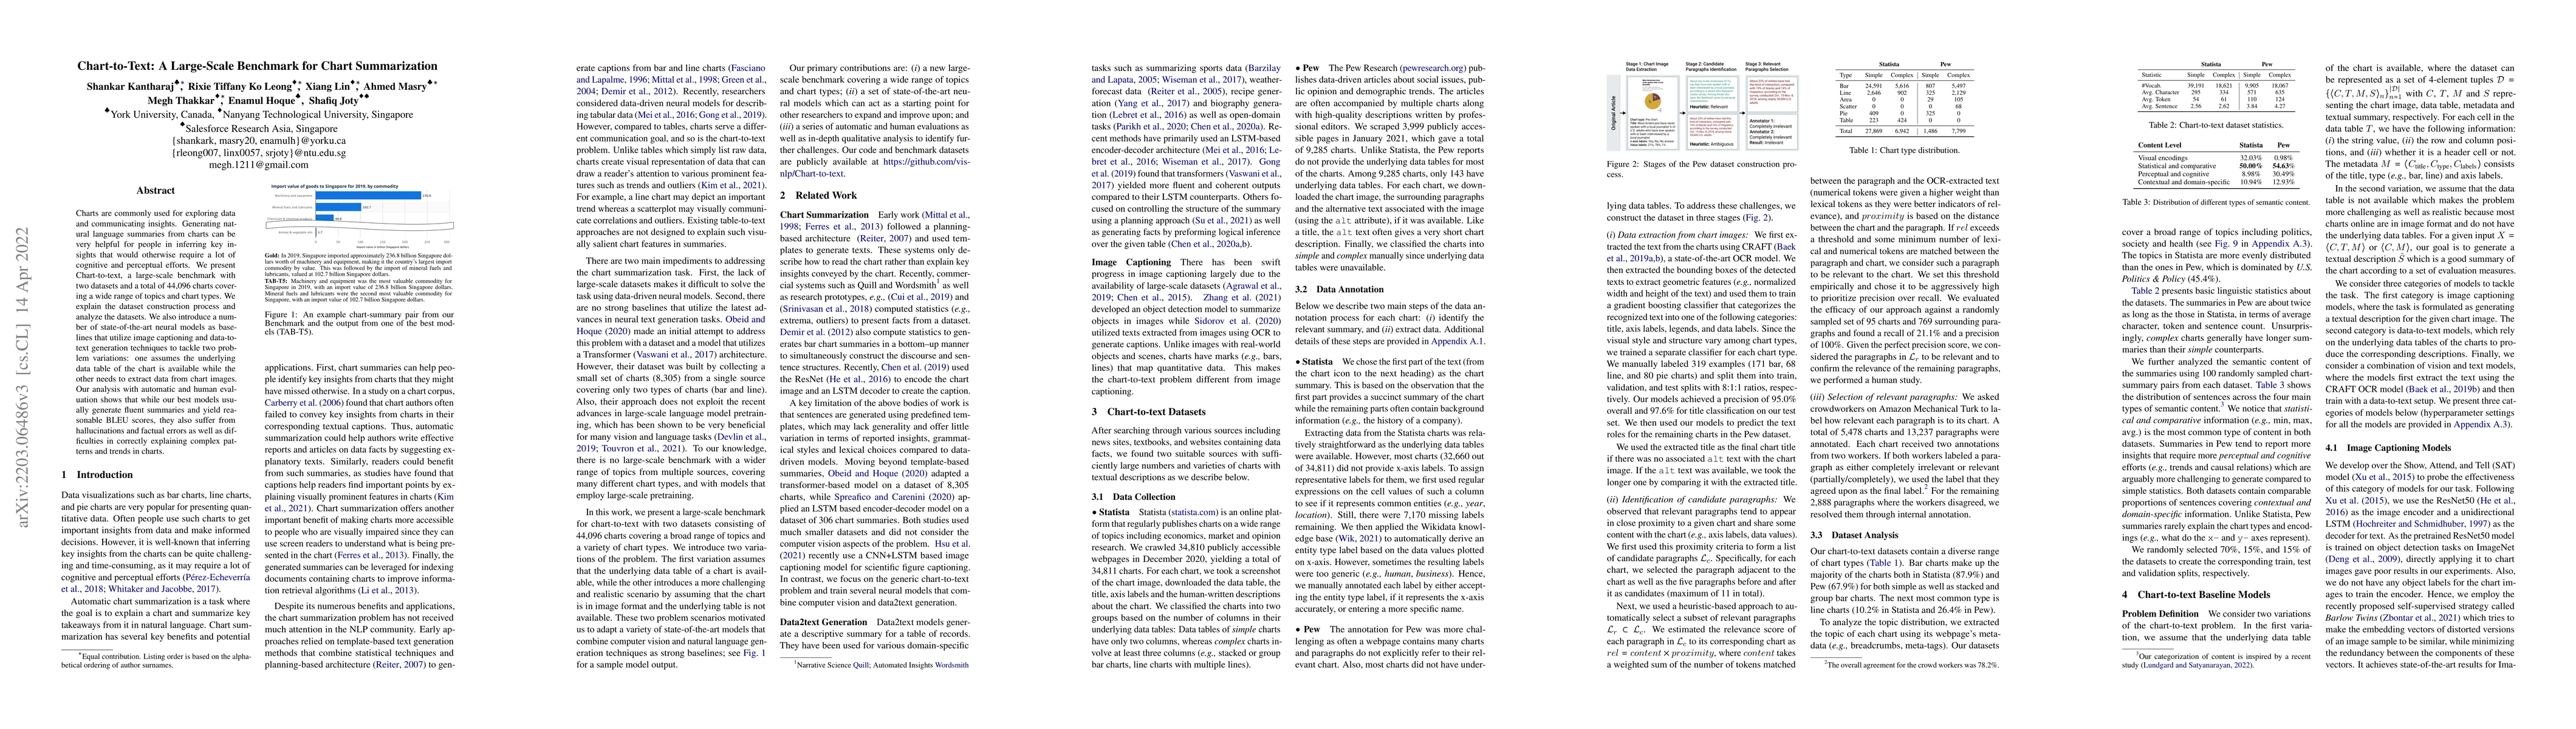
Charts are commonly used for exploring data and communicating insights. Generating natural language summaries from charts can be very helpful for people in inferring key insights that would otherwis...
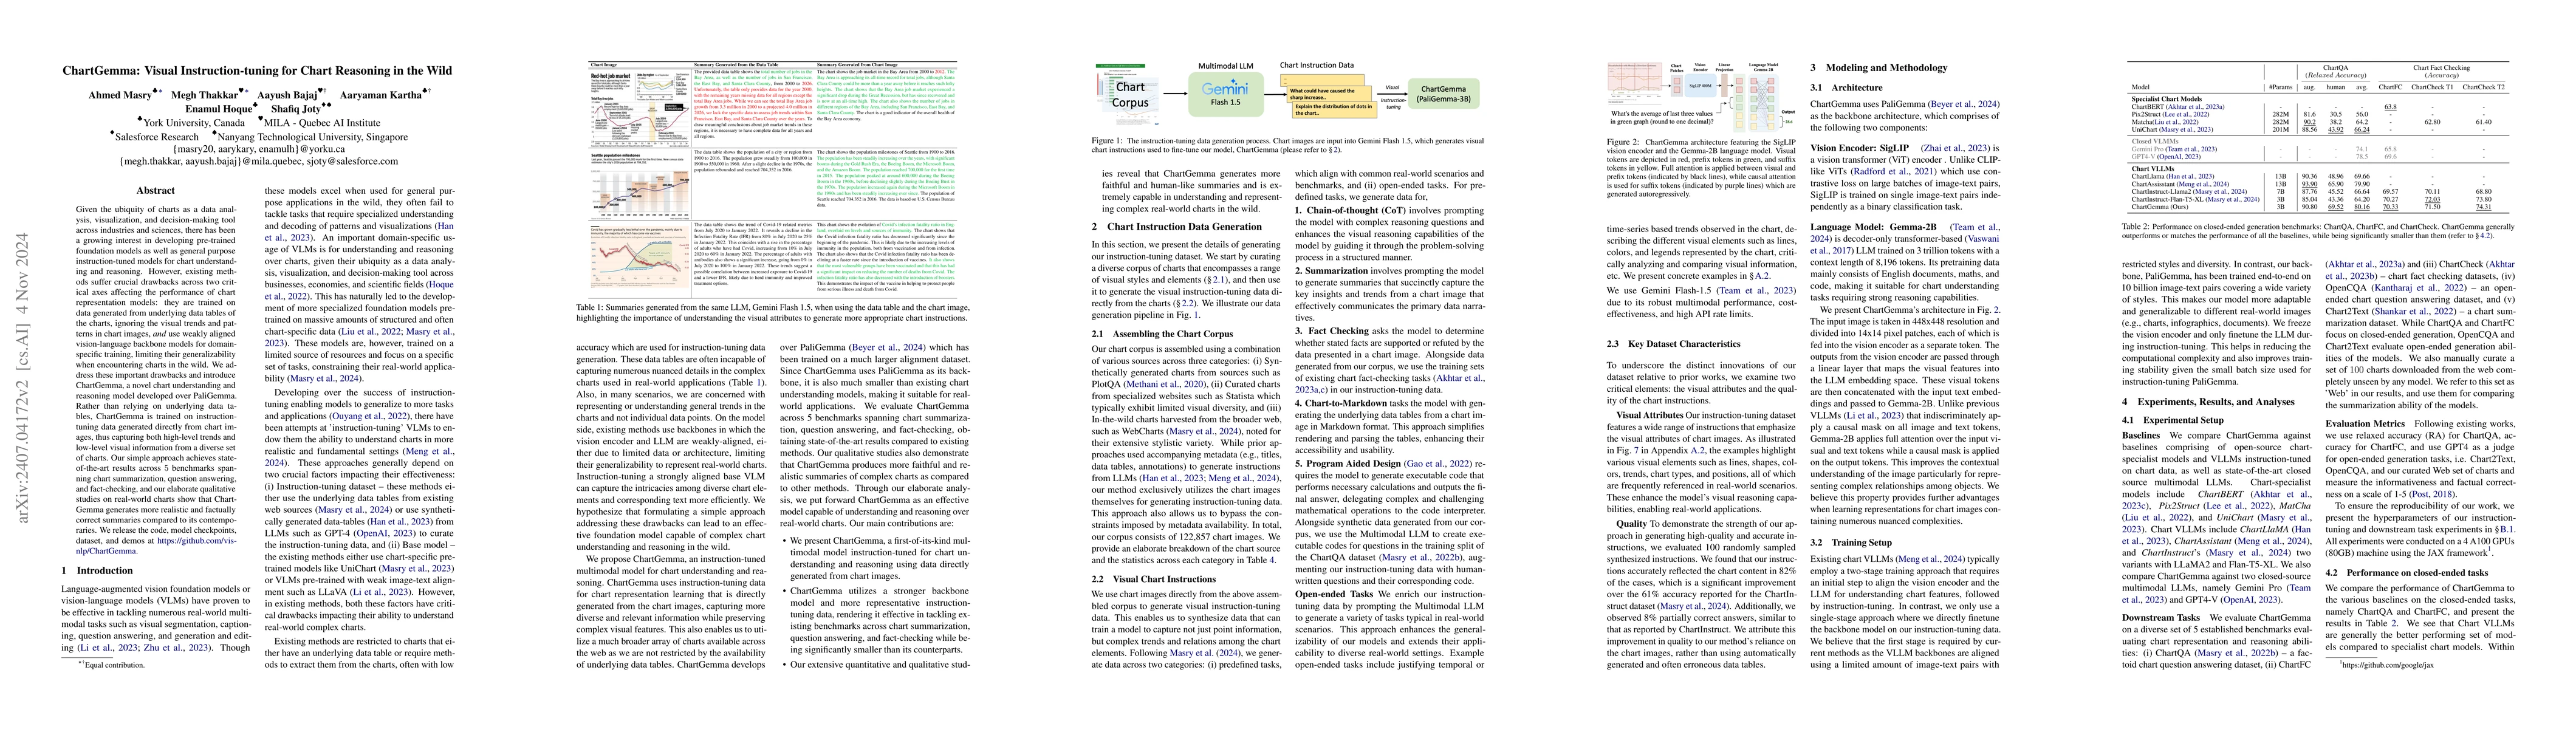
Given the ubiquity of charts as a data analysis, visualization, and decision-making tool across industries and sciences, there has been a growing interest in developing pre-trained foundation models a...
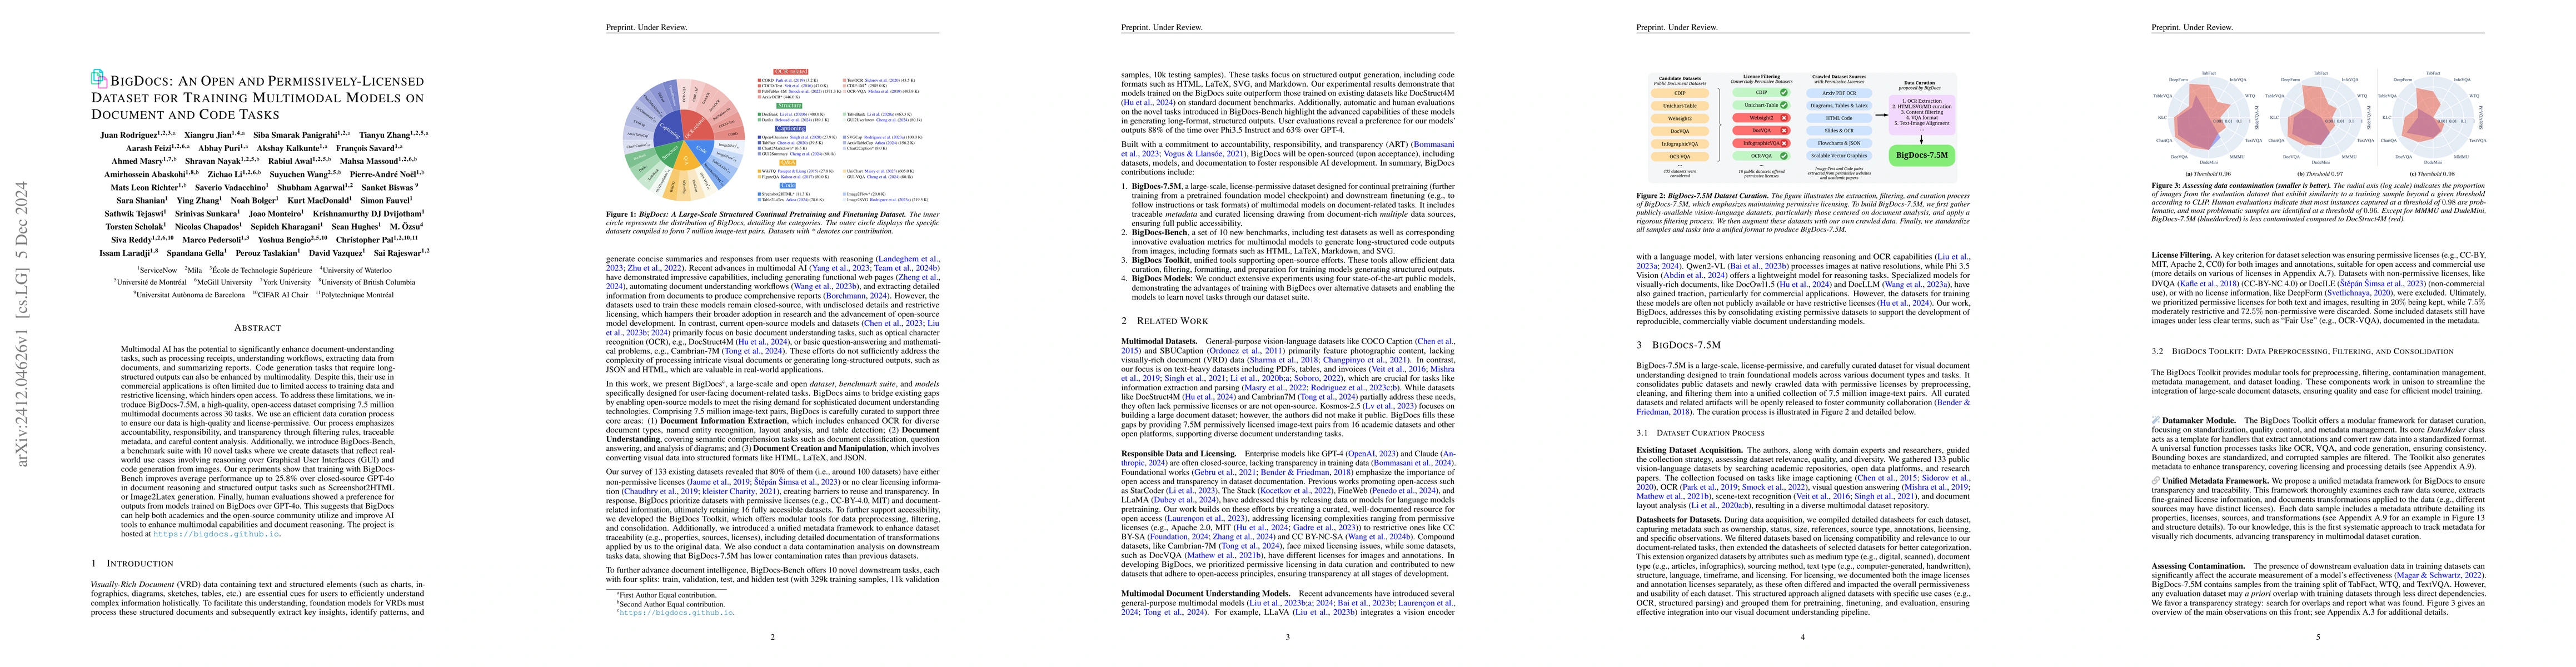
Multimodal AI has the potential to significantly enhance document-understanding tasks, such as processing receipts, understanding workflows, extracting data from documents, and summarizing reports. Co...
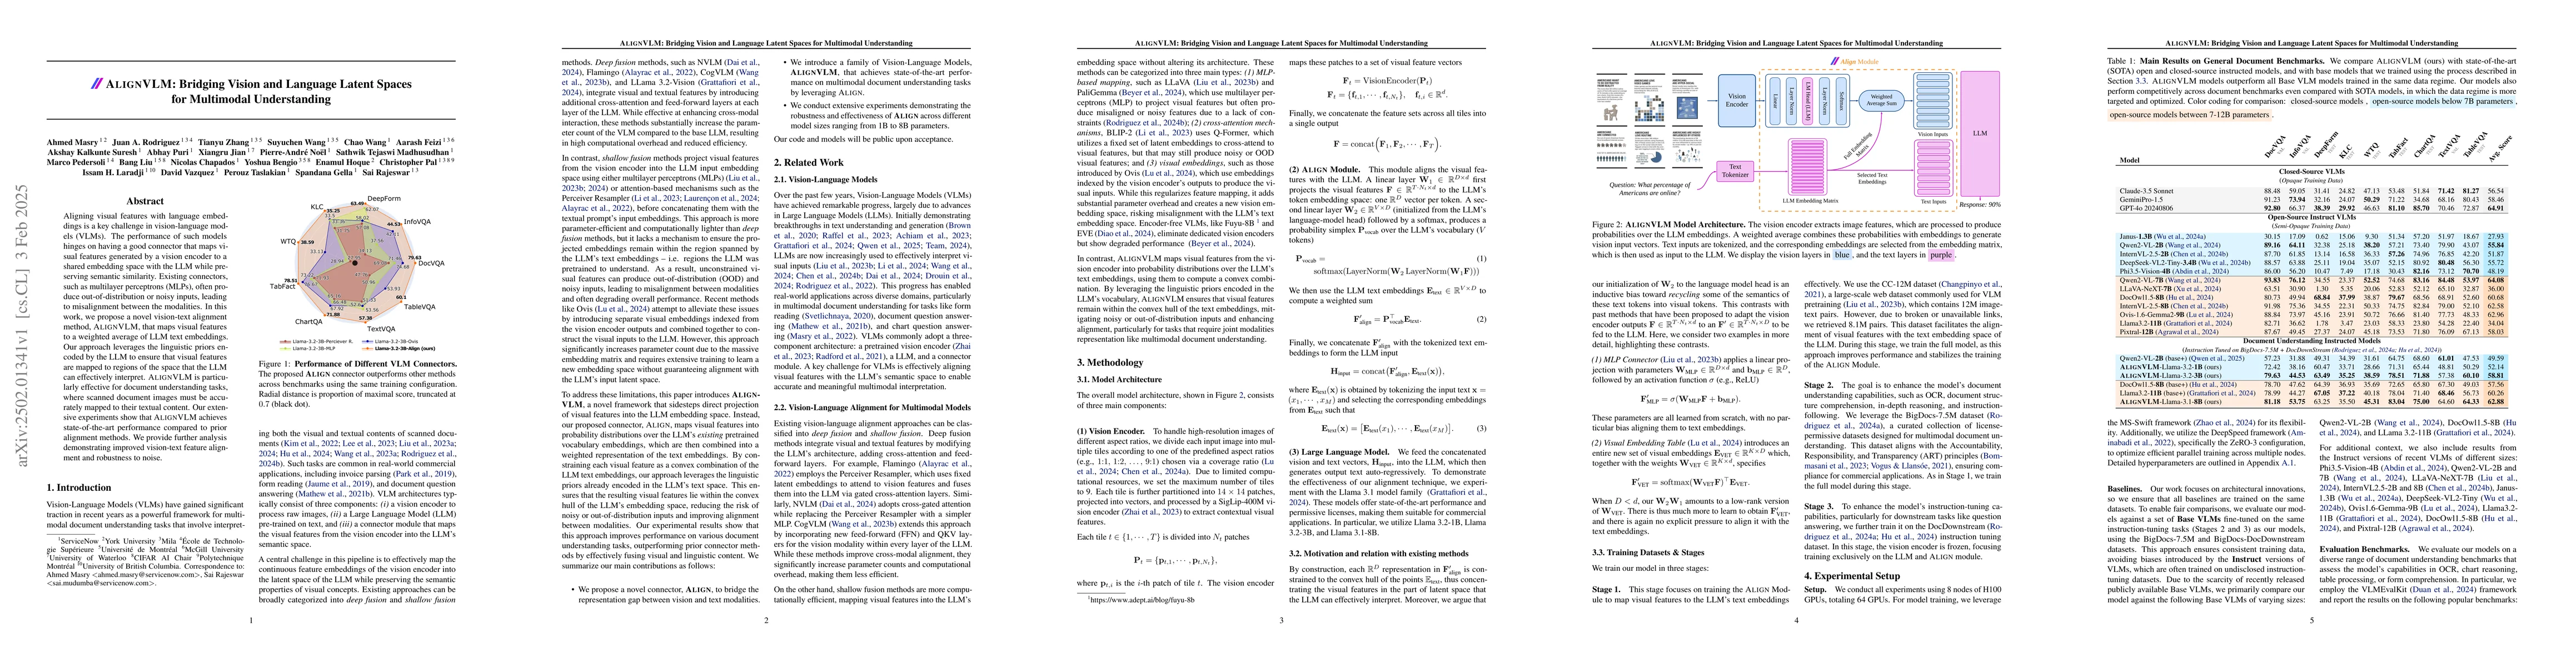
Aligning visual features with language embeddings is a key challenge in vision-language models (VLMs). The performance of such models hinges on having a good connector that maps visual features genera...
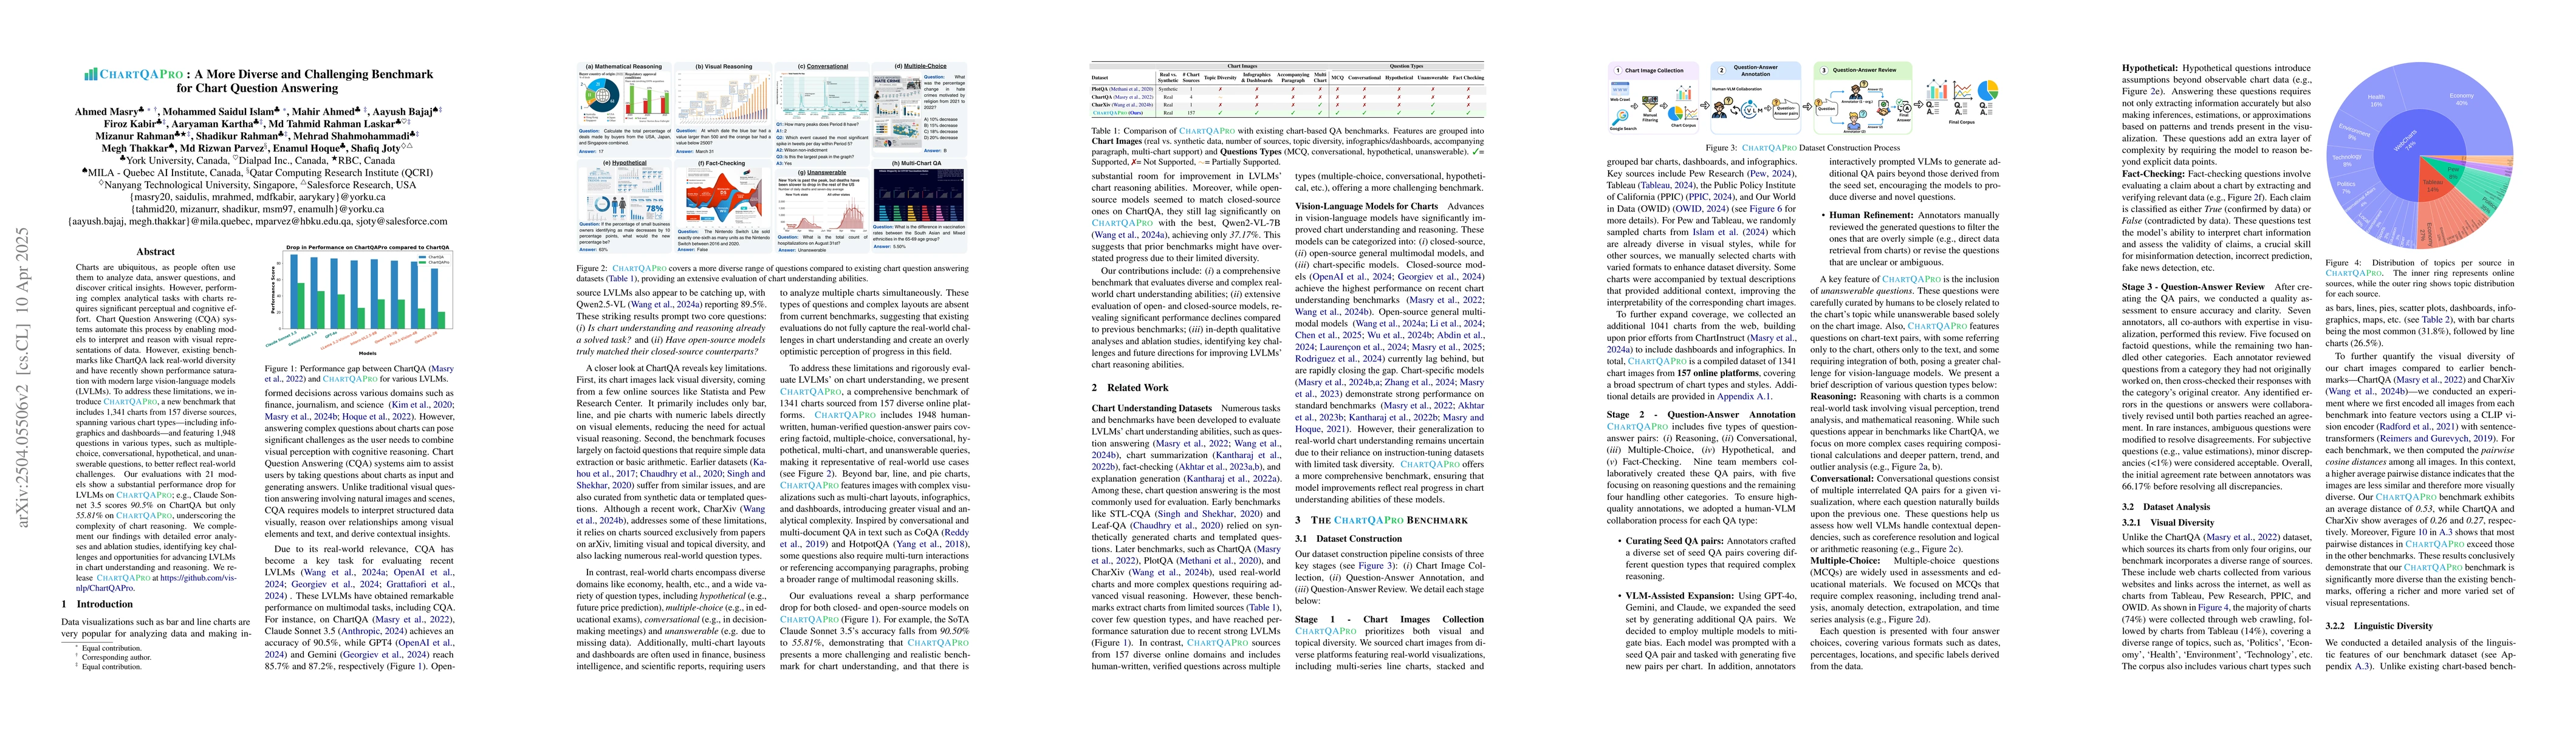
Charts are ubiquitous, as people often use them to analyze data, answer questions, and discover critical insights. However, performing complex analytical tasks with charts requires significant percept...
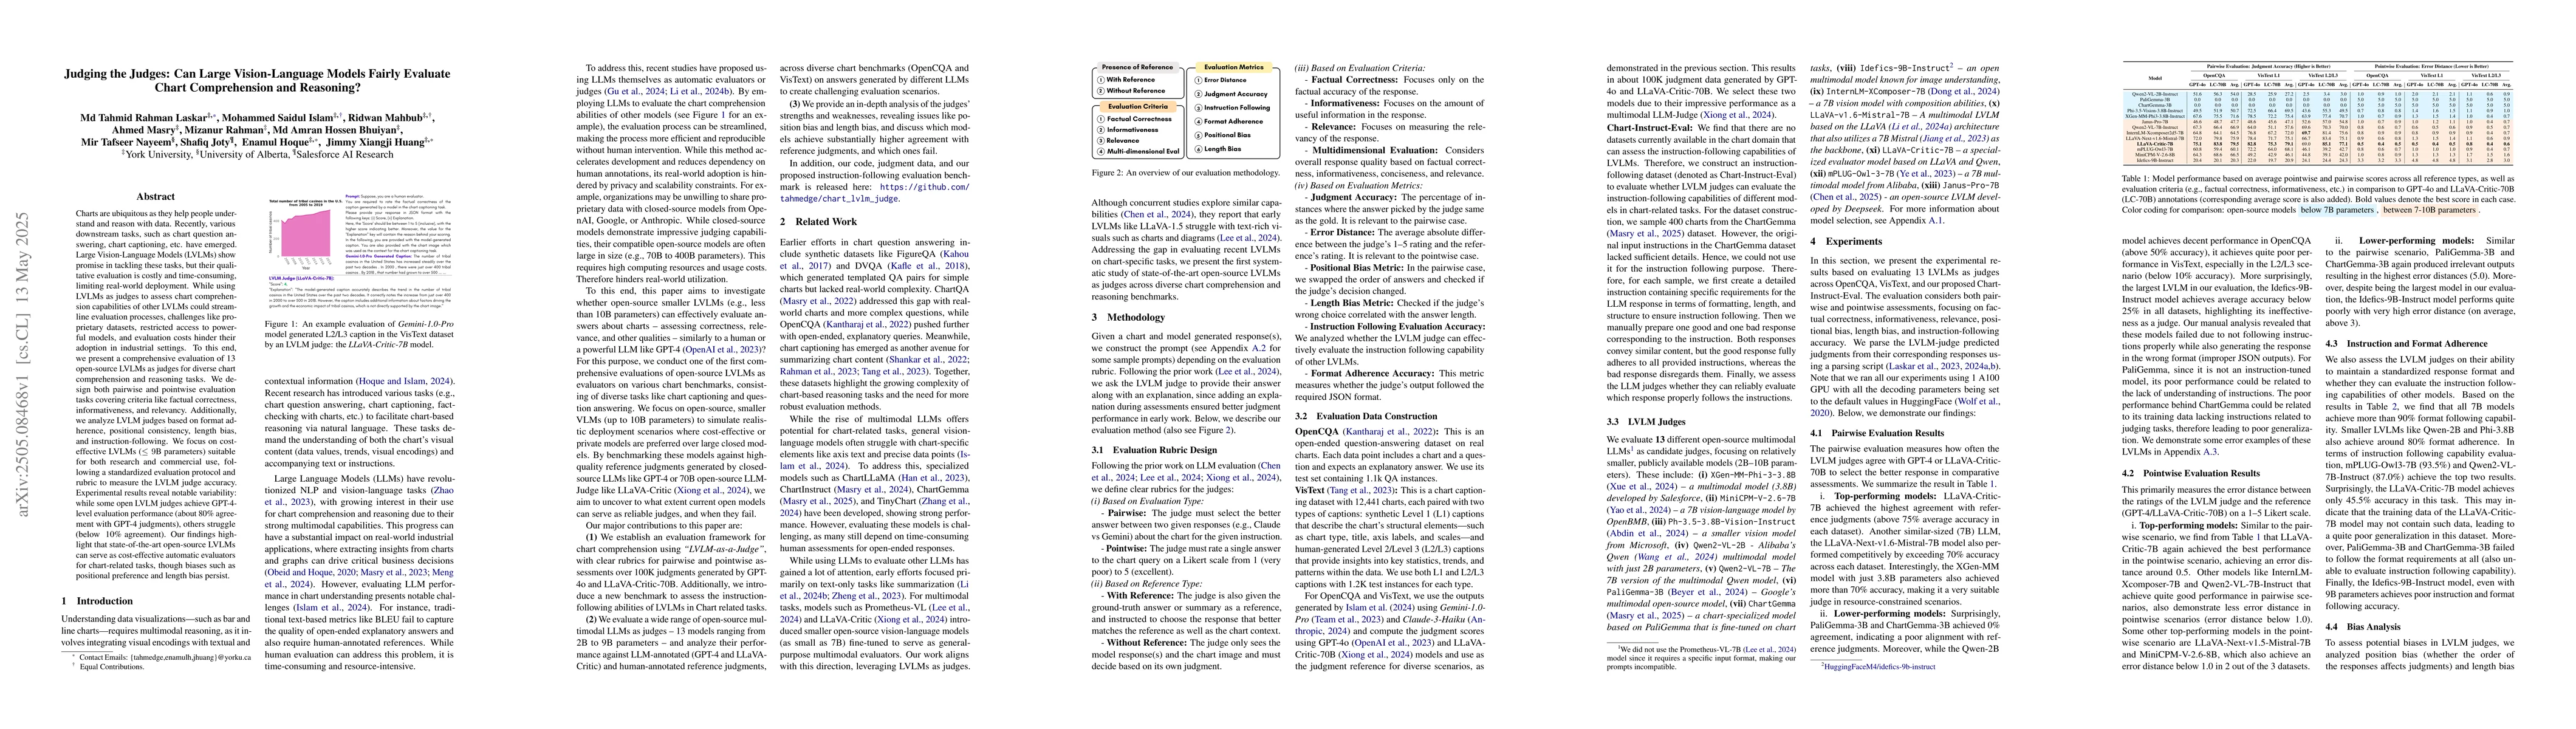
Charts are ubiquitous as they help people understand and reason with data. Recently, various downstream tasks, such as chart question answering, chart2text, and fact-checking, have emerged. Large Visi...
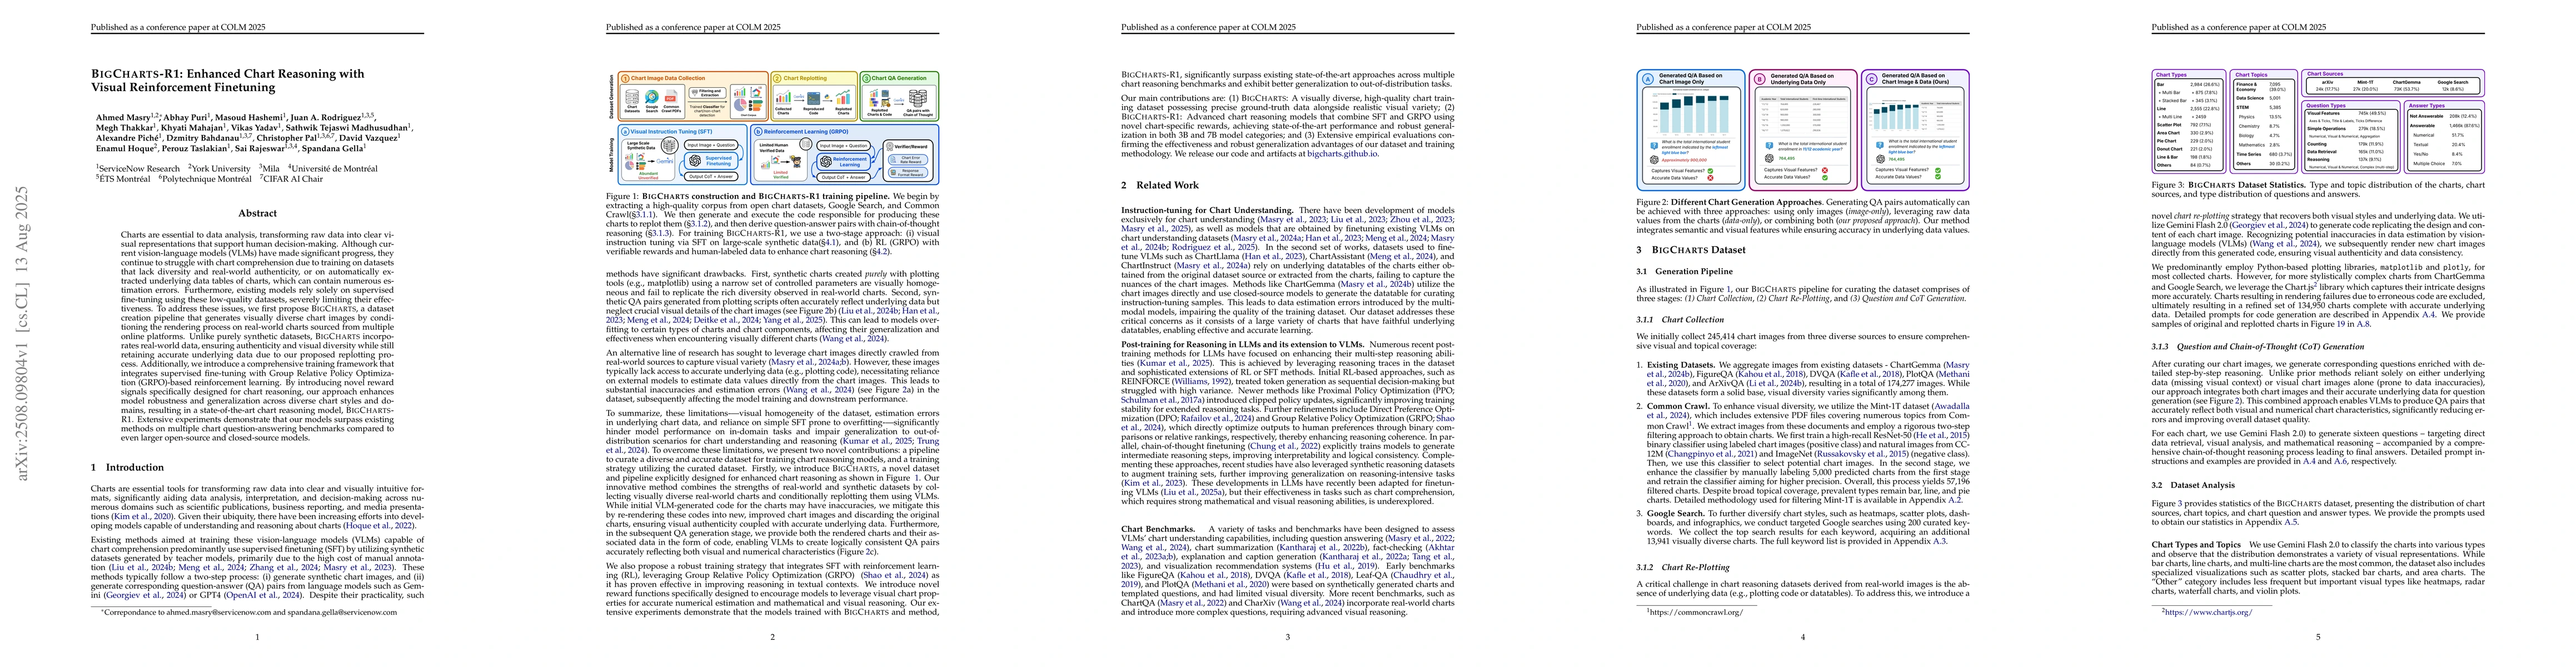
Charts are essential to data analysis, transforming raw data into clear visual representations that support human decision-making. Although current vision-language models (VLMs) have made significant ...
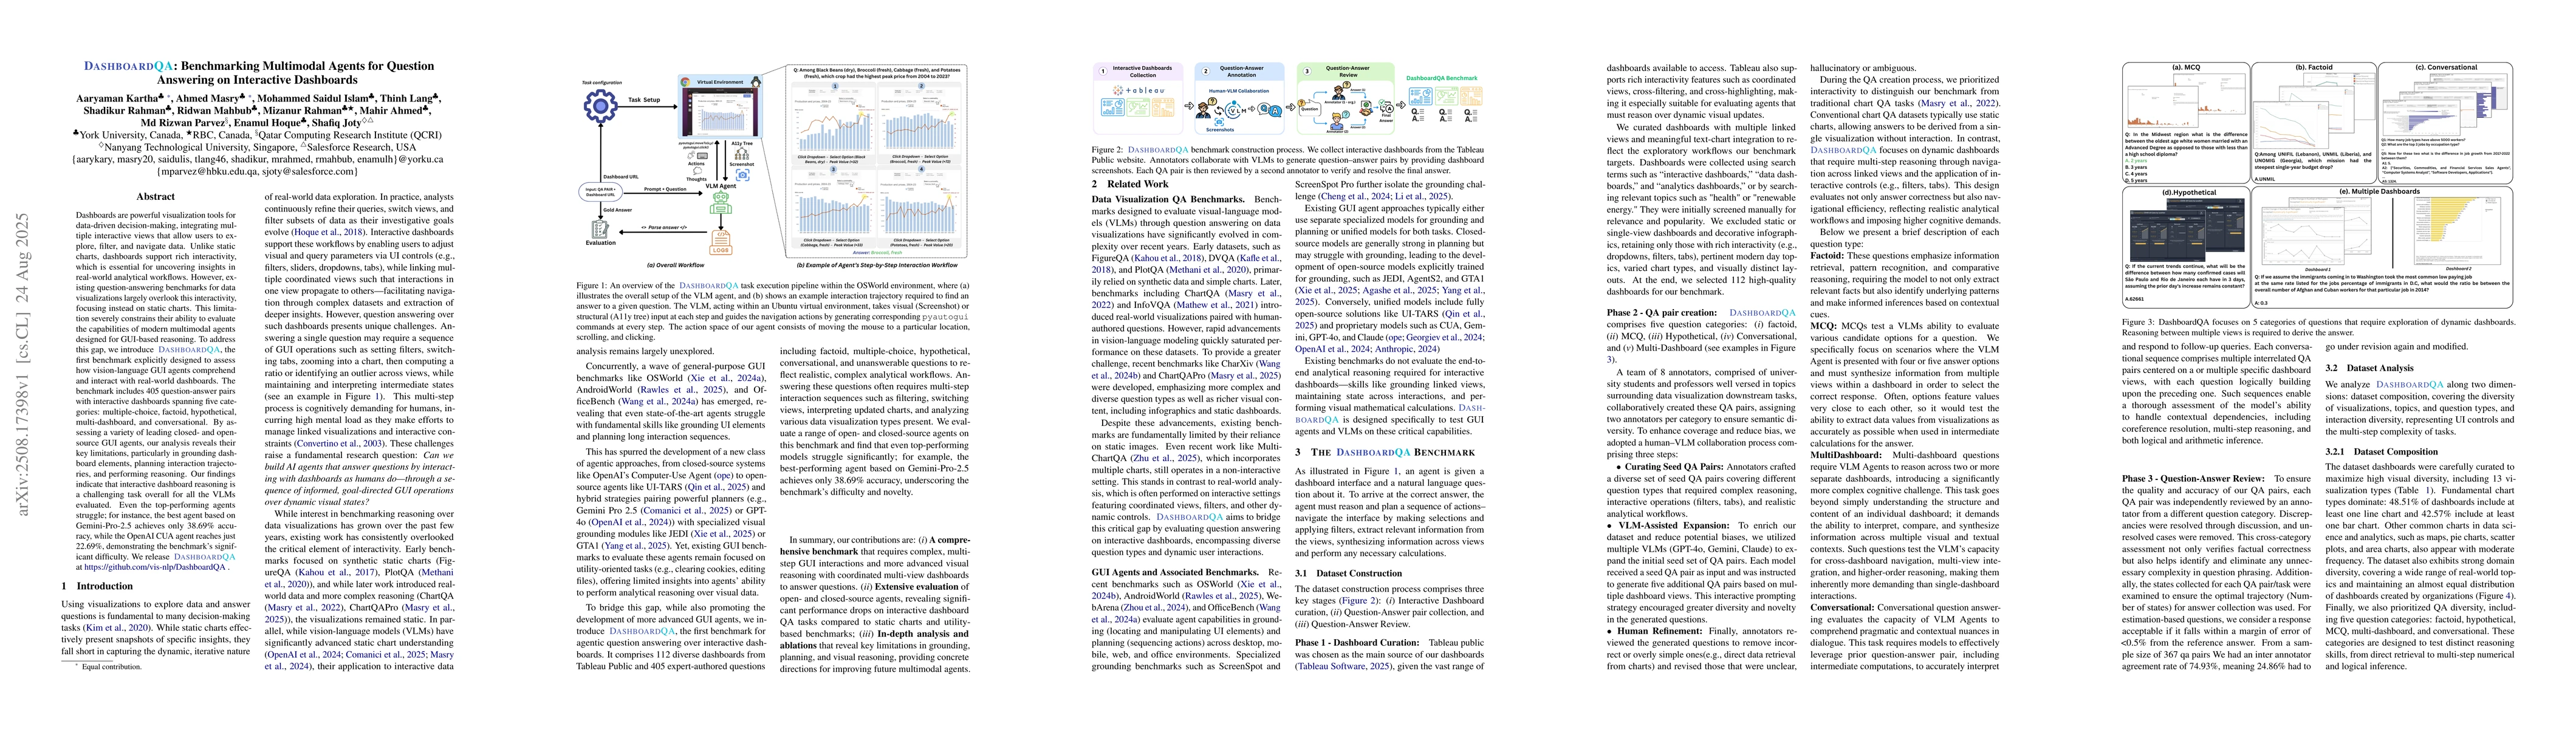
Dashboards are powerful visualization tools for data-driven decision-making, integrating multiple interactive views that allow users to explore, filter, and navigate data. Unlike static charts, dashbo...
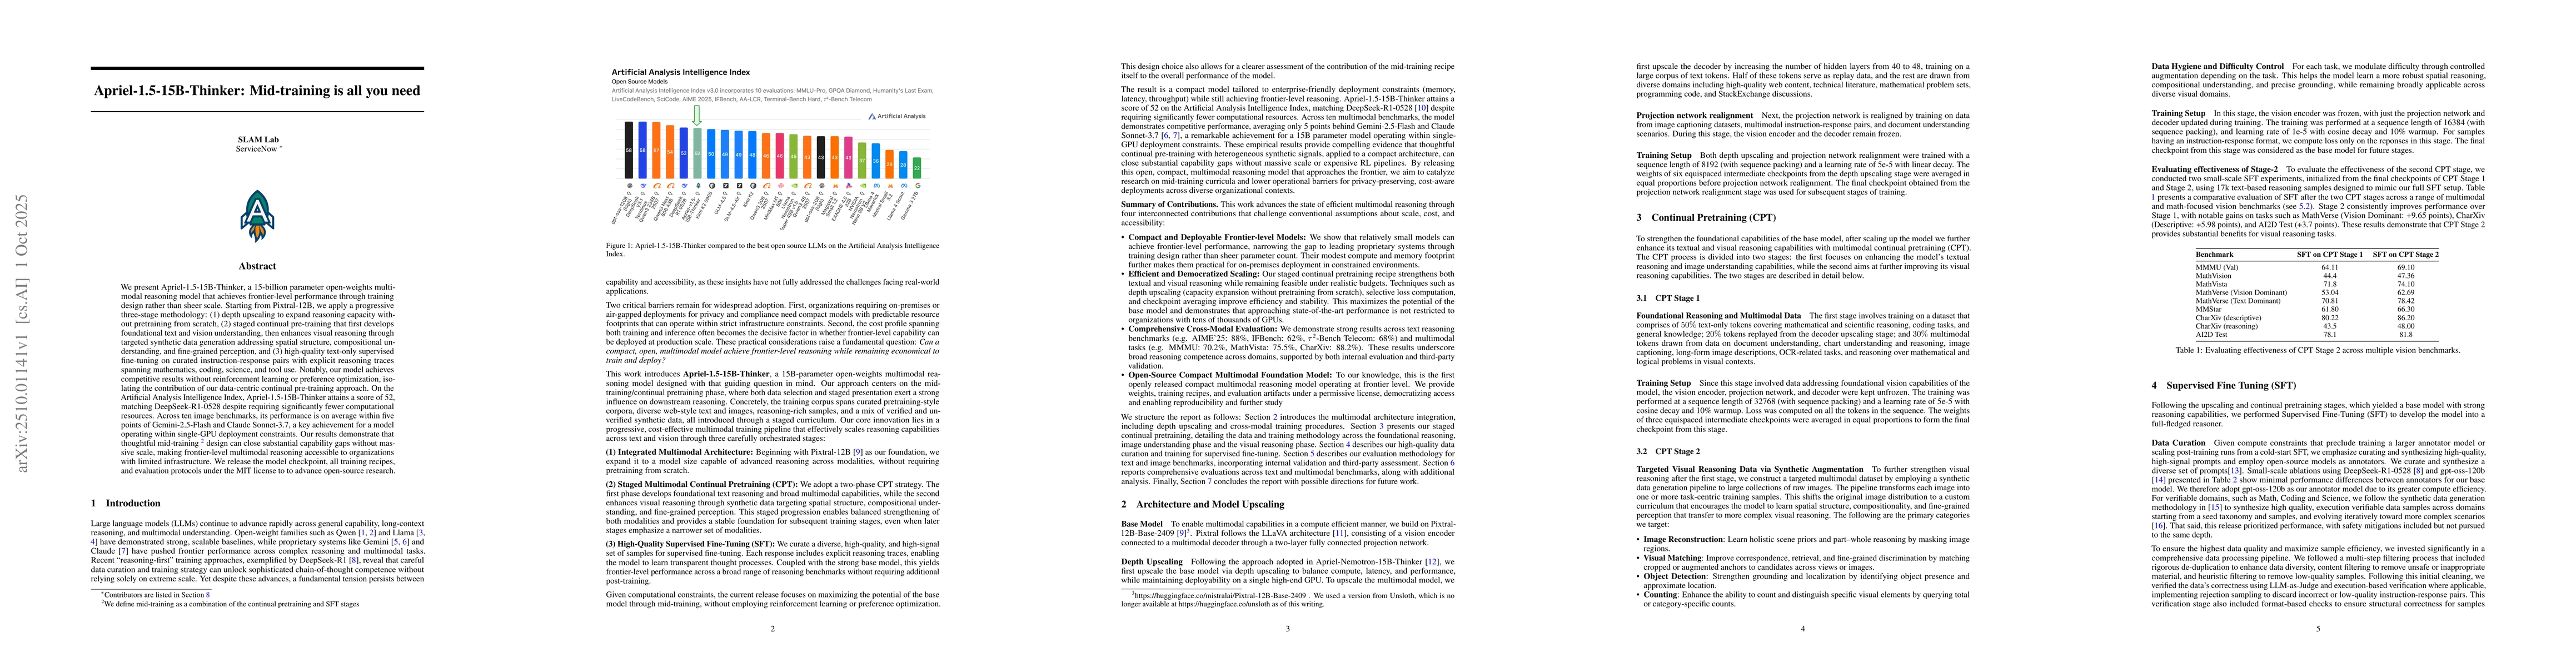
We present Apriel-1.5-15B-Thinker, a 15-billion parameter open-weights multimodal reasoning model that achieves frontier-level performance through training design rather than sheer scale. Starting fro...
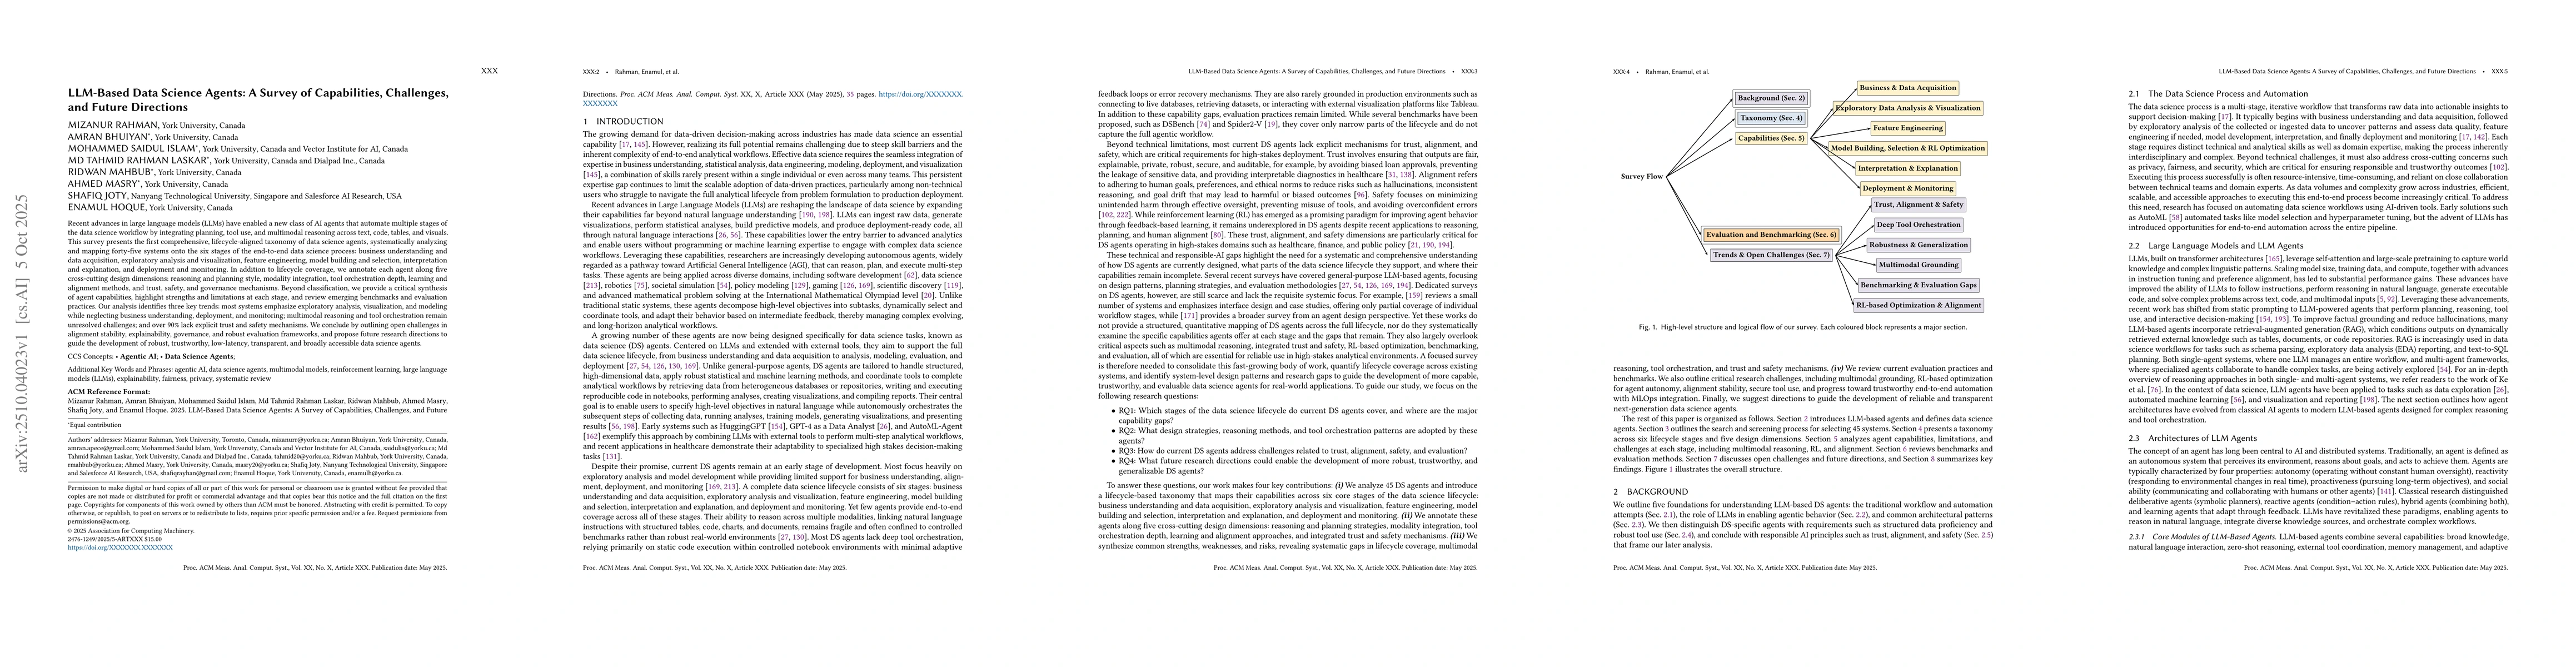
Recent advances in large language models (LLMs) have enabled a new class of AI agents that automate multiple stages of the data science workflow by integrating planning, tool use, and multimodal reaso...
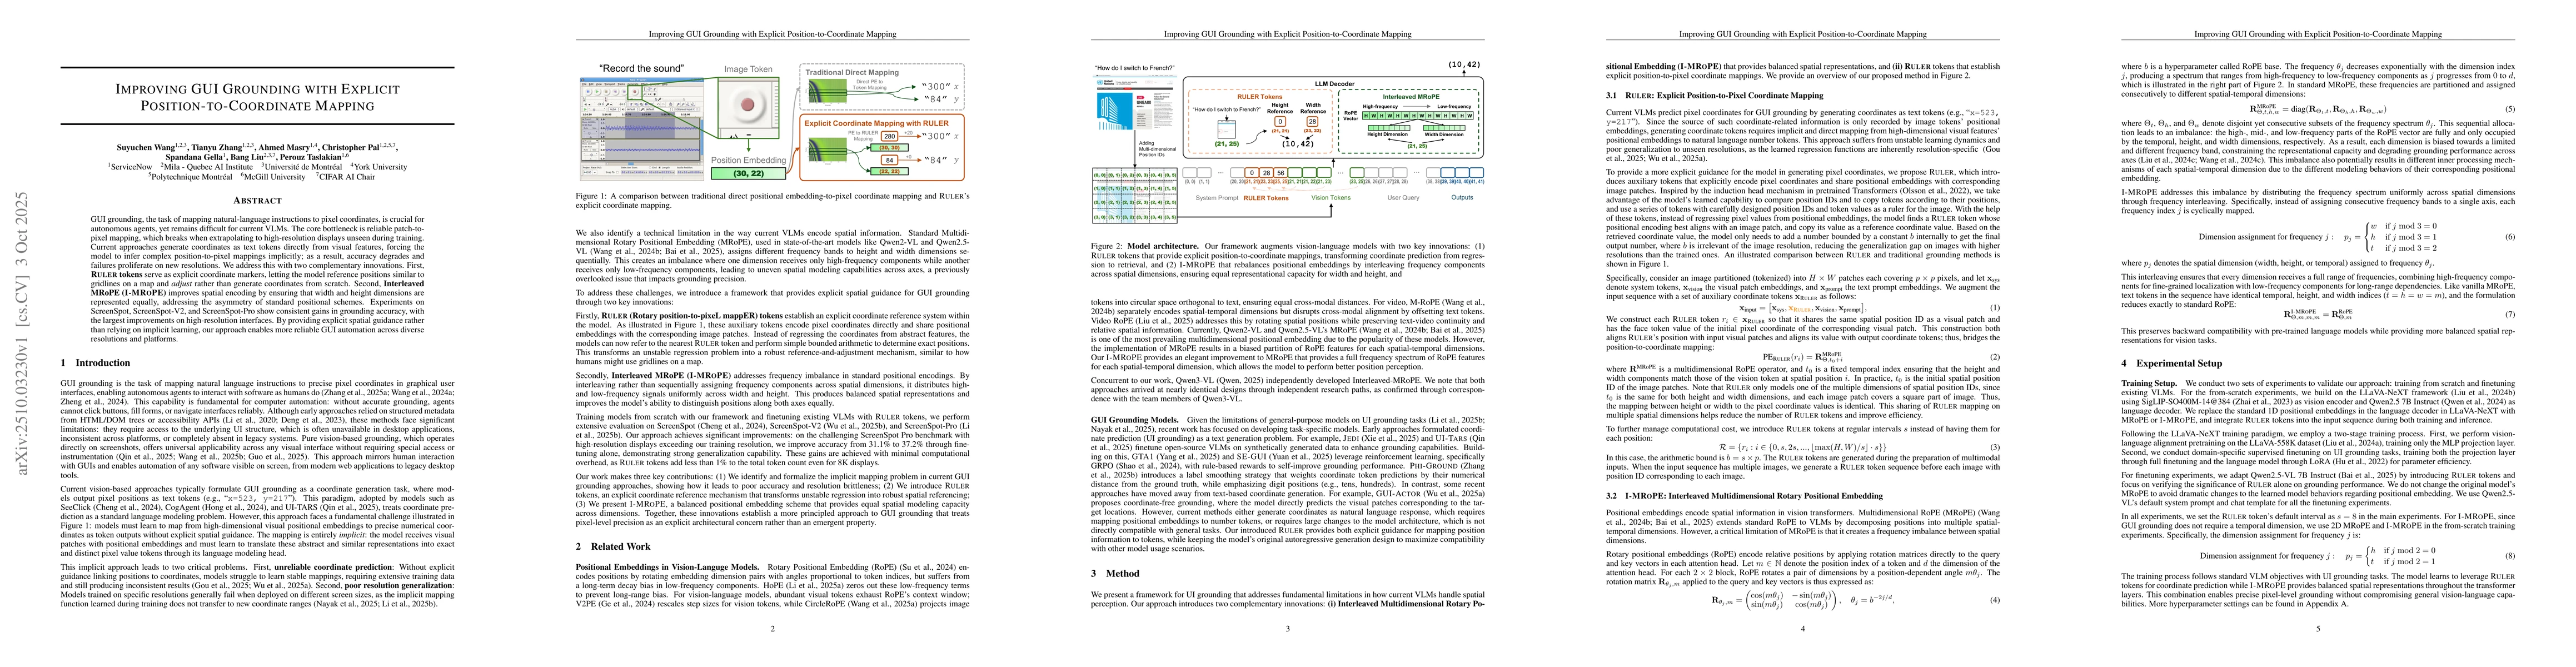
GUI grounding, the task of mapping natural-language instructions to pixel coordinates, is crucial for autonomous agents, yet remains difficult for current VLMs. The core bottleneck is reliable patch-t...
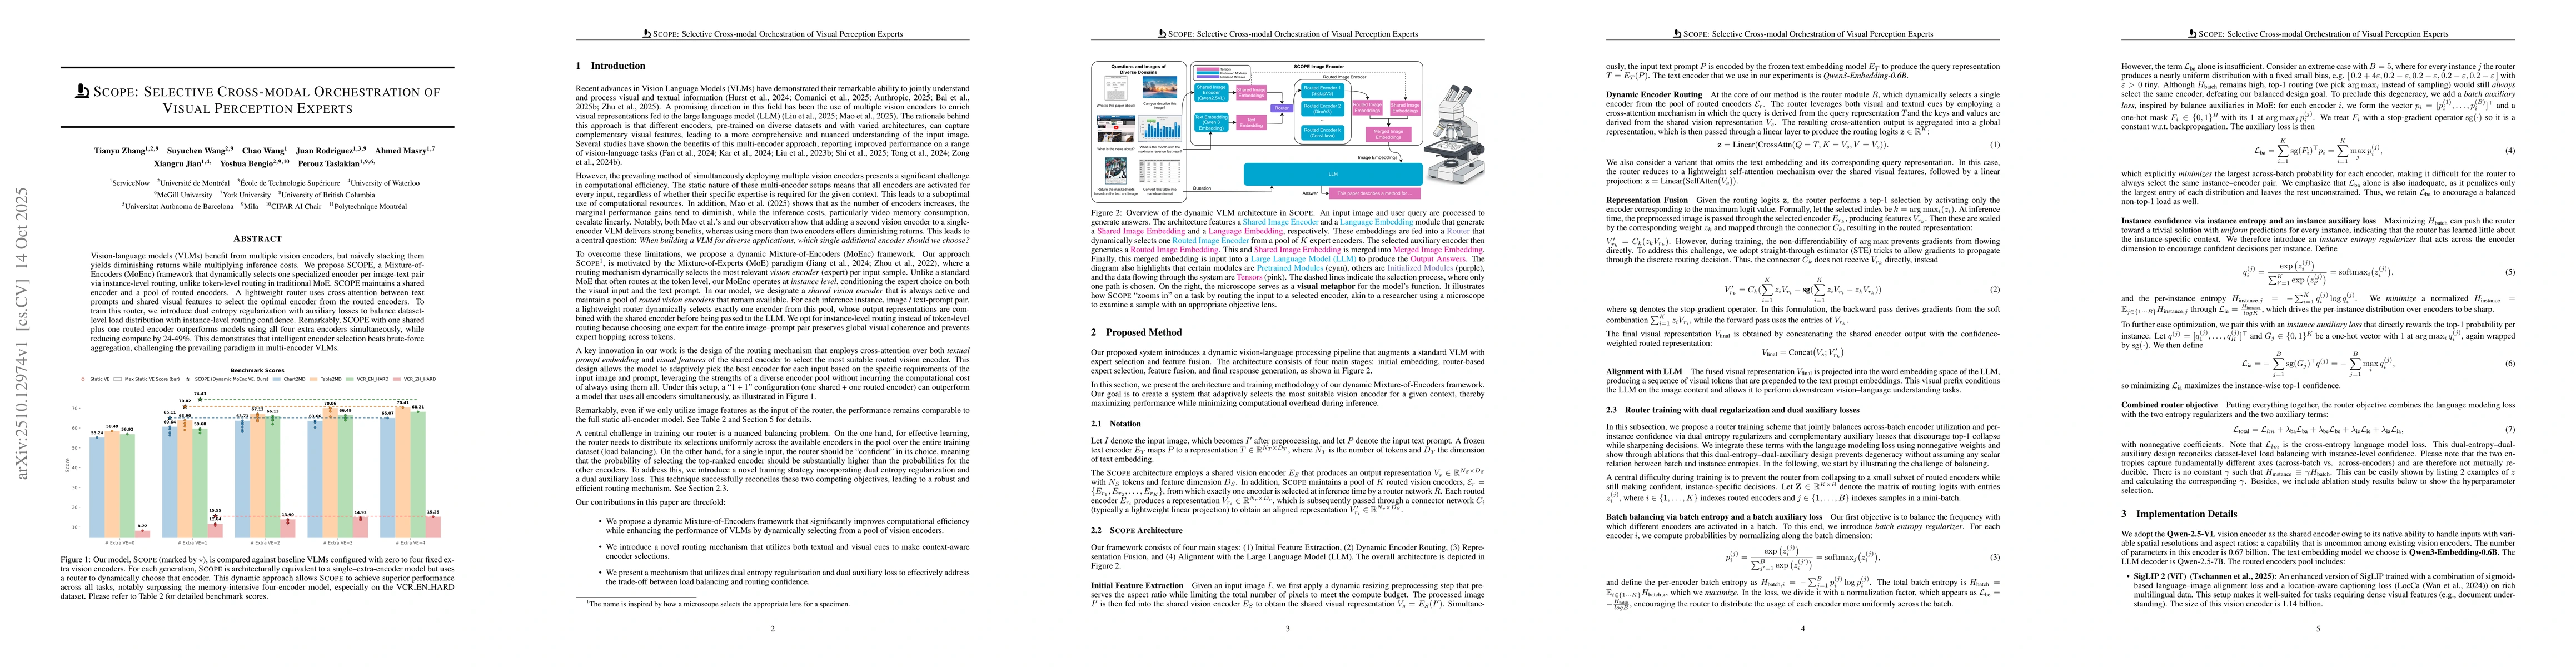
Vision-language models (VLMs) benefit from multiple vision encoders, but naively stacking them yields diminishing returns while multiplying inference costs. We propose SCOPE, a Mixture-of-Encoders (Mo...
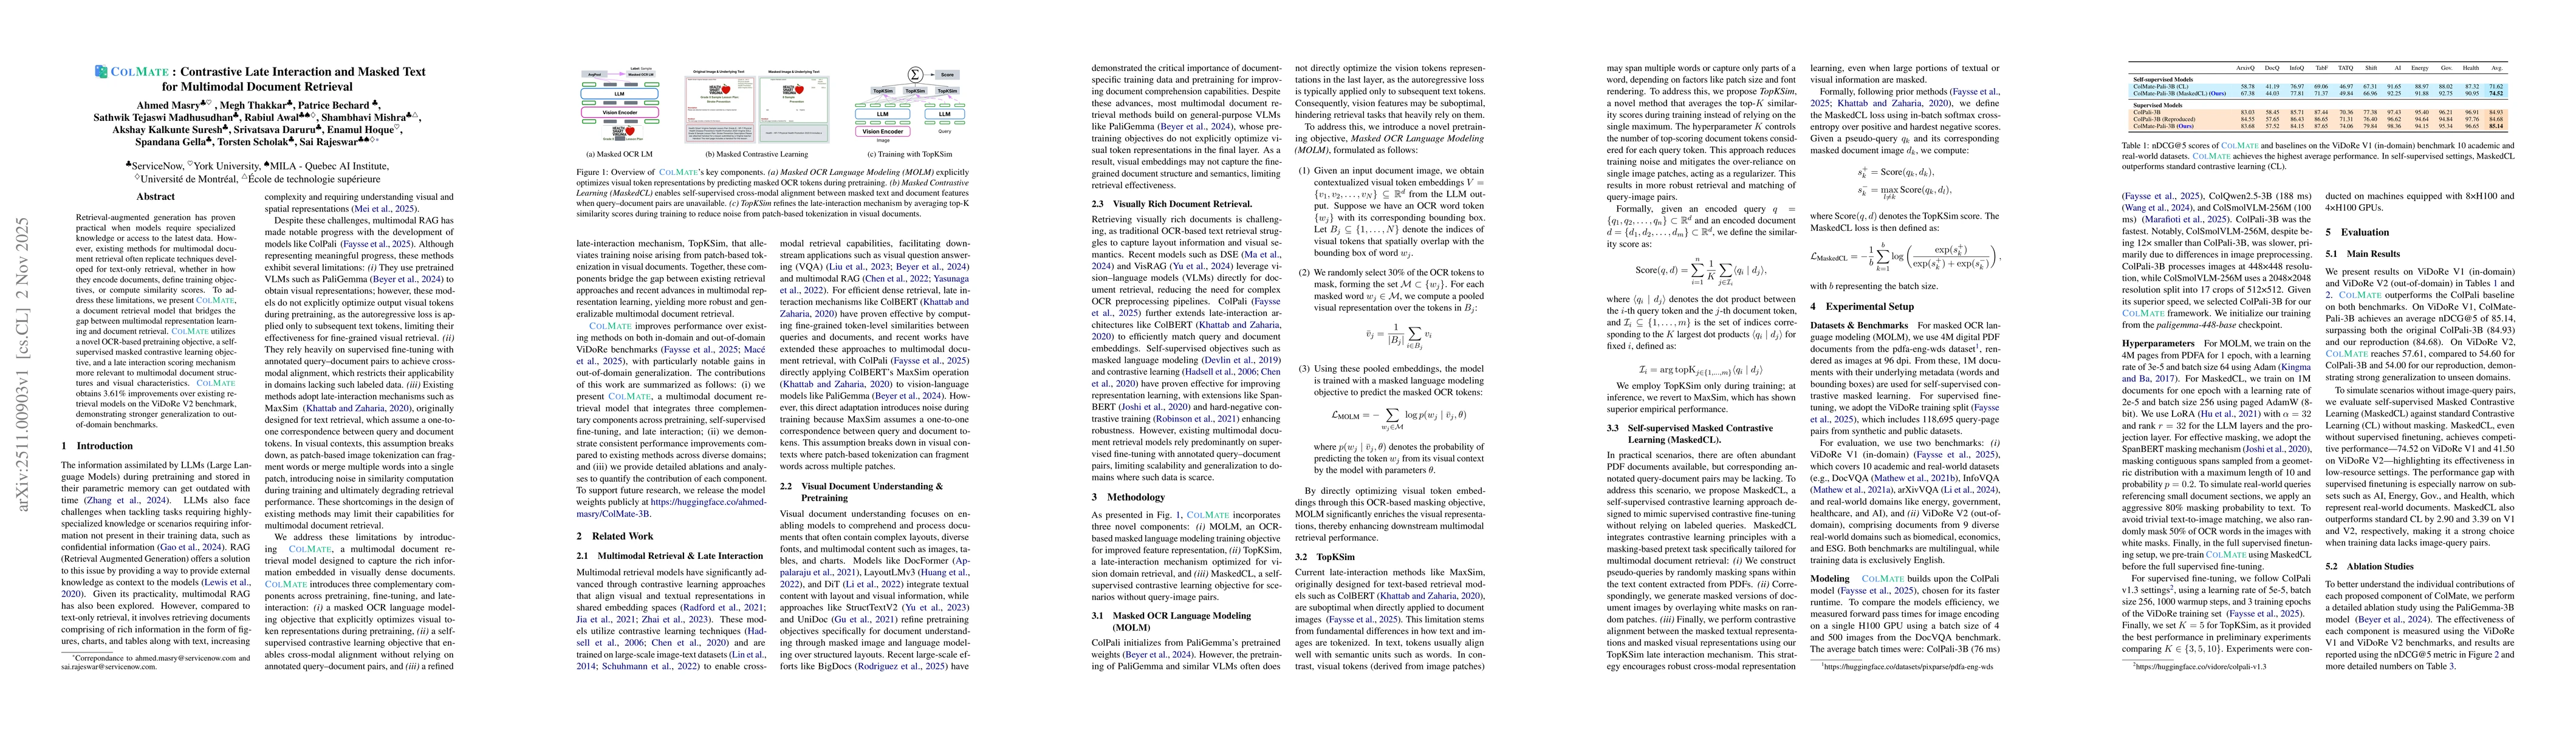
Retrieval-augmented generation has proven practical when models require specialized knowledge or access to the latest data. However, existing methods for multimodal document retrieval often replicate ...