The paper presents a systematic review of the current state-of-the-art research on Chart Question Answering (CQA), categorizing existing solutions and evaluation techniques around the CQA problem space.
Chart Question Answering: State of the Art and Future Directions
Publication
Metrics
AI Quick Summary
This paper surveys the current state-of-the-art in Chart Question Answering (CQA), reviewing methodologies, inputs, outputs, and evaluation techniques, while also identifying open challenges and future research directions in the field.
Quick Answers
What is "Chart Question Answering: State of the Art and Future Directions" about?
This paper surveys the current state-of-the-art in Chart Question Answering (CQA), reviewing methodologies, inputs, outputs, and evaluation techniques, while also identifying open challenges and future research directions in the field.
What methodology did the authors use?
The paper presents a systematic review of the current state-of-the-art research on Chart Question Answering (CQA), categorizing existing solutions and evaluation techniques around the CQA problem space. More in Methodology →
What are the key results?
A taxonomy is identified, covering various dimensions of the CQA problem, including possible inputs and outputs. — The paper discusses the advantages and limitations of proposed CQA solutions. More in Key Results →
Why is this work significant?
This research is significant as it provides a comprehensive overview of CQA, highlighting gaps and future opportunities in the intersection of information visualization and AI. More in Significance →
What are the main limitations?
Existing CQA datasets mainly offer template-based questions and synthetically plotted charts, lacking realism. — Most CQA systems are limited to textual answers and do not handle complex, compositional questions effectively. More in Limitations →
Abstract
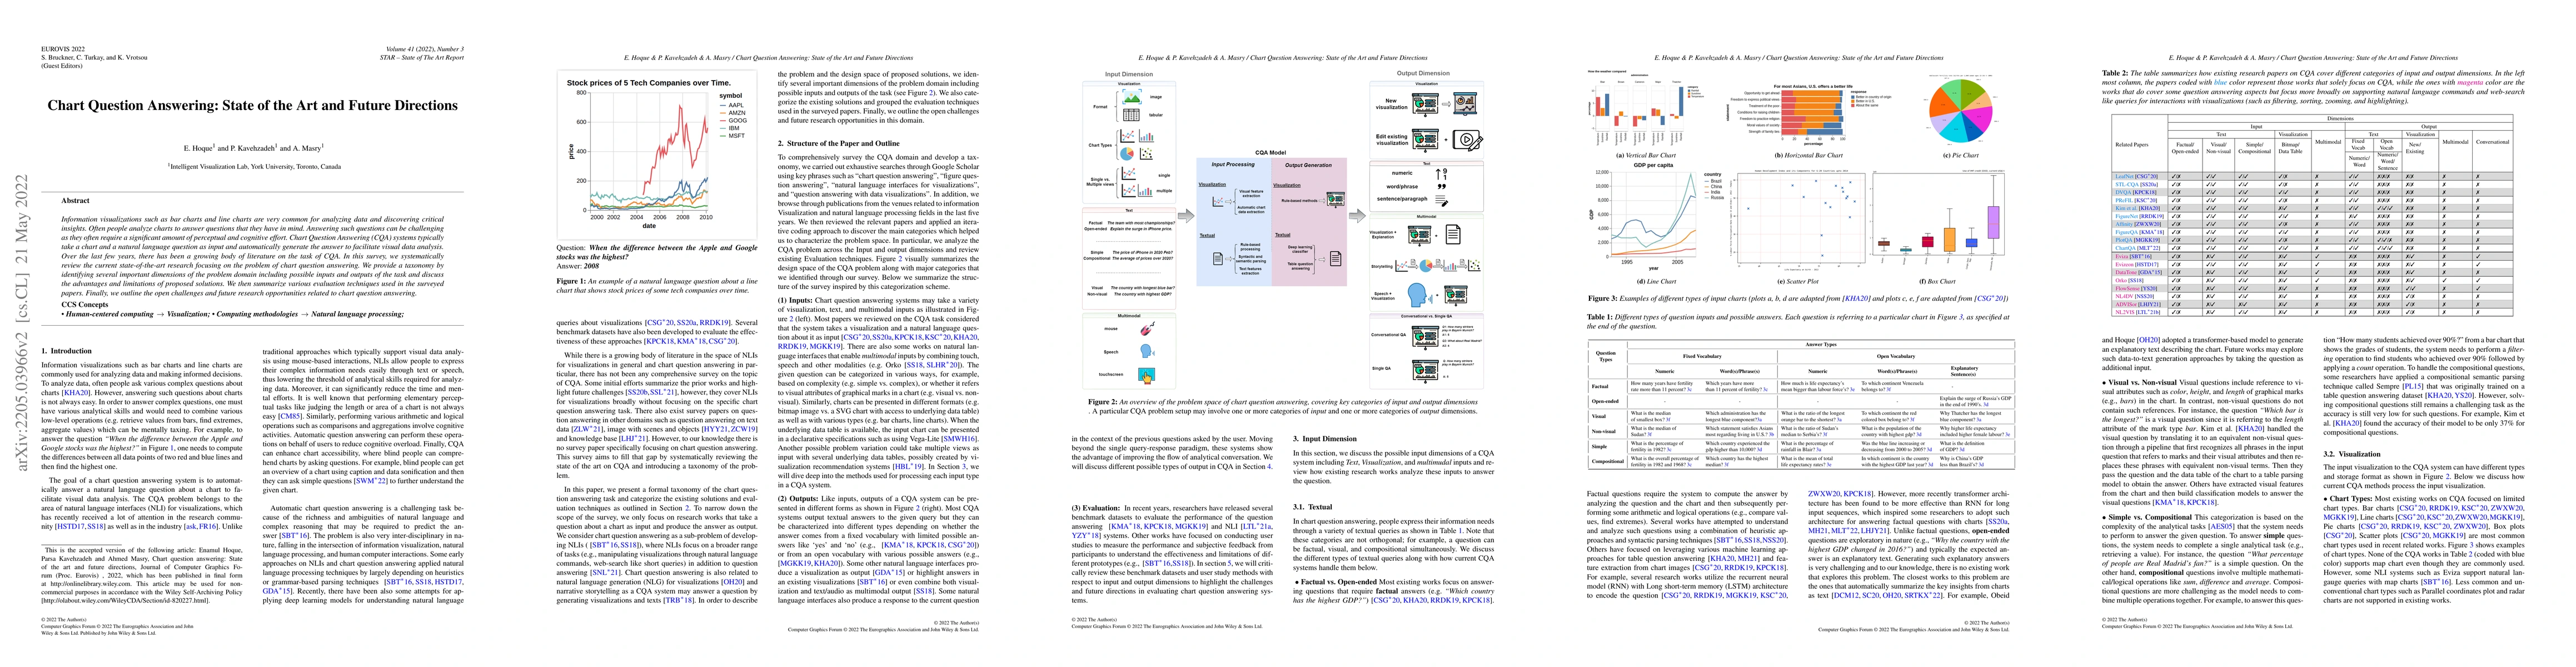
Information visualizations such as bar charts and line charts are very common for analyzing data and discovering critical insights. Often people analyze charts to answer questions that they have in mind. Answering such questions can be challenging as they often require a significant amount of perceptual and cognitive effort. Chart Question Answering (CQA) systems typically take a chart and a natural language question as input and automatically generate the answer to facilitate visual data analysis. Over the last few years, there has been a growing body of literature on the task of CQA. In this survey, we systematically review the current state-of-the-art research focusing on the problem of chart question answering. We provide a taxonomy by identifying several important dimensions of the problem domain including possible inputs and outputs of the task and discuss the advantages and limitations of proposed solutions. We then summarize various evaluation techniques used in the surveyed papers. Finally, we outline the open challenges and future research opportunities related to chart question answering.
Key Findings, in focus
Seven facets of this paper, analysed and brought into focus by AI.
This research is significant as it provides a comprehensive overview of CQA, highlighting gaps and future opportunities in the intersection of information visualization and AI.
- A taxonomy is identified, covering various dimensions of the CQA problem, including possible inputs and outputs.
- The paper discusses the advantages and limitations of proposed CQA solutions.
This research is significant as it provides a comprehensive overview of CQA, highlighting gaps and future opportunities in the intersection of information visualization and AI.
The paper contributes by presenting a formal taxonomy for the CQA task and categorizing existing solutions and evaluation techniques.
This work stands out by systematically reviewing and identifying major gaps in current literature, providing a roadmap for future research in CQA.
- Existing CQA datasets mainly offer template-based questions and synthetically plotted charts, lacking realism.
- Most CQA systems are limited to textual answers and do not handle complex, compositional questions effectively.
- Develop human-authored questions and real-world chart sources with diverse chart types and visual styles.
- Leverage advanced deep learning models to effectively combine visual features and data values of a chart into a unified representation.
Impact
Paper Details
Authors
PDF Preview
Key Terms
Citation Network
Current paper (gray), citations (green), references (blue)
Display is limited for performance on very large graphs.
Discussion 0