Academic Profile
Statistics
Similar Authors
Papers on arXiv
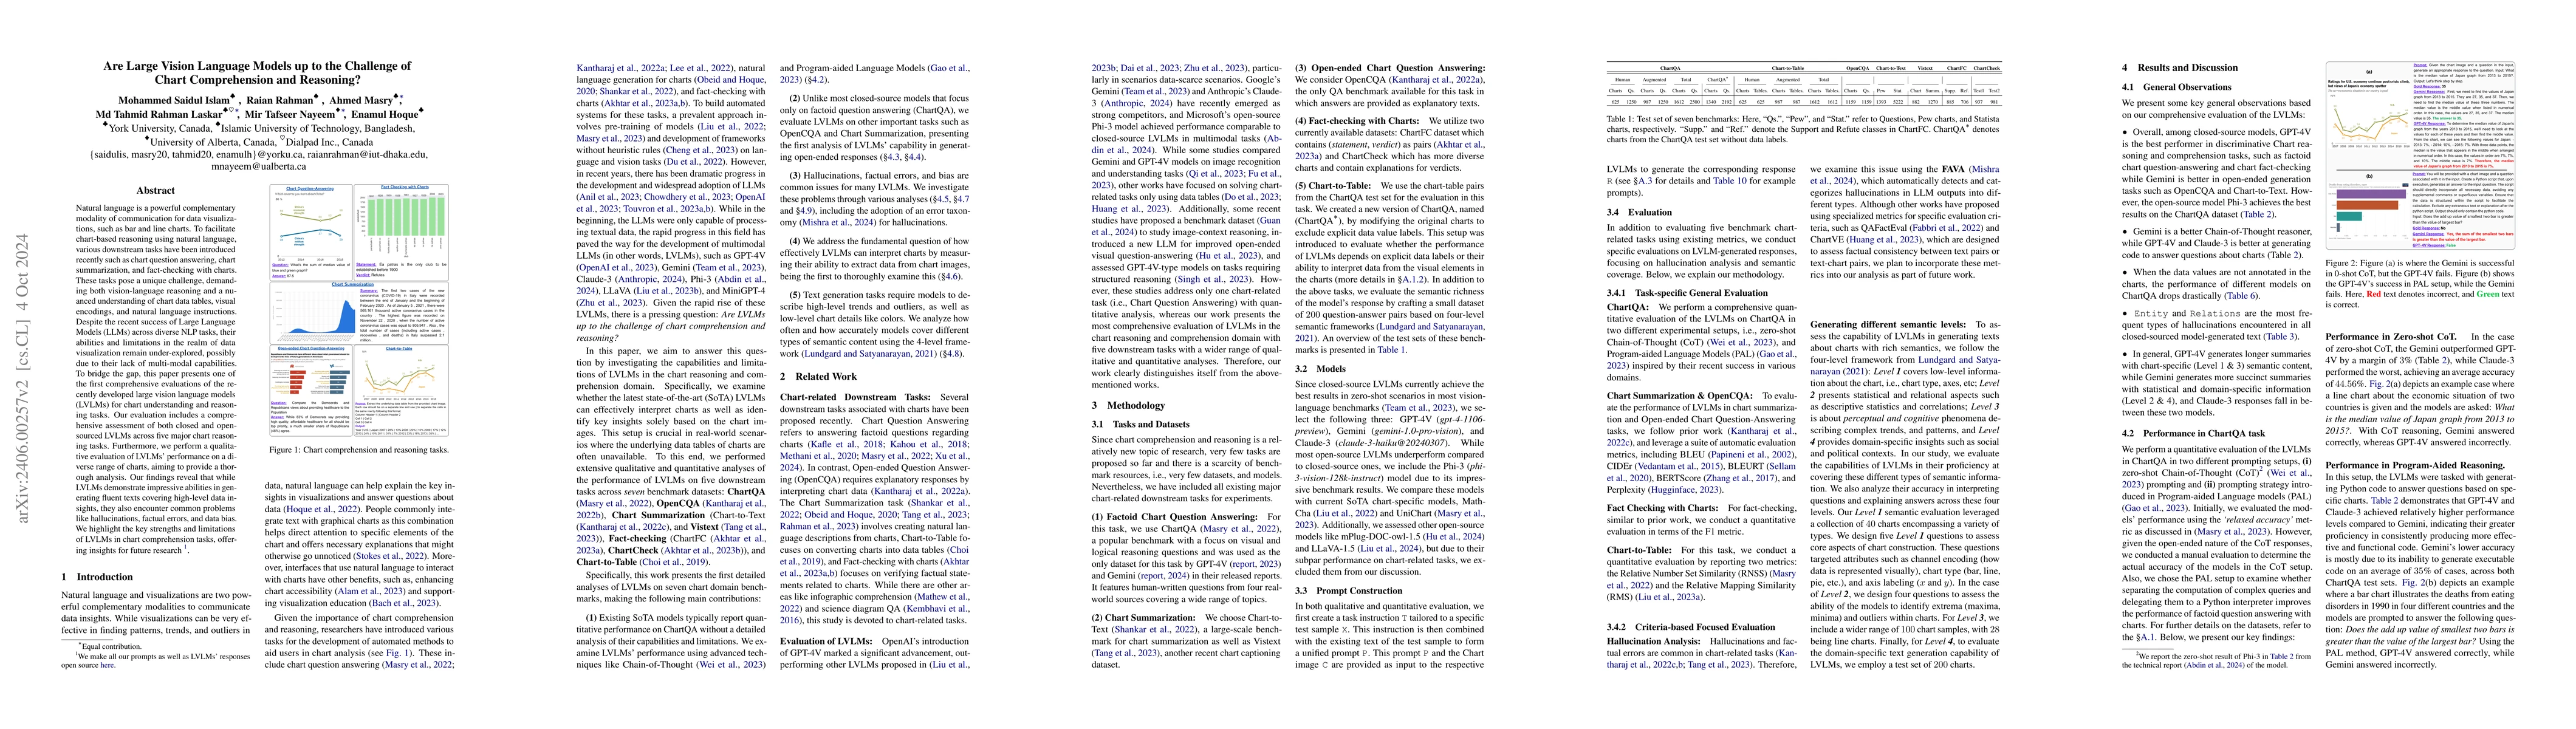
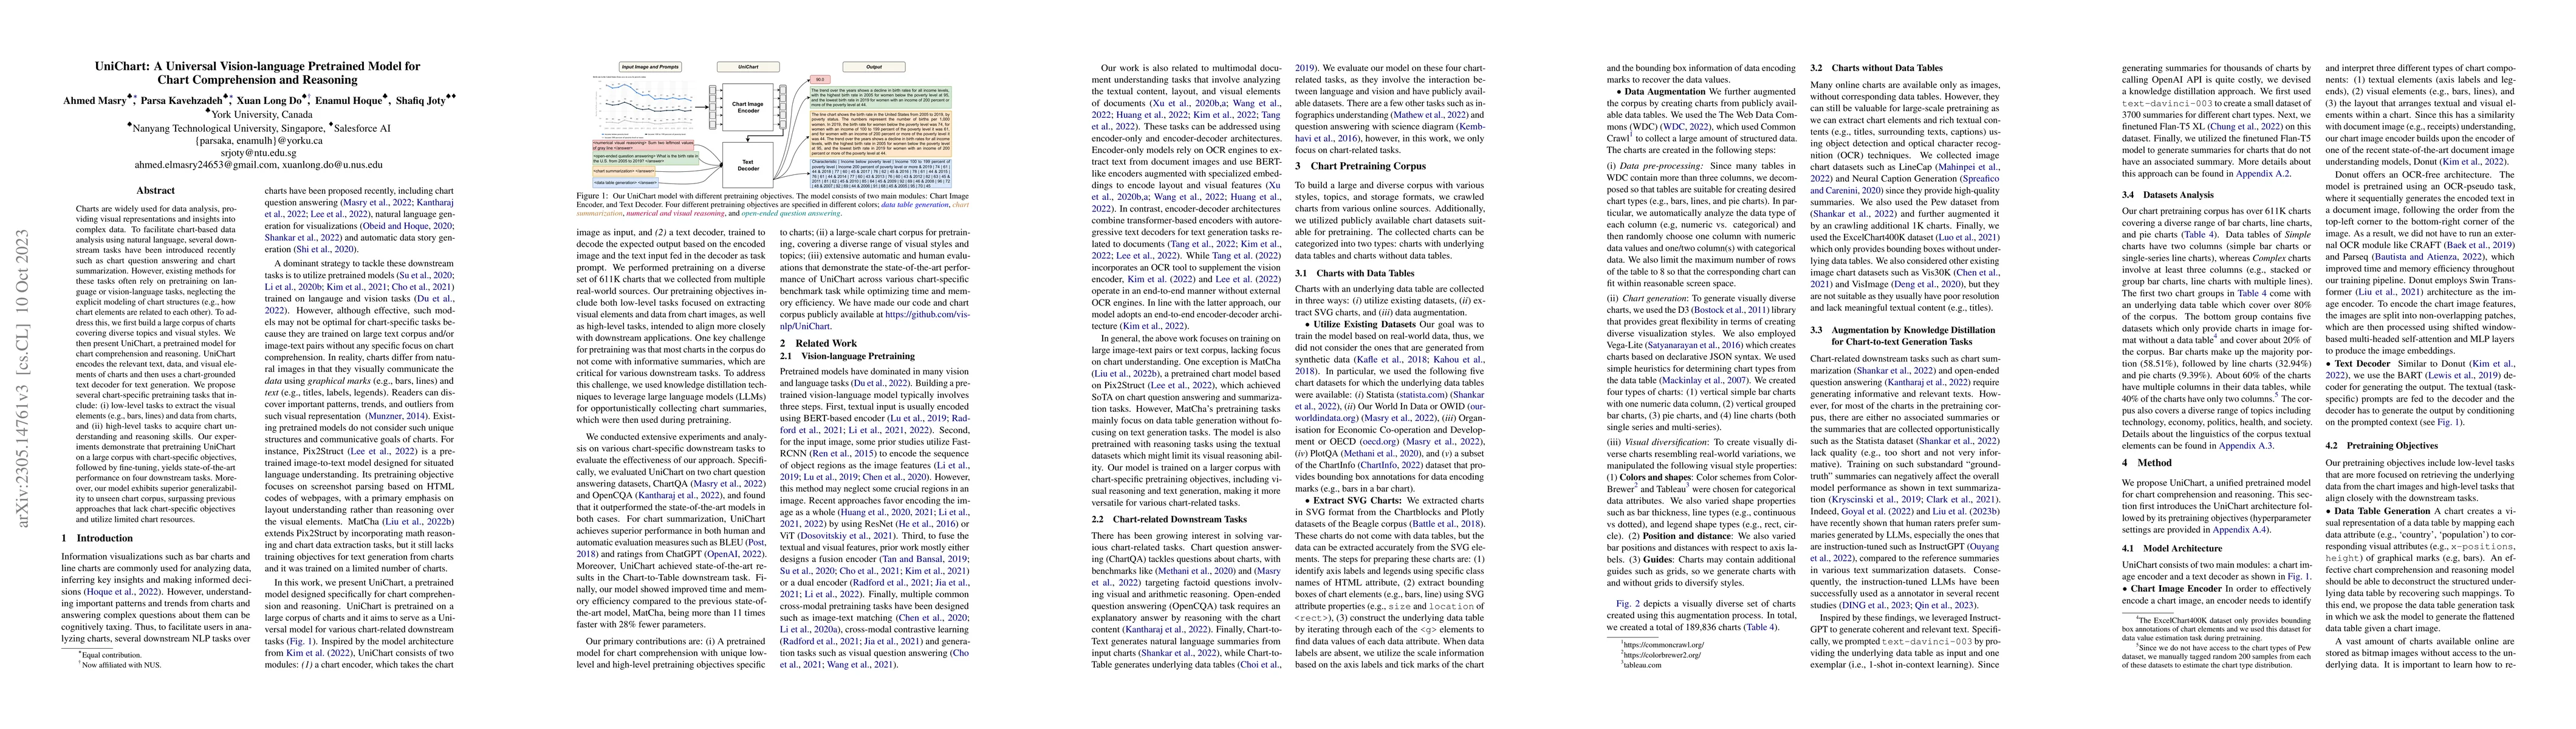
Natural language is a powerful complementary modality of communication for data visualizations, such as bar and line charts. To facilitate chart-based reasoning using natural language, various downs...
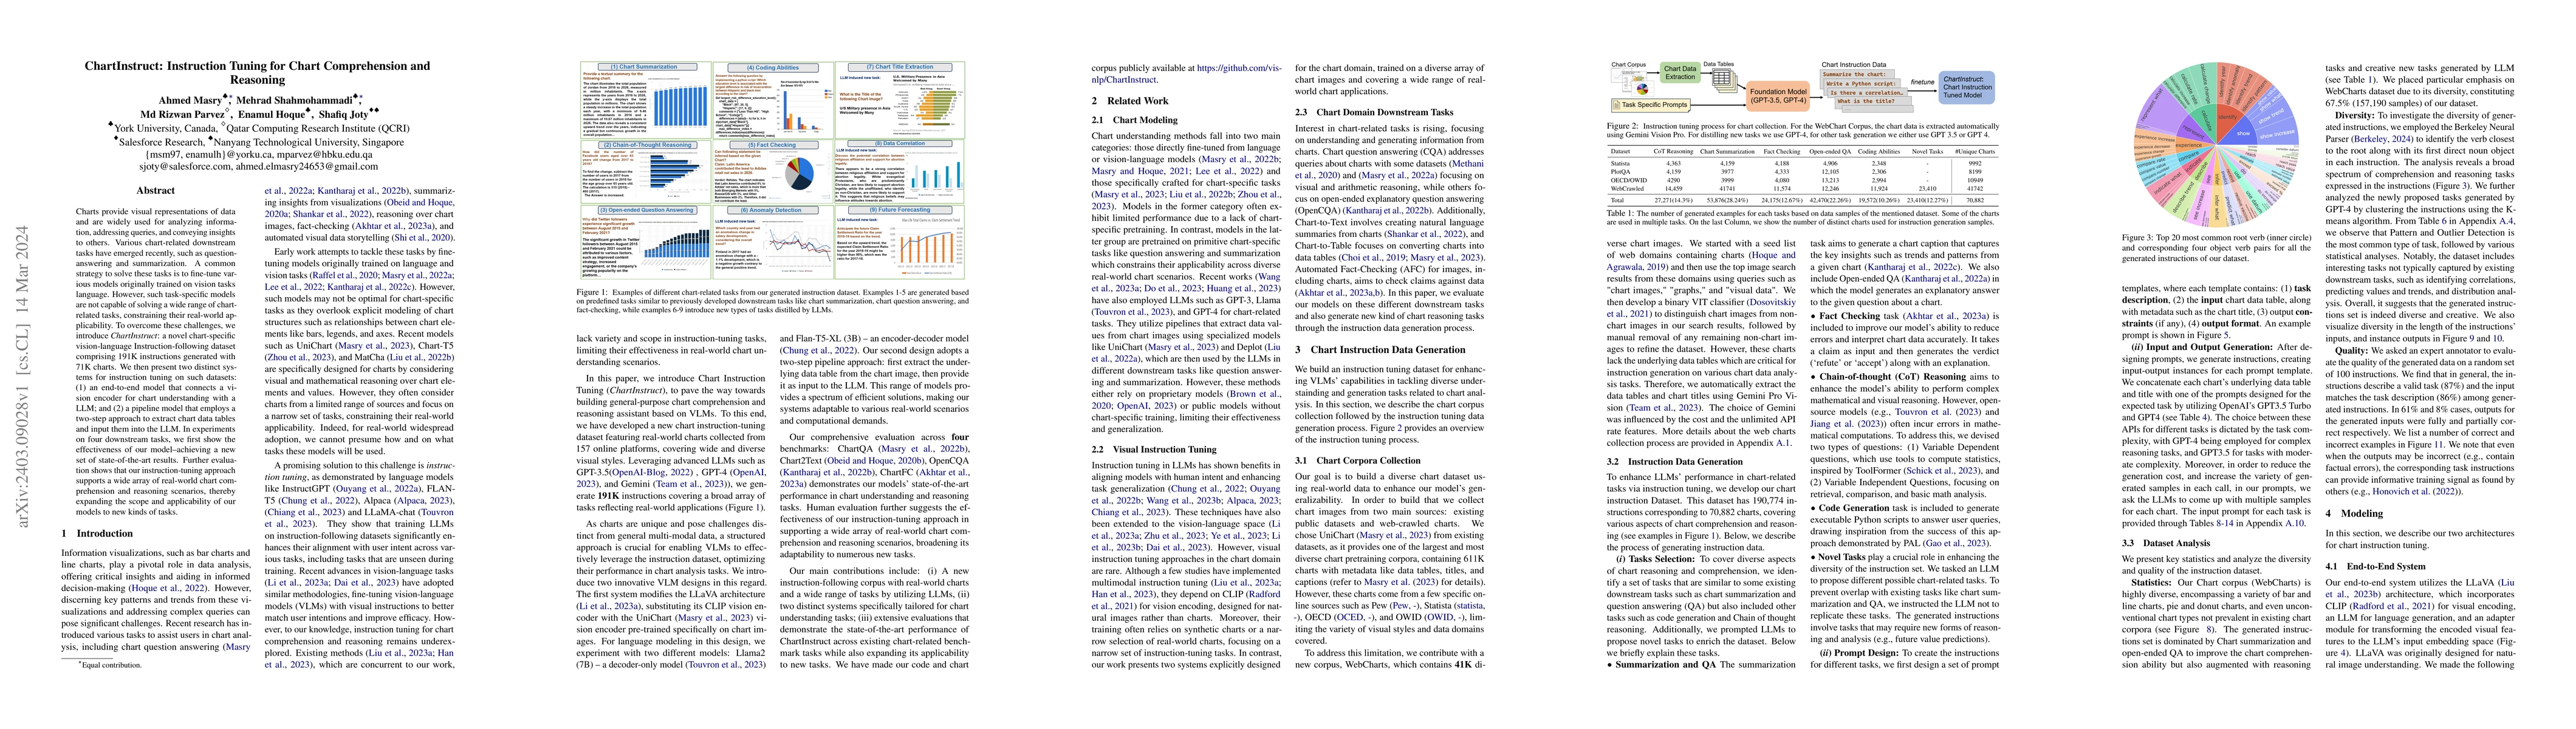
Charts provide visual representations of data and are widely used for analyzing information, addressing queries, and conveying insights to others. Various chart-related downstream tasks have emerged...
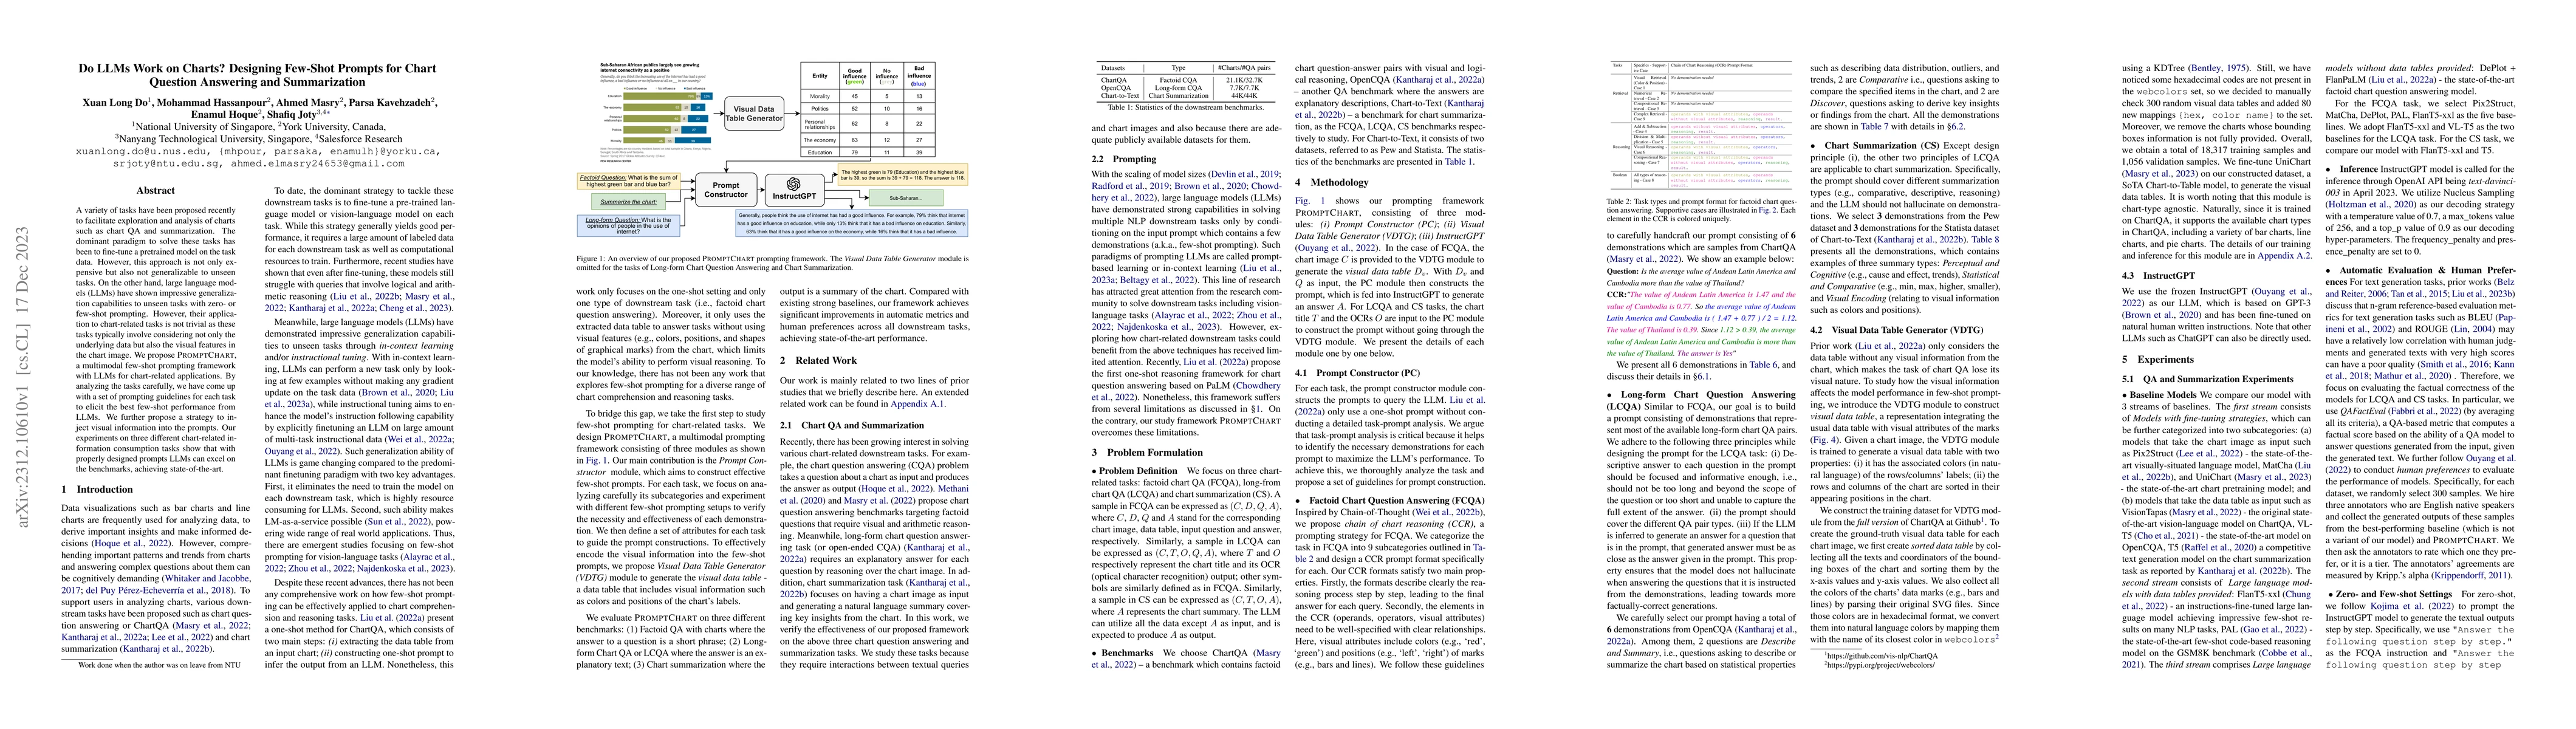
A number of tasks have been proposed recently to facilitate easy access to charts such as chart QA and summarization. The dominant paradigm to solve these tasks has been to fine-tune a pretrained mo...
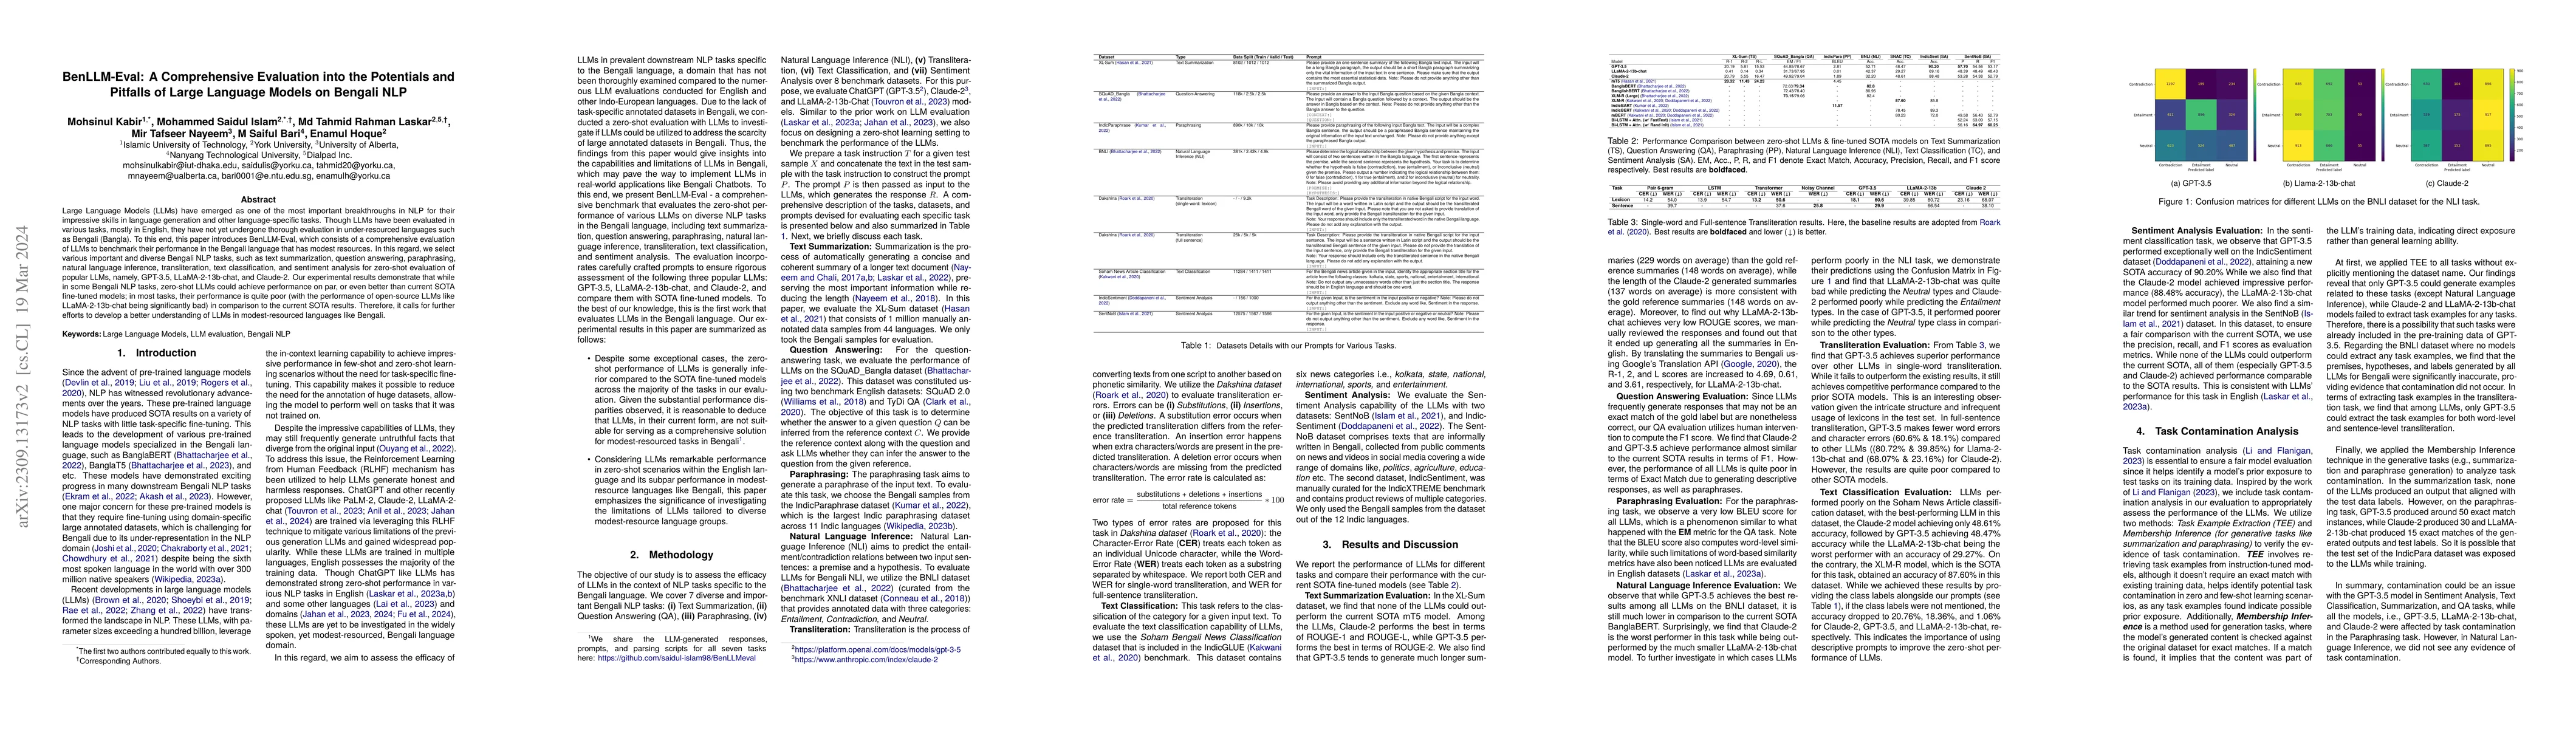
Large Language Models (LLMs) have emerged as one of the most important breakthroughs in NLP for their impressive skills in language generation and other language-specific tasks. Though LLMs have bee...
Charts are very popular for analyzing data, visualizing key insights and answering complex reasoning questions about data. To facilitate chart-based data analysis using natural language, several dow...
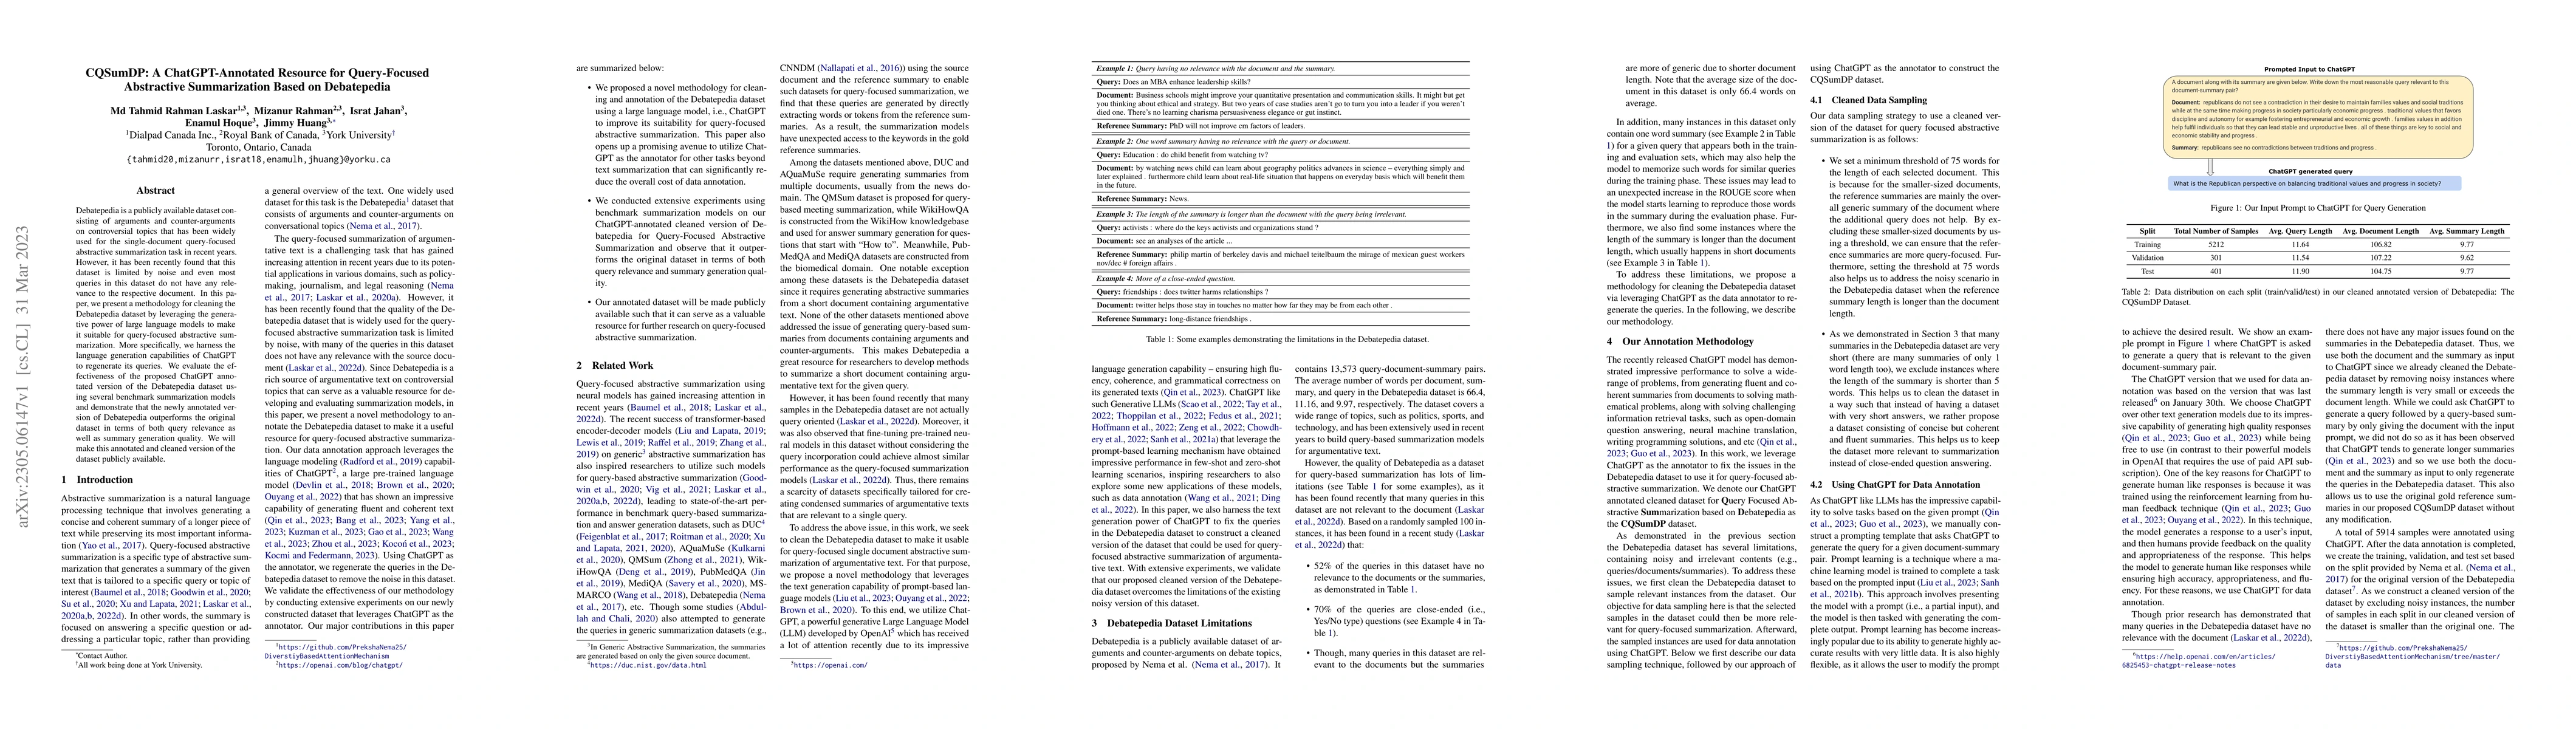
Debatepedia is a publicly available dataset consisting of arguments and counter-arguments on controversial topics that has been widely used for the single-document query-focused abstractive summariz...
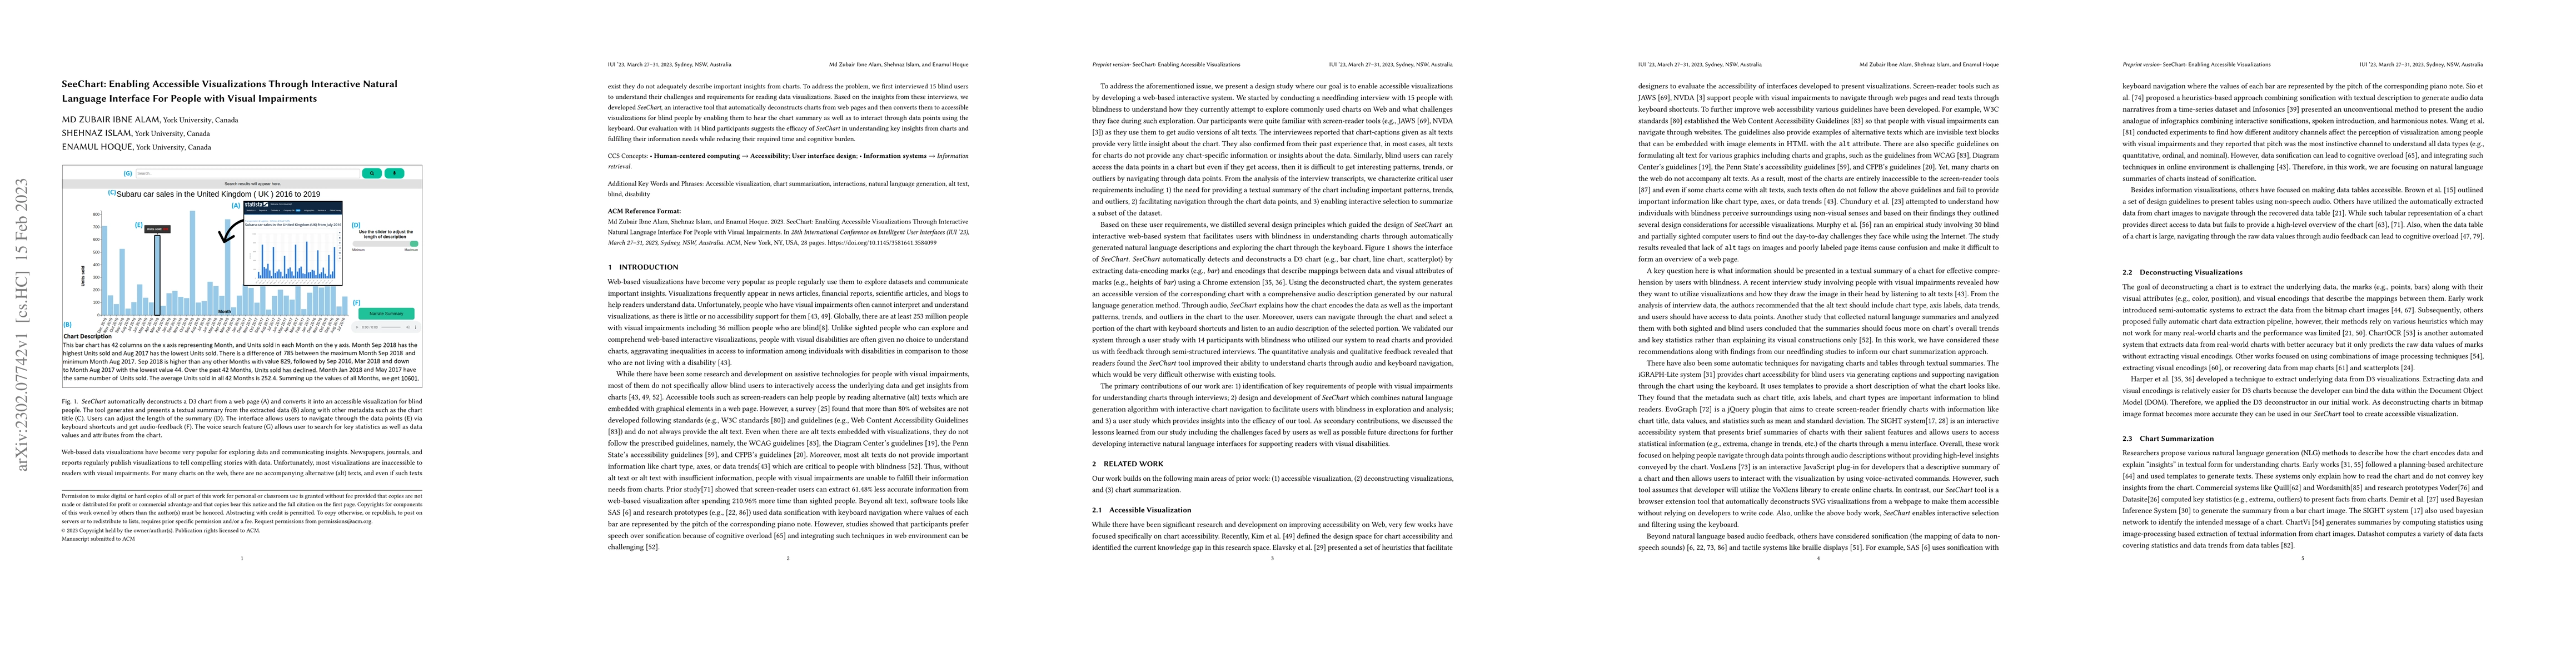
Web-based data visualizations have become very popular for exploring data and communicating insights. Newspapers, journals, and reports regularly publish visualizations to tell compelling stories wi...
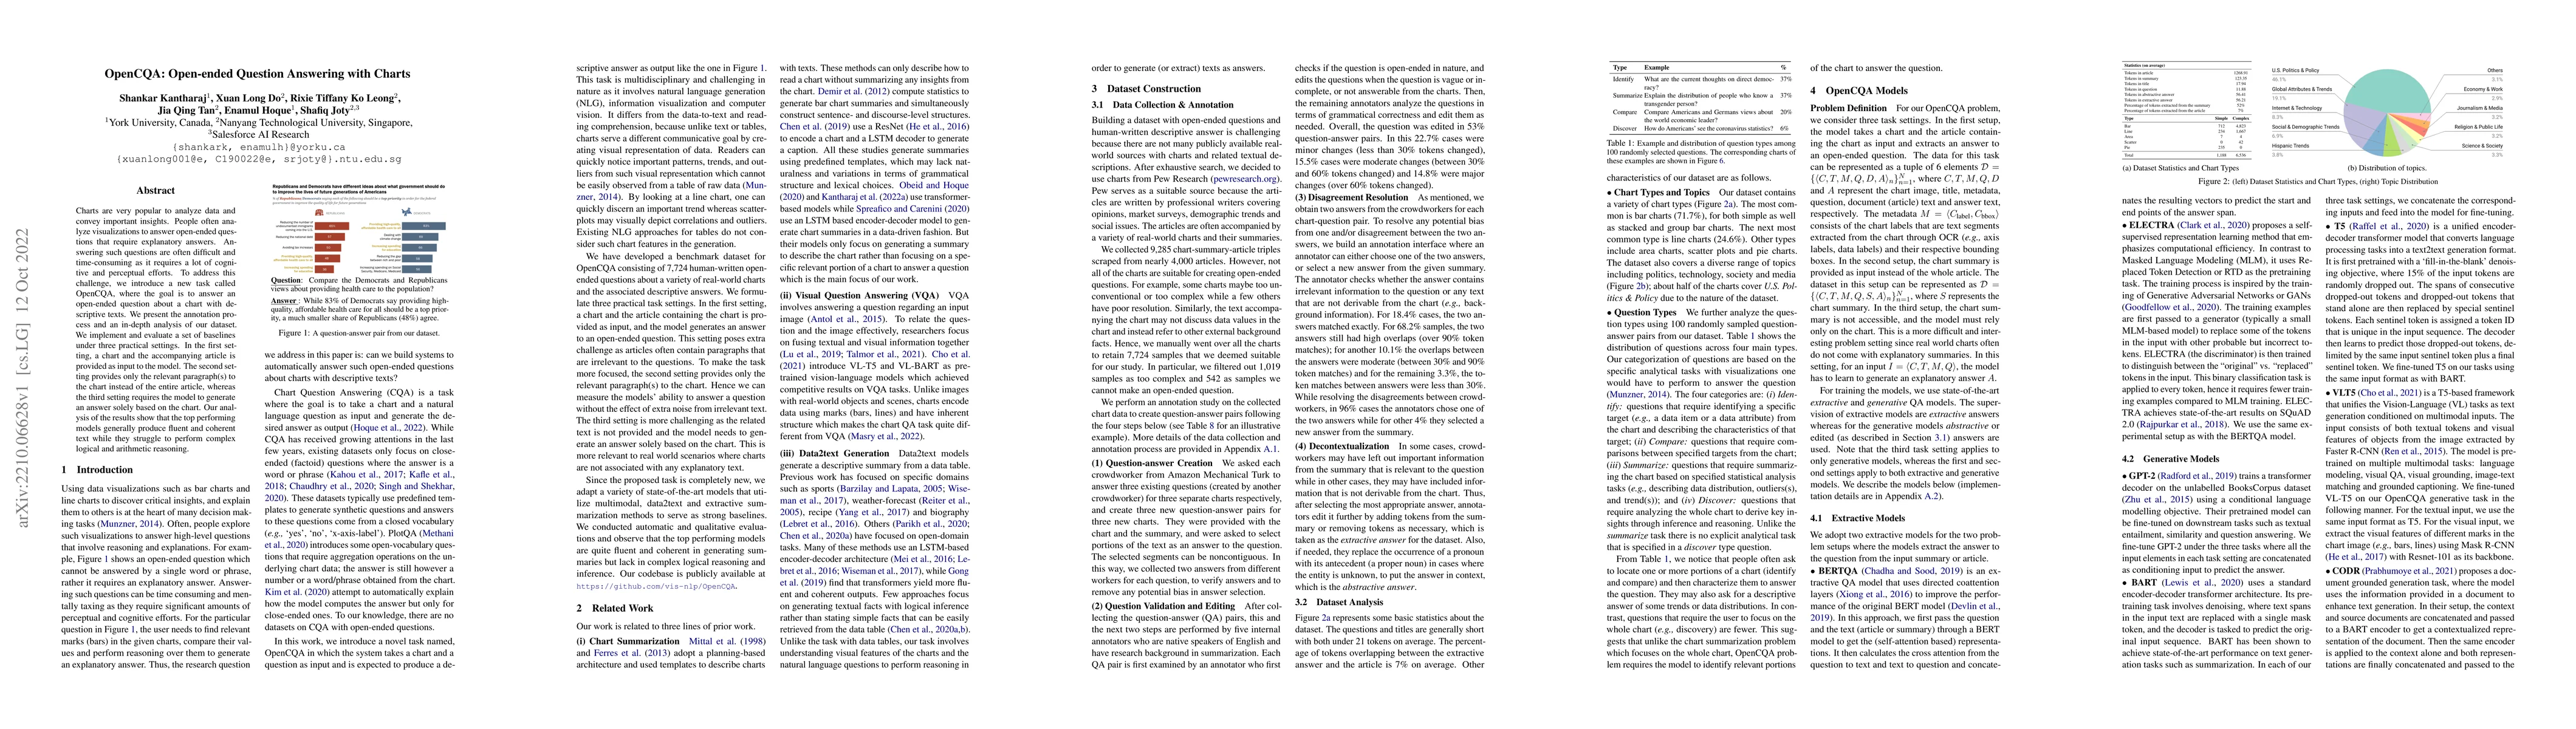
Charts are very popular to analyze data and convey important insights. People often analyze visualizations to answer open-ended questions that require explanatory answers. Answering such questions a...
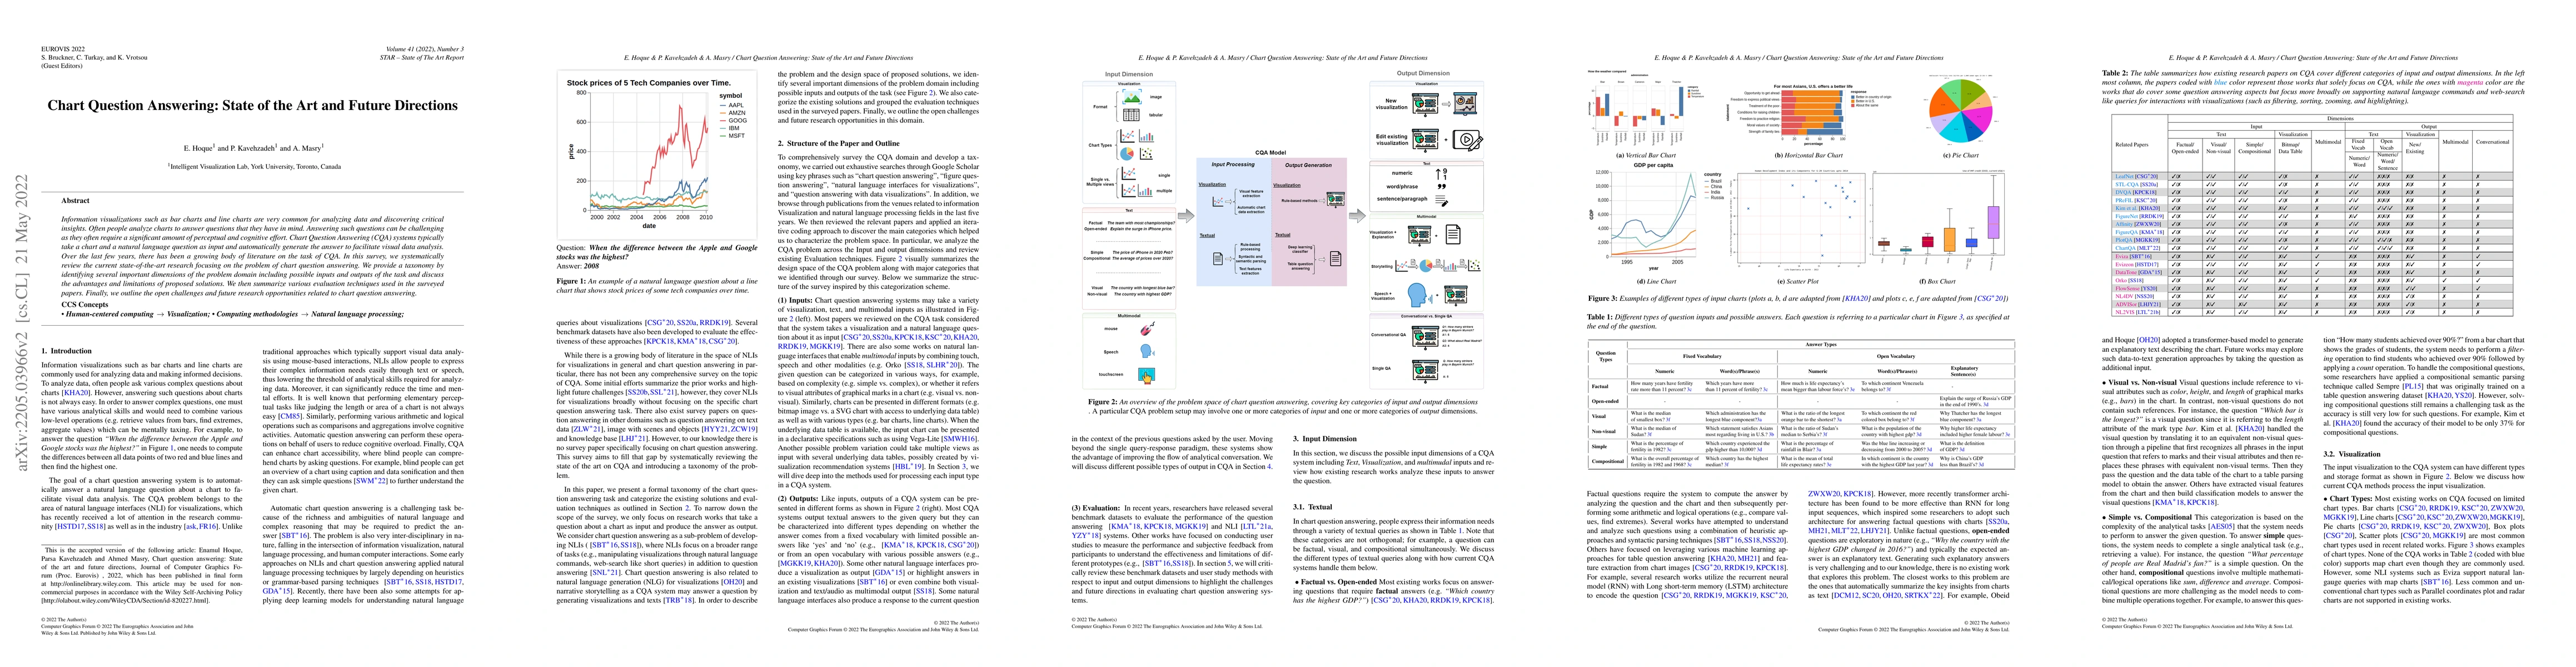
Information visualizations such as bar charts and line charts are very common for analyzing data and discovering critical insights. Often people analyze charts to answer questions that they have in ...
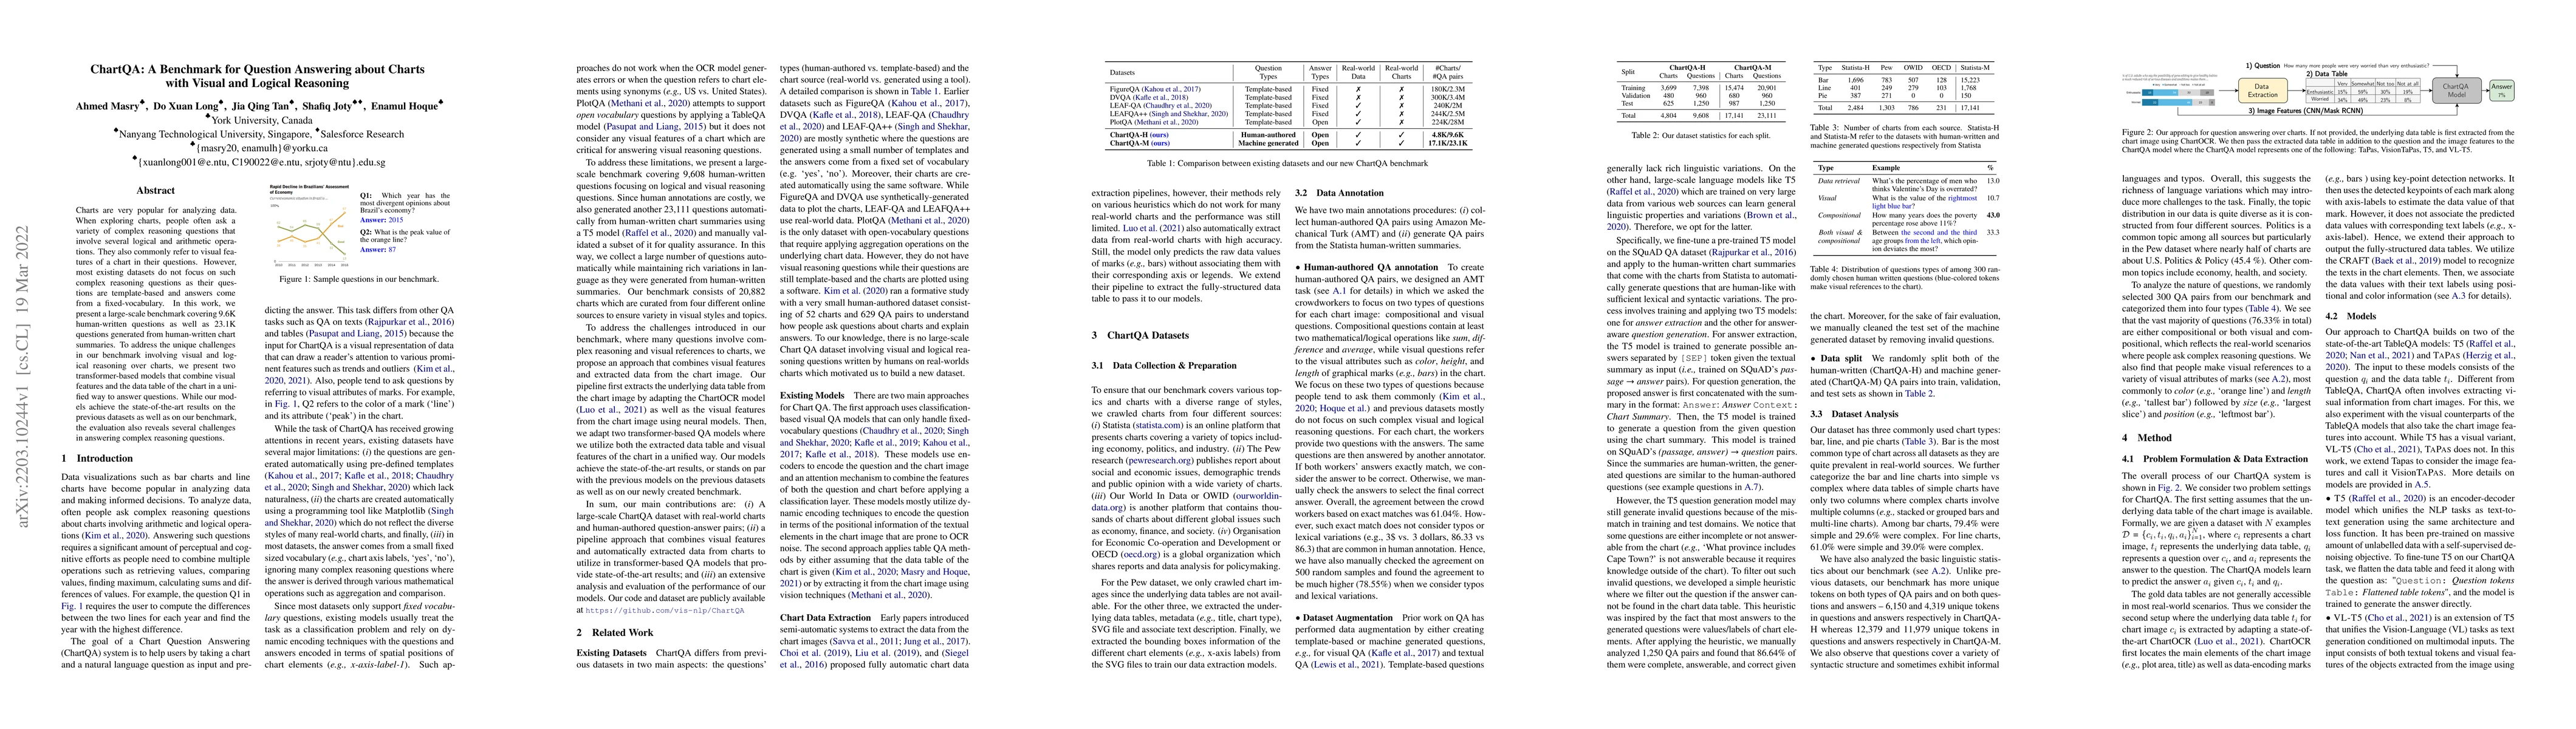
Charts are very popular for analyzing data. When exploring charts, people often ask a variety of complex reasoning questions that involve several logical and arithmetic operations. They also commonl...
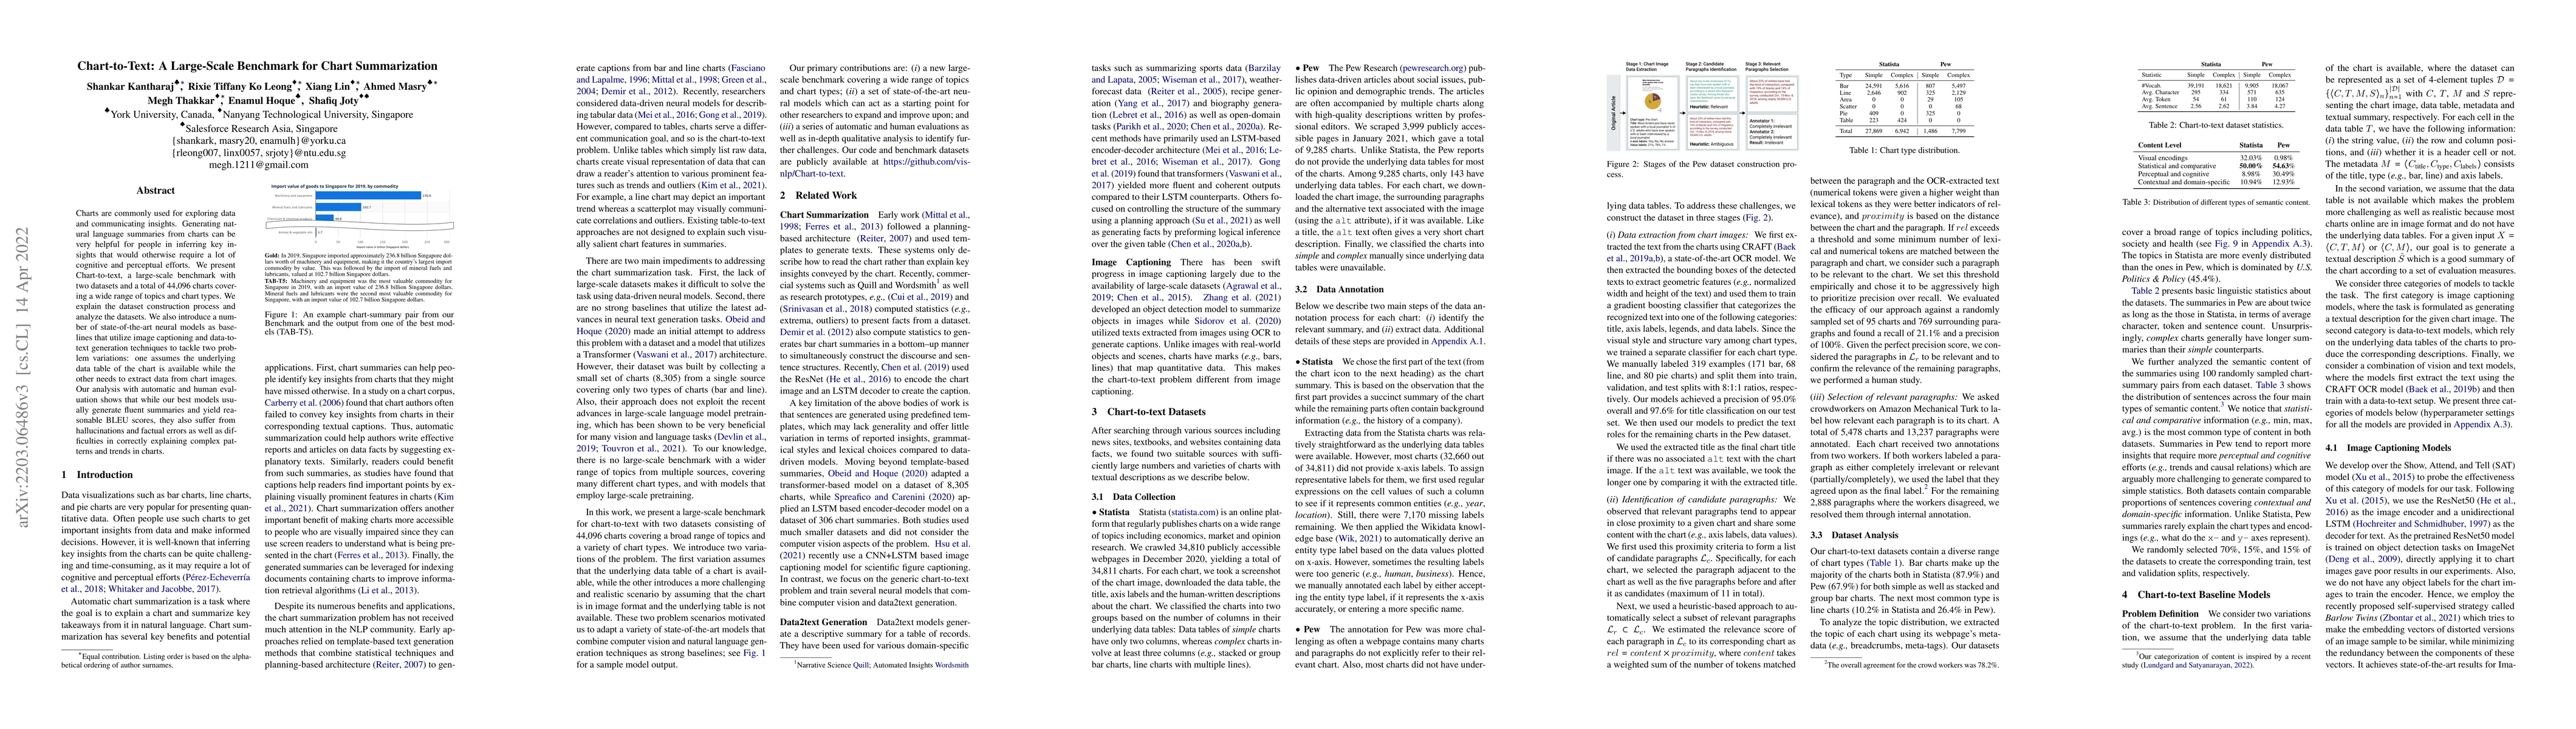
Charts are commonly used for exploring data and communicating insights. Generating natural language summaries from charts can be very helpful for people in inferring key insights that would otherwis...
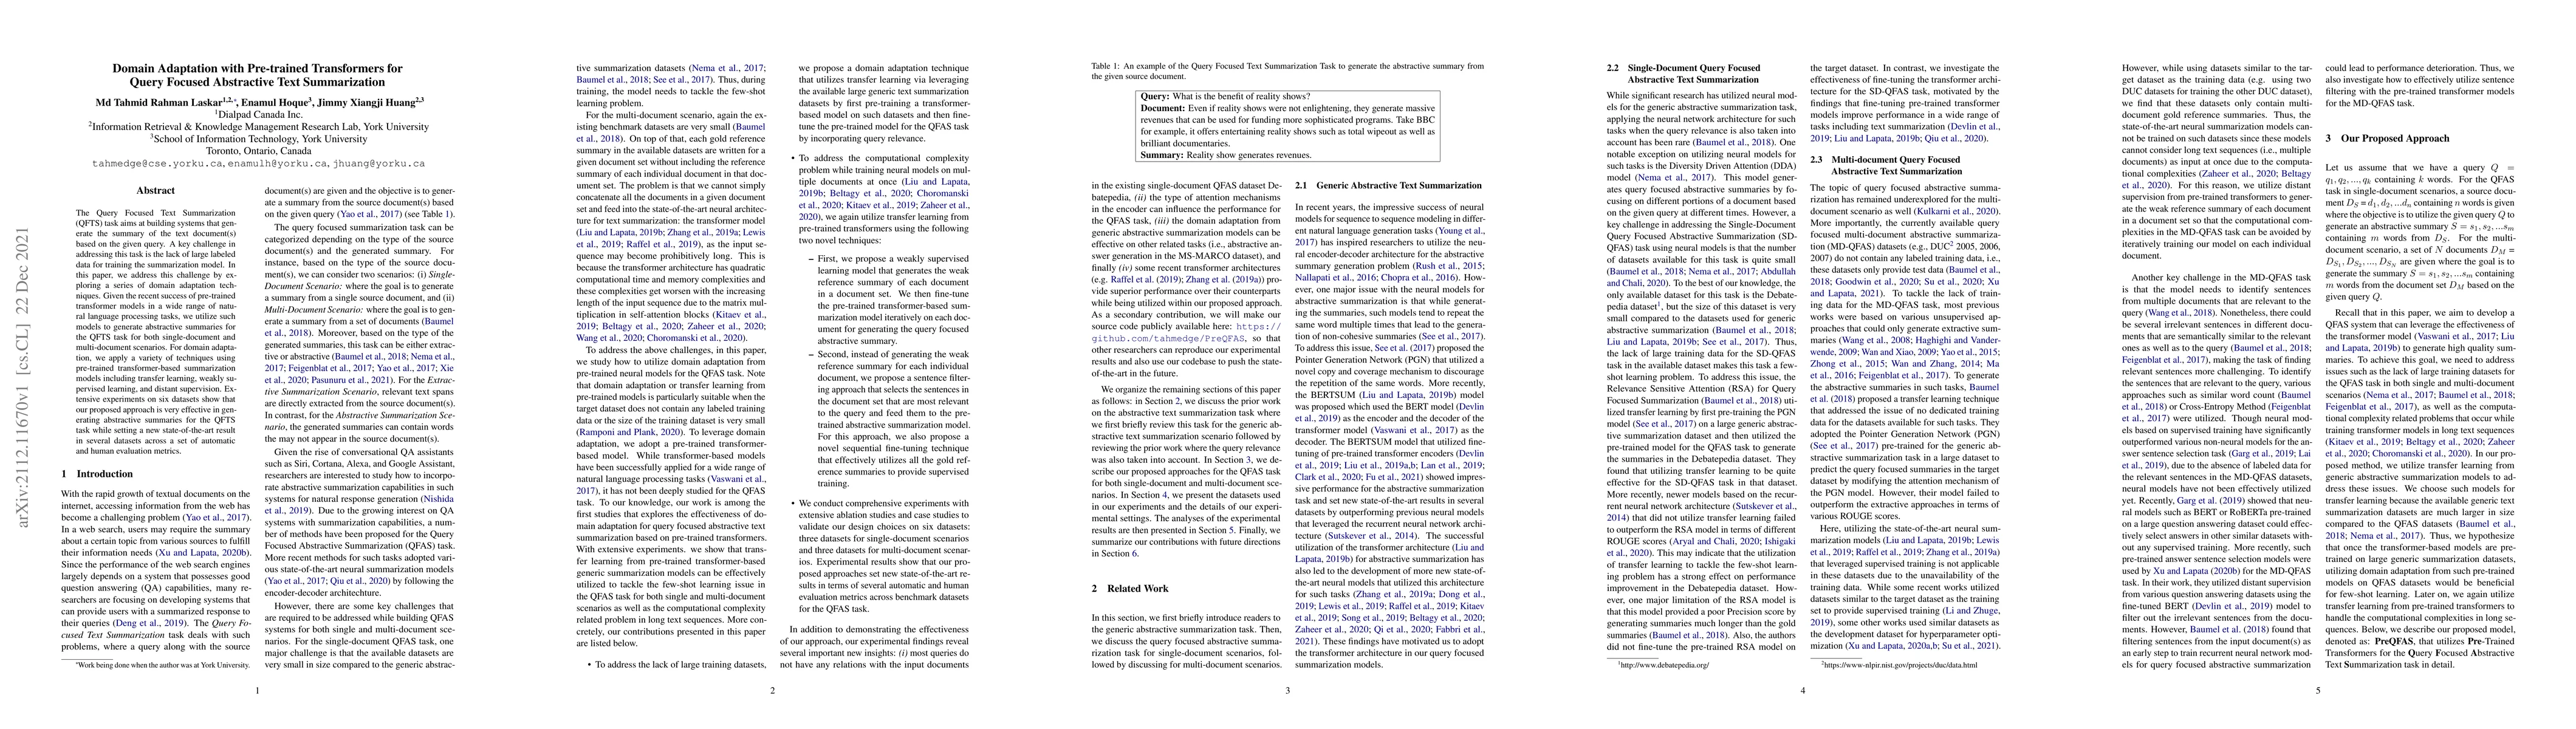
The Query Focused Text Summarization (QFTS) task aims at building systems that generate the summary of the text document(s) based on the given query. A key challenge in addressing this task is the l...
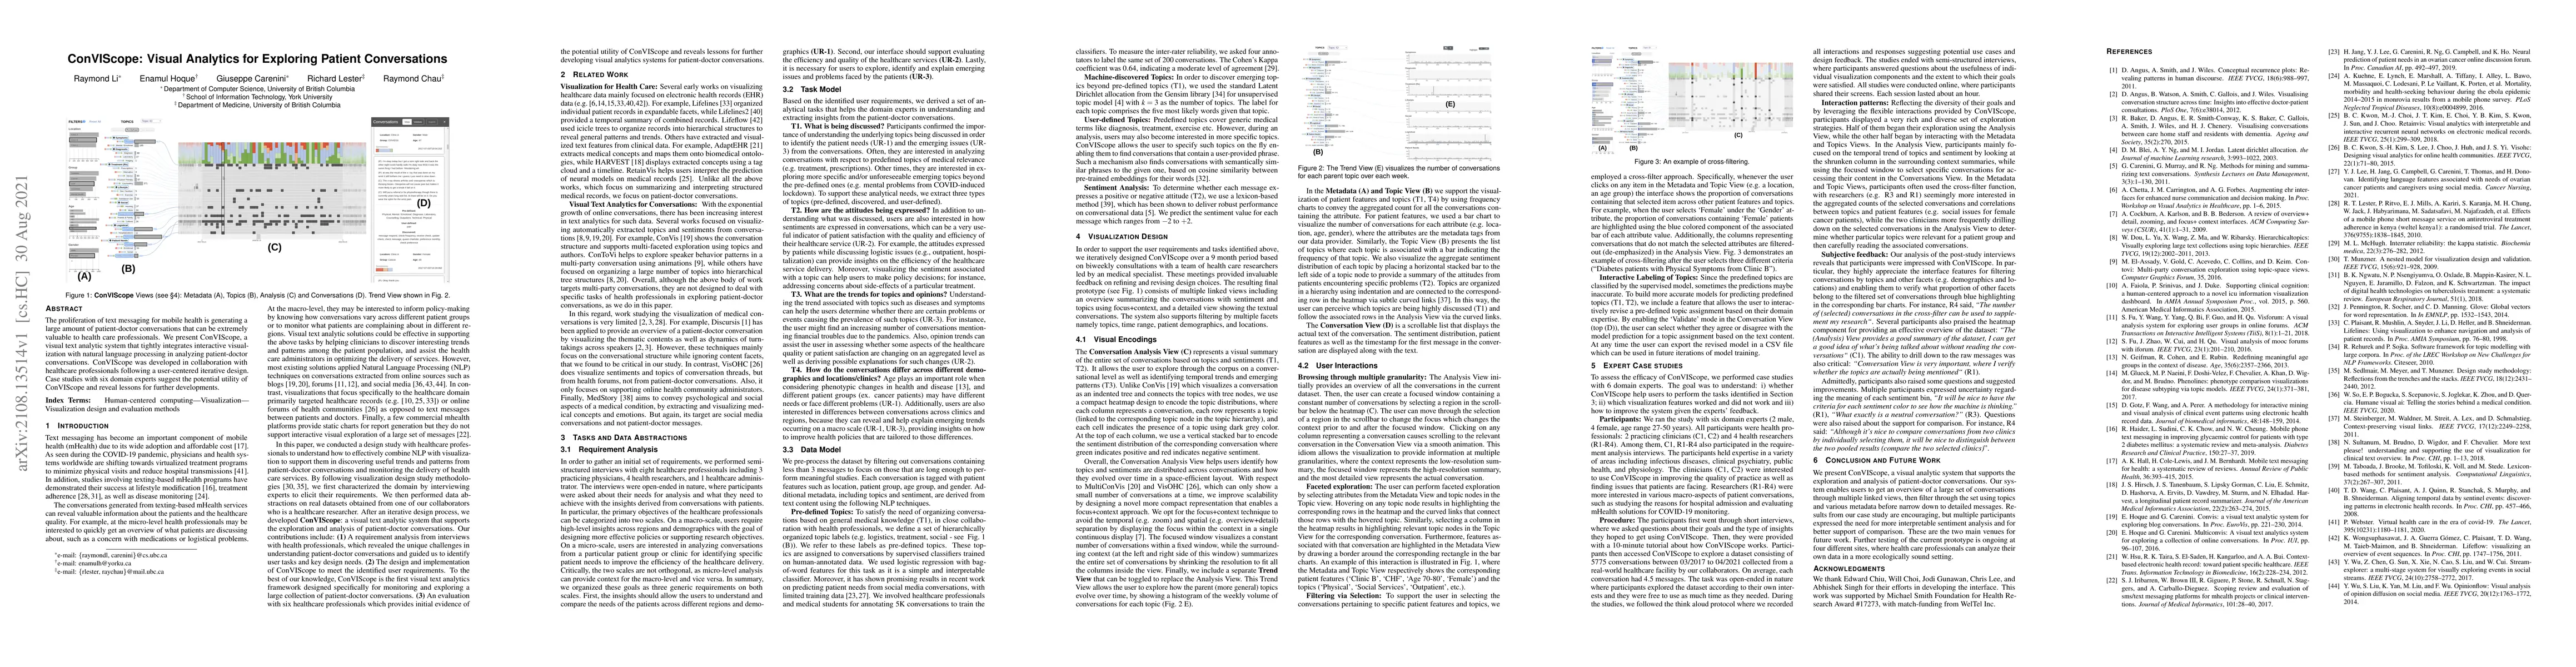
The proliferation of text messaging for mobile health is generating a large amount of patient-doctor conversations that can be extremely valuable to health care professionals. We present ConVIScope,...
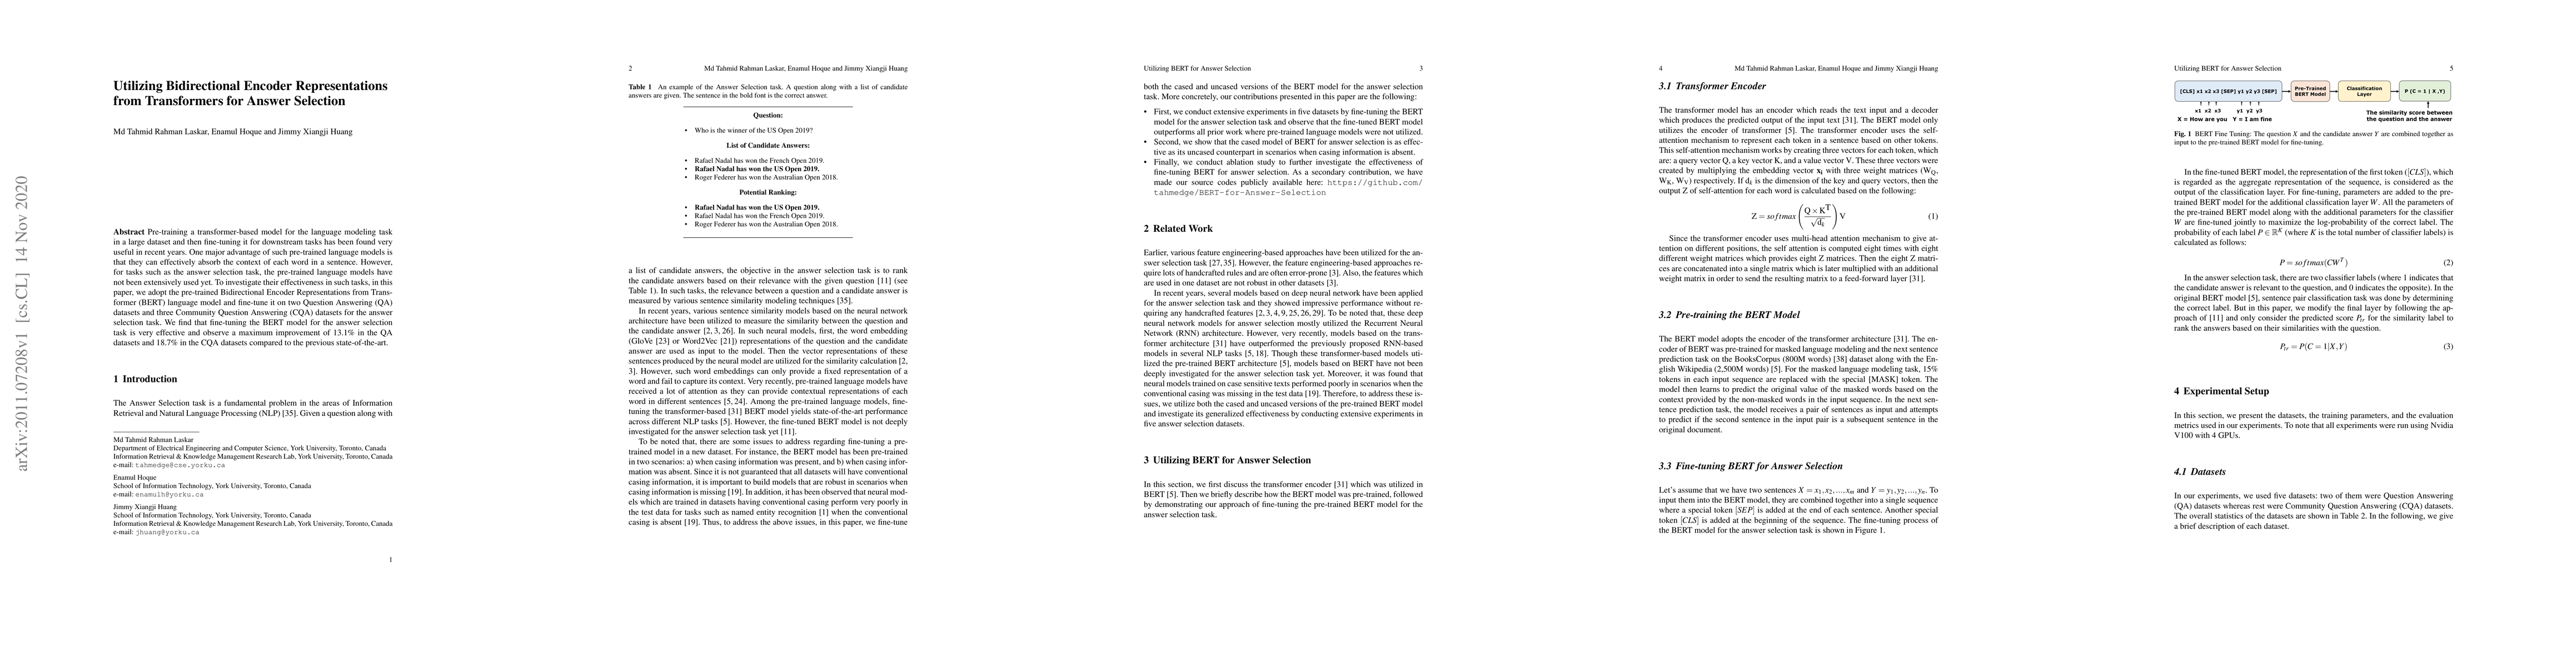
Pre-training a transformer-based model for the language modeling task in a large dataset and then fine-tuning it for downstream tasks has been found very useful in recent years. One major advantage ...
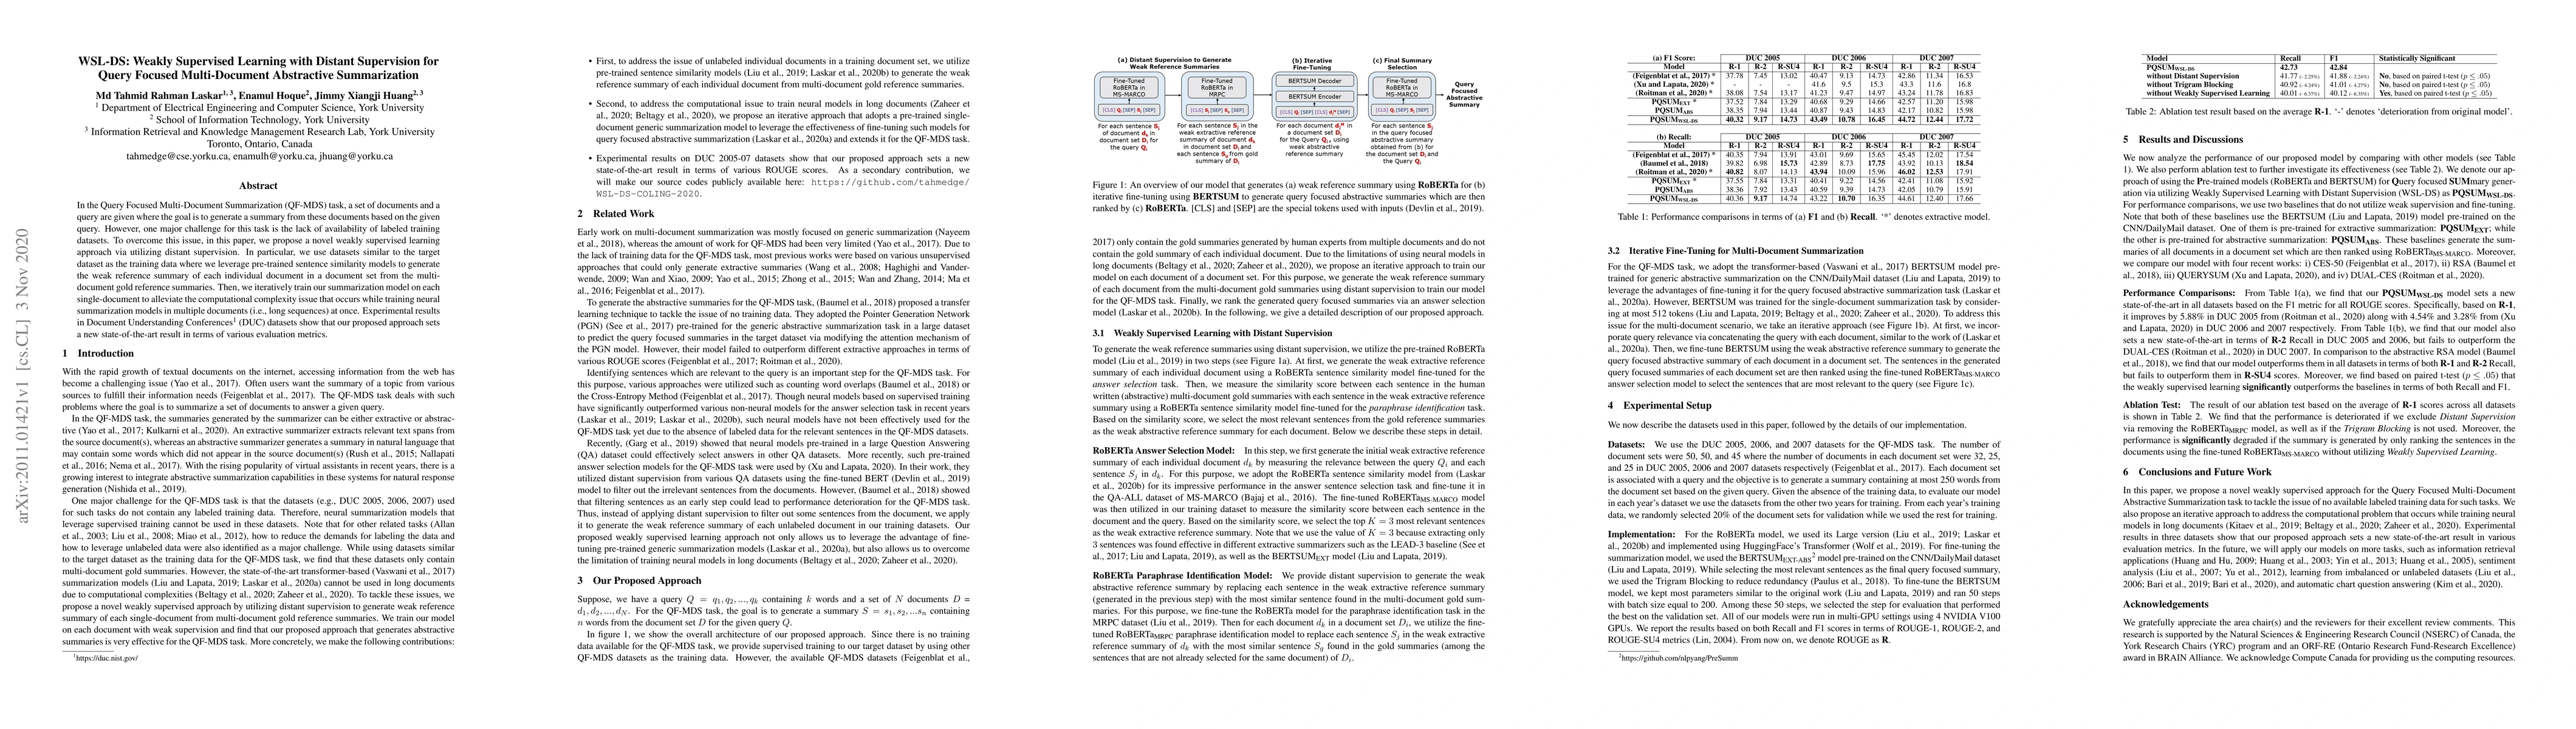
In the Query Focused Multi-Document Summarization (QF-MDS) task, a set of documents and a query are given where the goal is to generate a summary from these documents based on the given query. Howev...
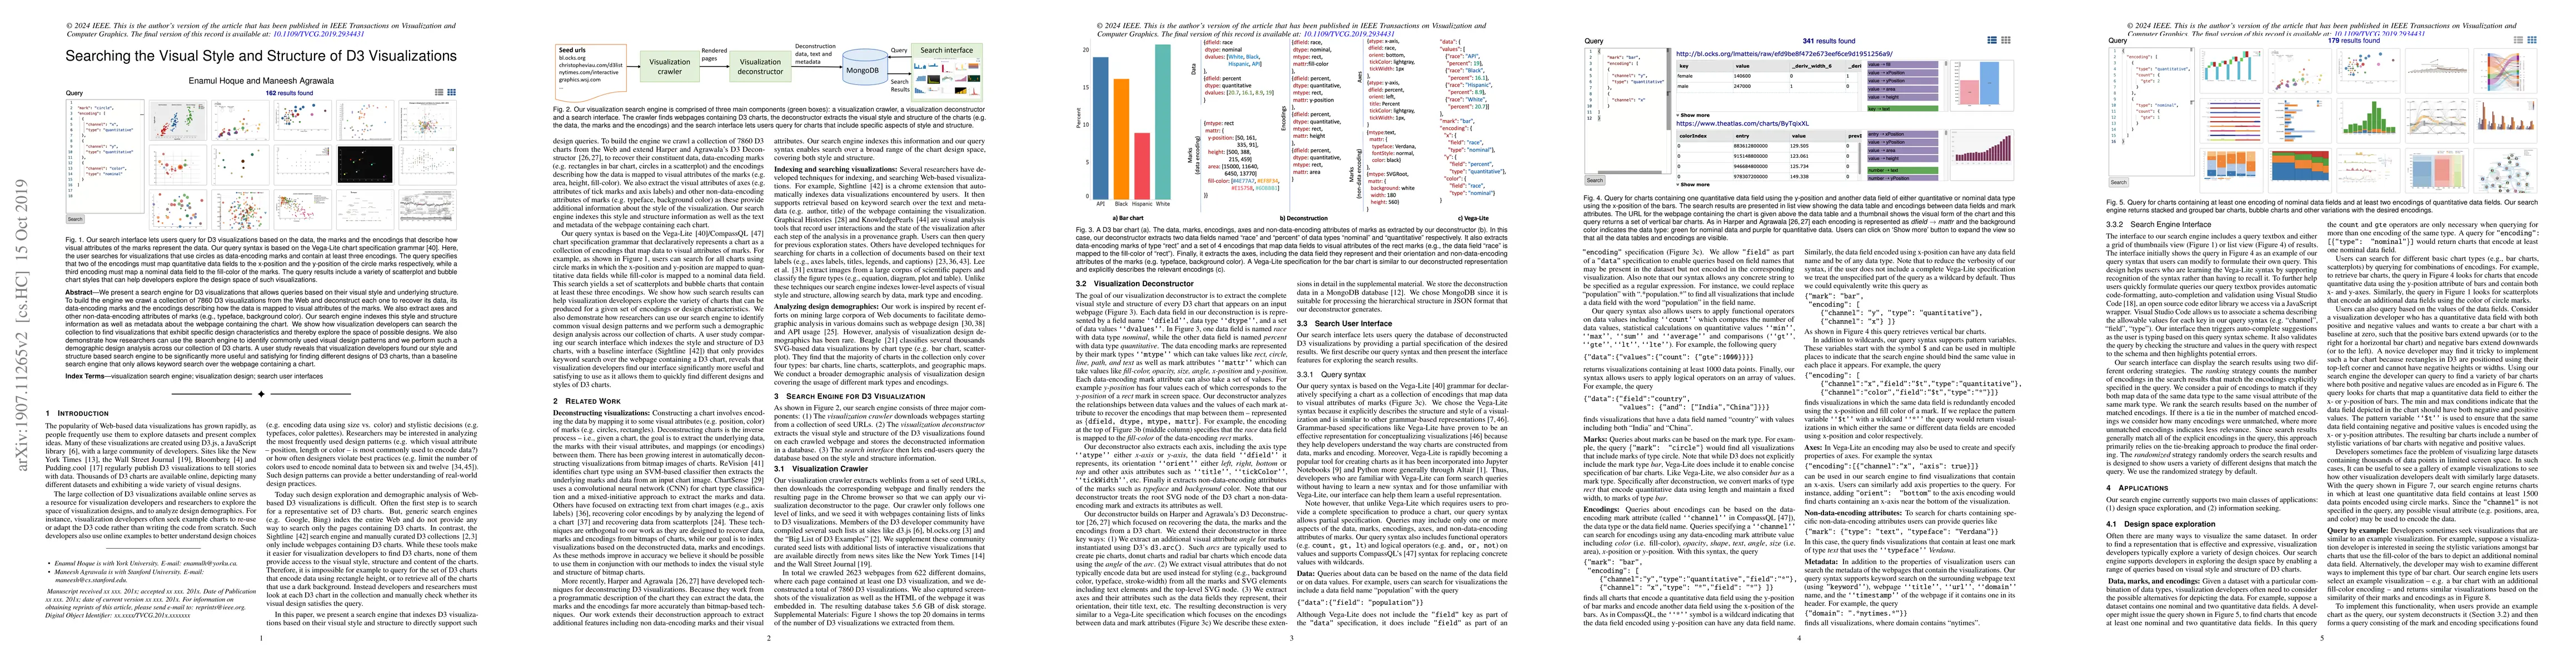
We present a search engine for D3 visualizations that allows queries based on their visual style and underlying structure. To build the engine we crawl a collection of 7860 D3 visualizations from th...
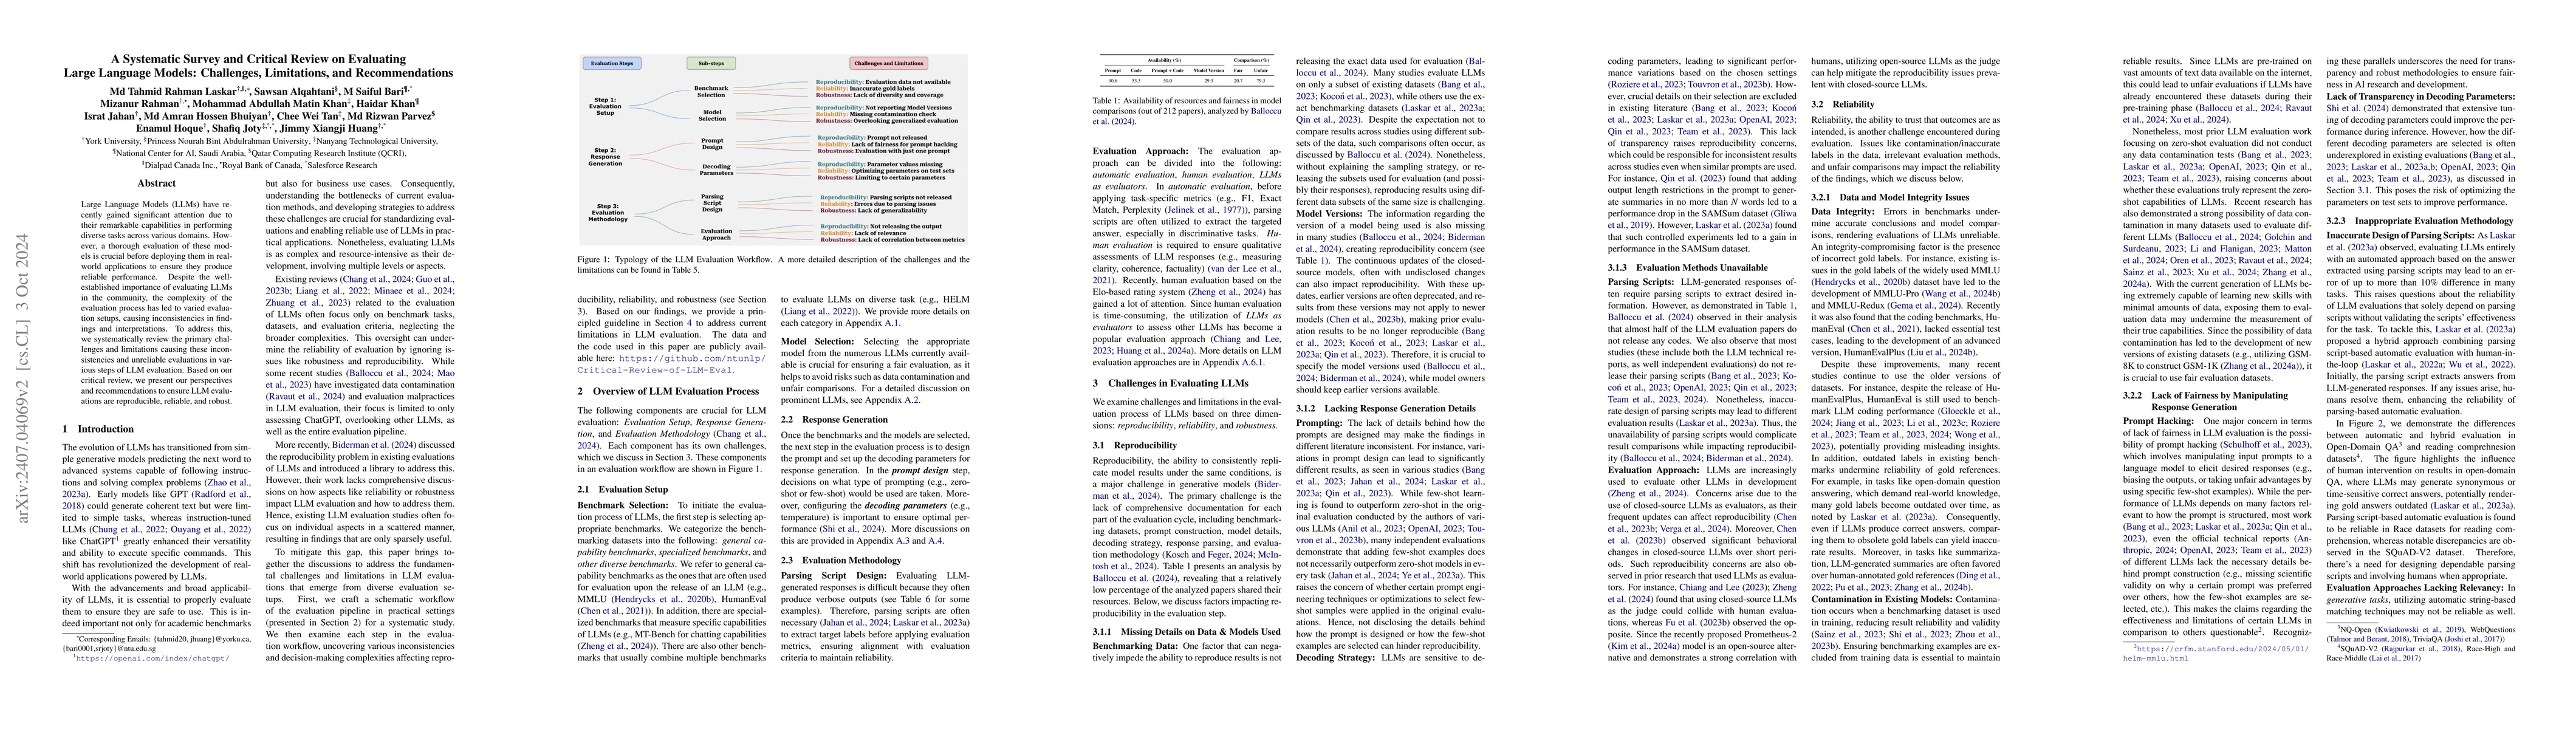
Large Language Models (LLMs) have recently gained significant attention due to their remarkable capabilities in performing diverse tasks across various domains. However, a thorough evaluation of these...

Data-driven storytelling is a powerful method for conveying insights by combining narrative techniques with visualizations and text. These stories integrate visual aids, such as highlighted bars and l...
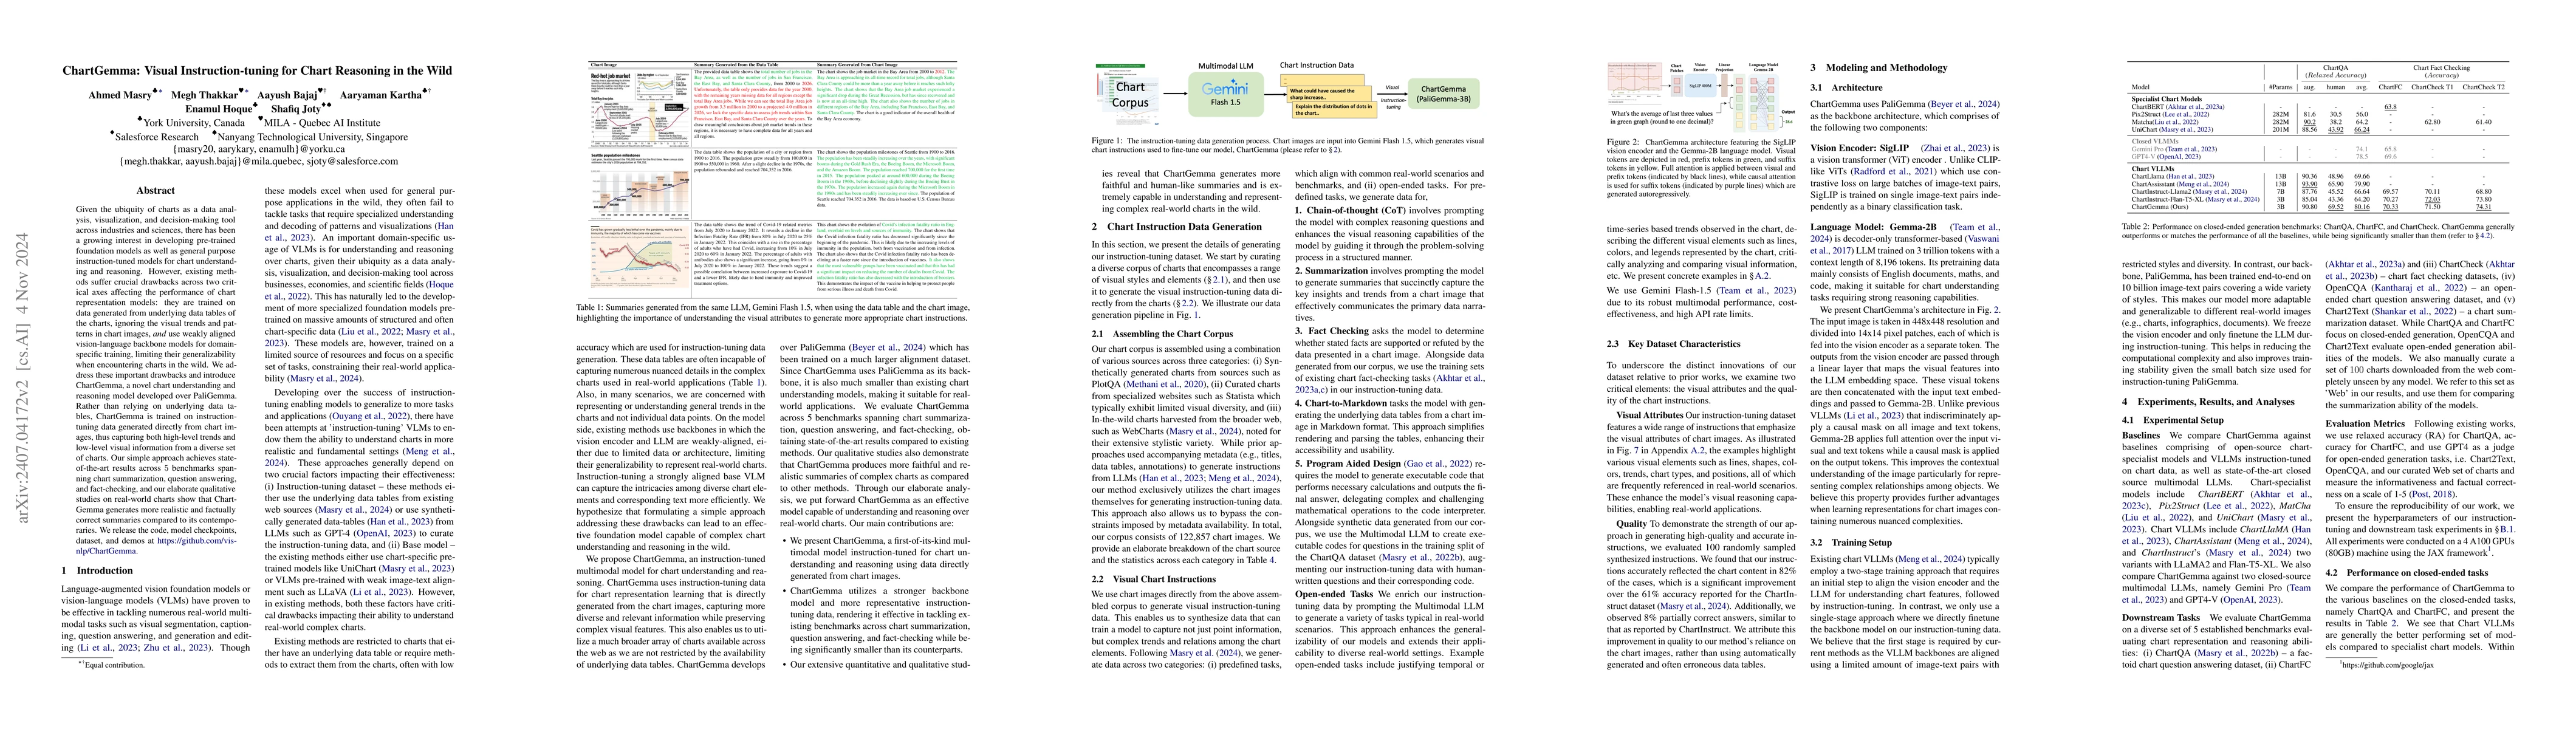
Given the ubiquity of charts as a data analysis, visualization, and decision-making tool across industries and sciences, there has been a growing interest in developing pre-trained foundation models a...
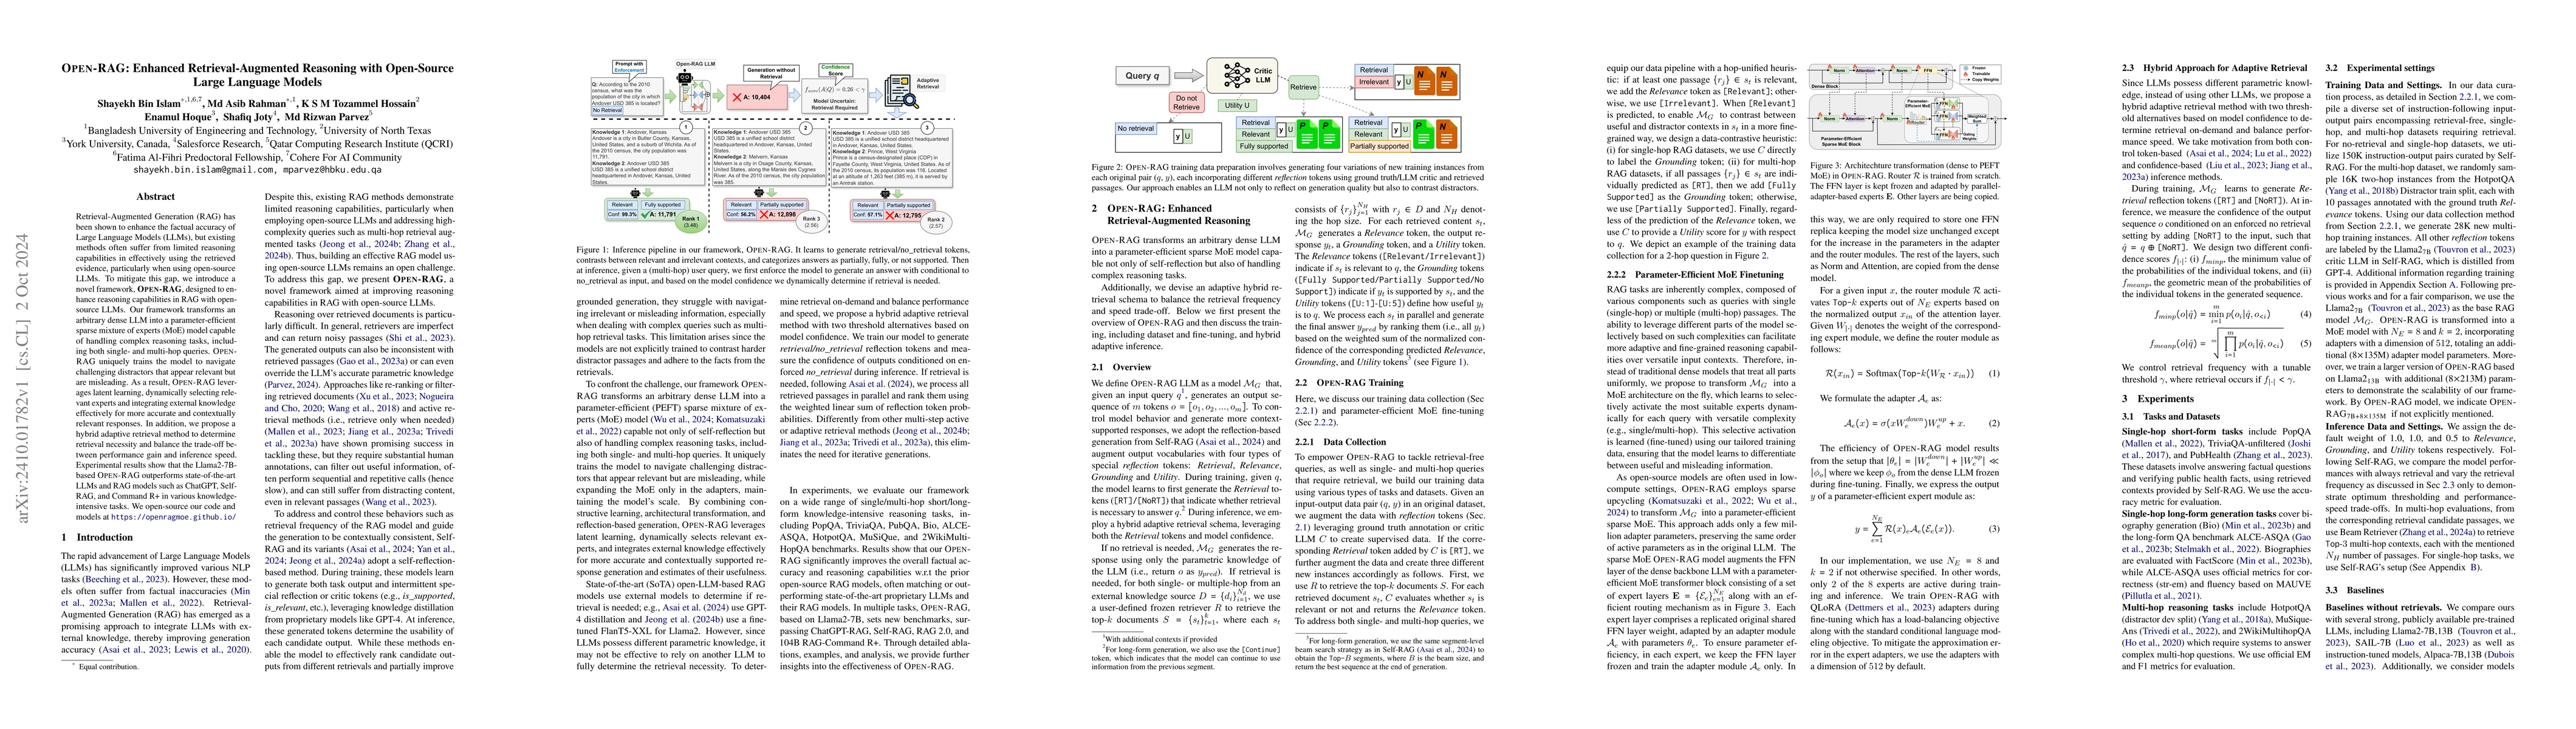
Retrieval-Augmented Generation (RAG) has been shown to enhance the factual accuracy of Large Language Models (LLMs), but existing methods often suffer from limited reasoning capabilities in effectivel...
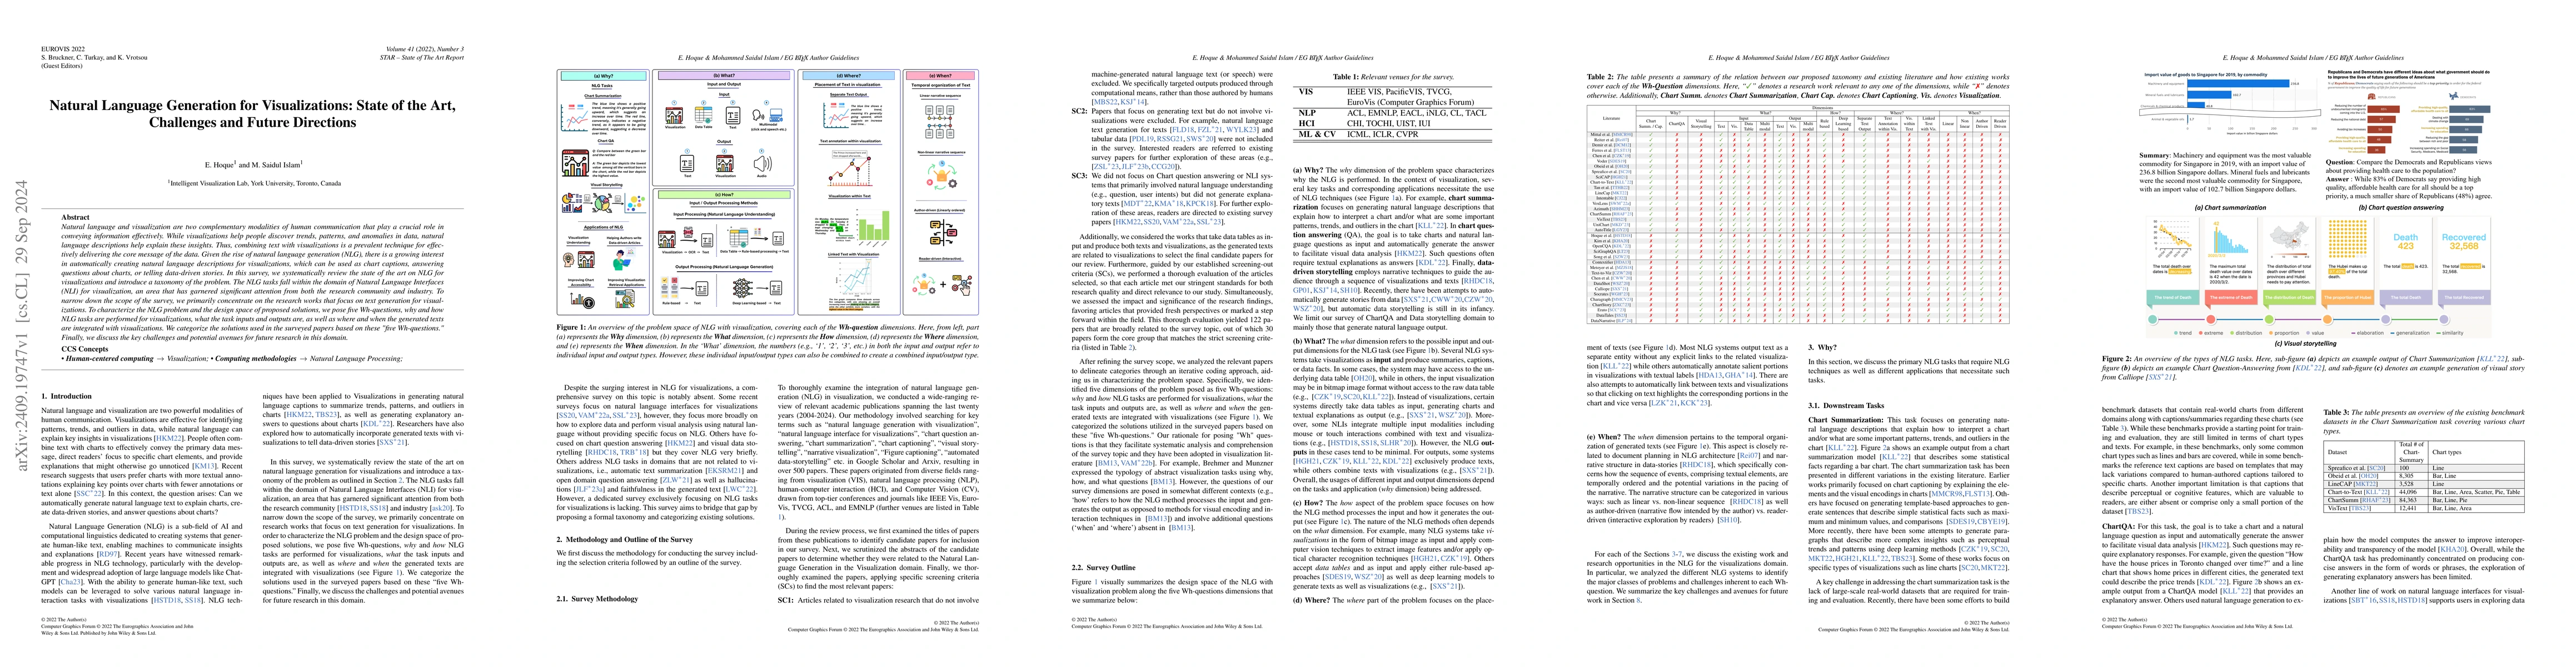
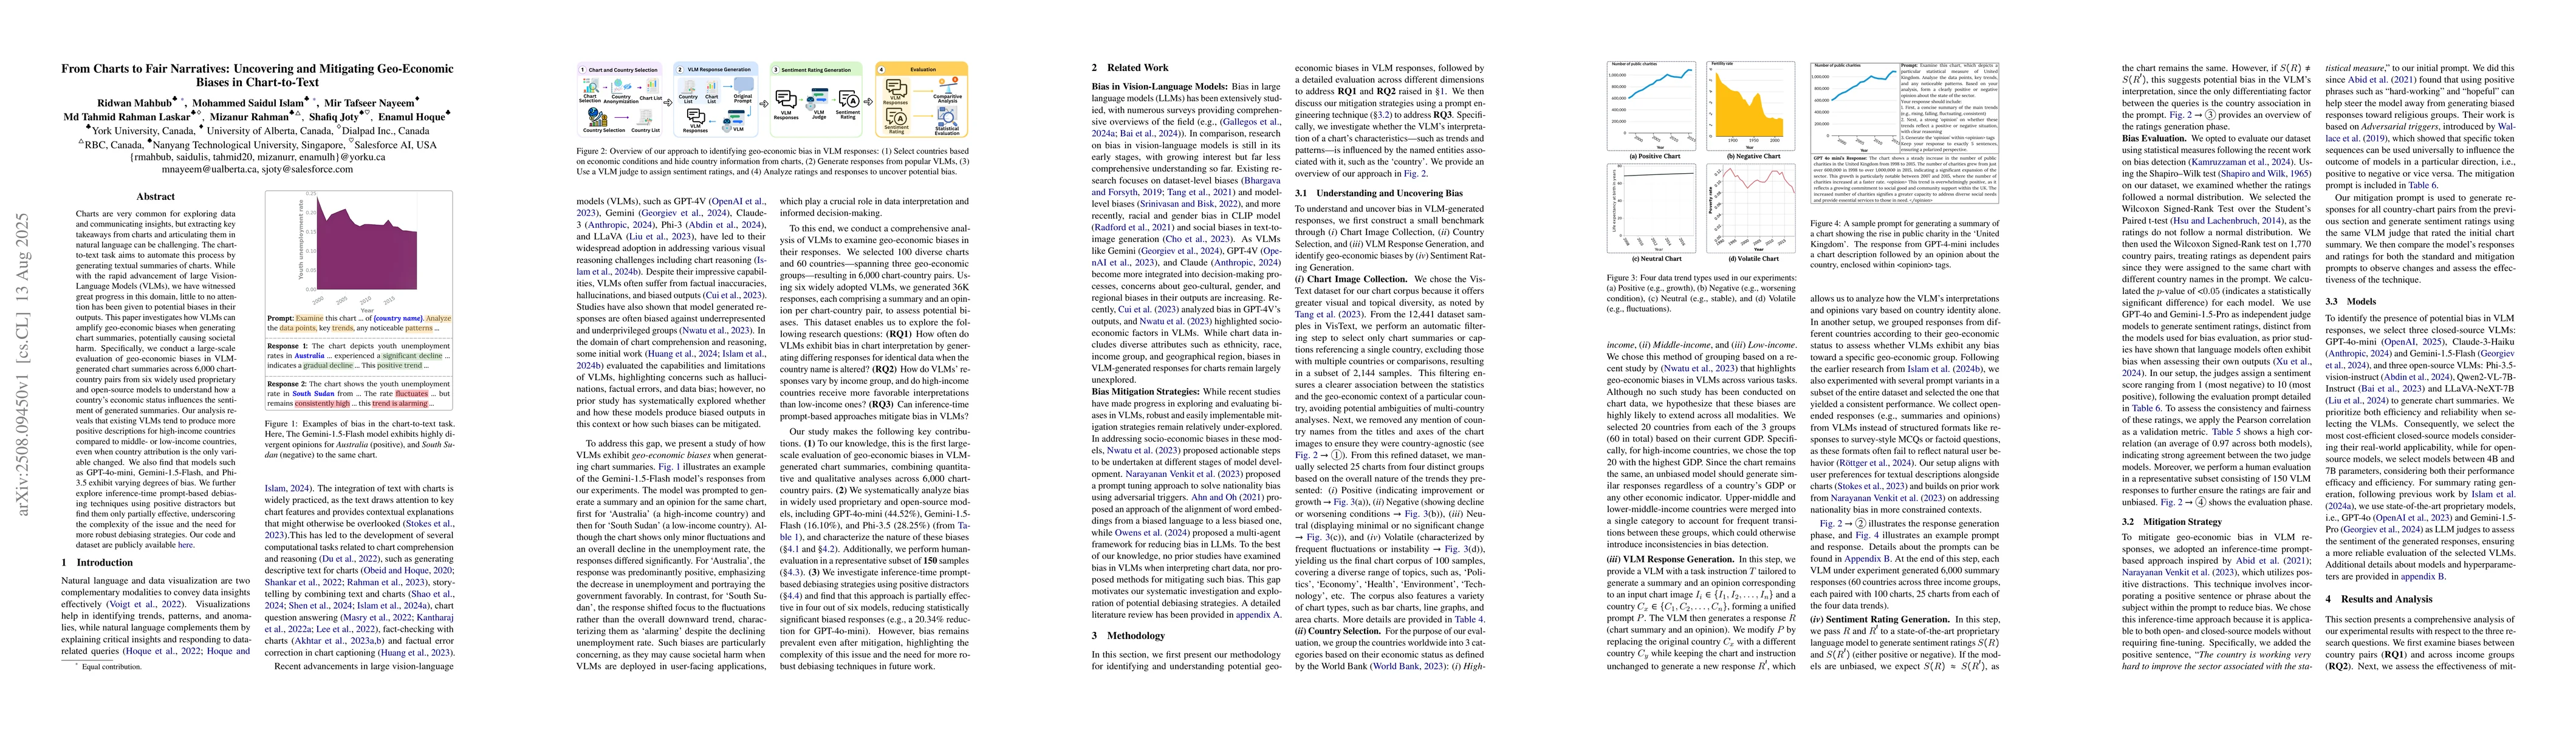
Natural language and visualization are two complementary modalities of human communication that play a crucial role in conveying information effectively. While visualizations help people discover tren...
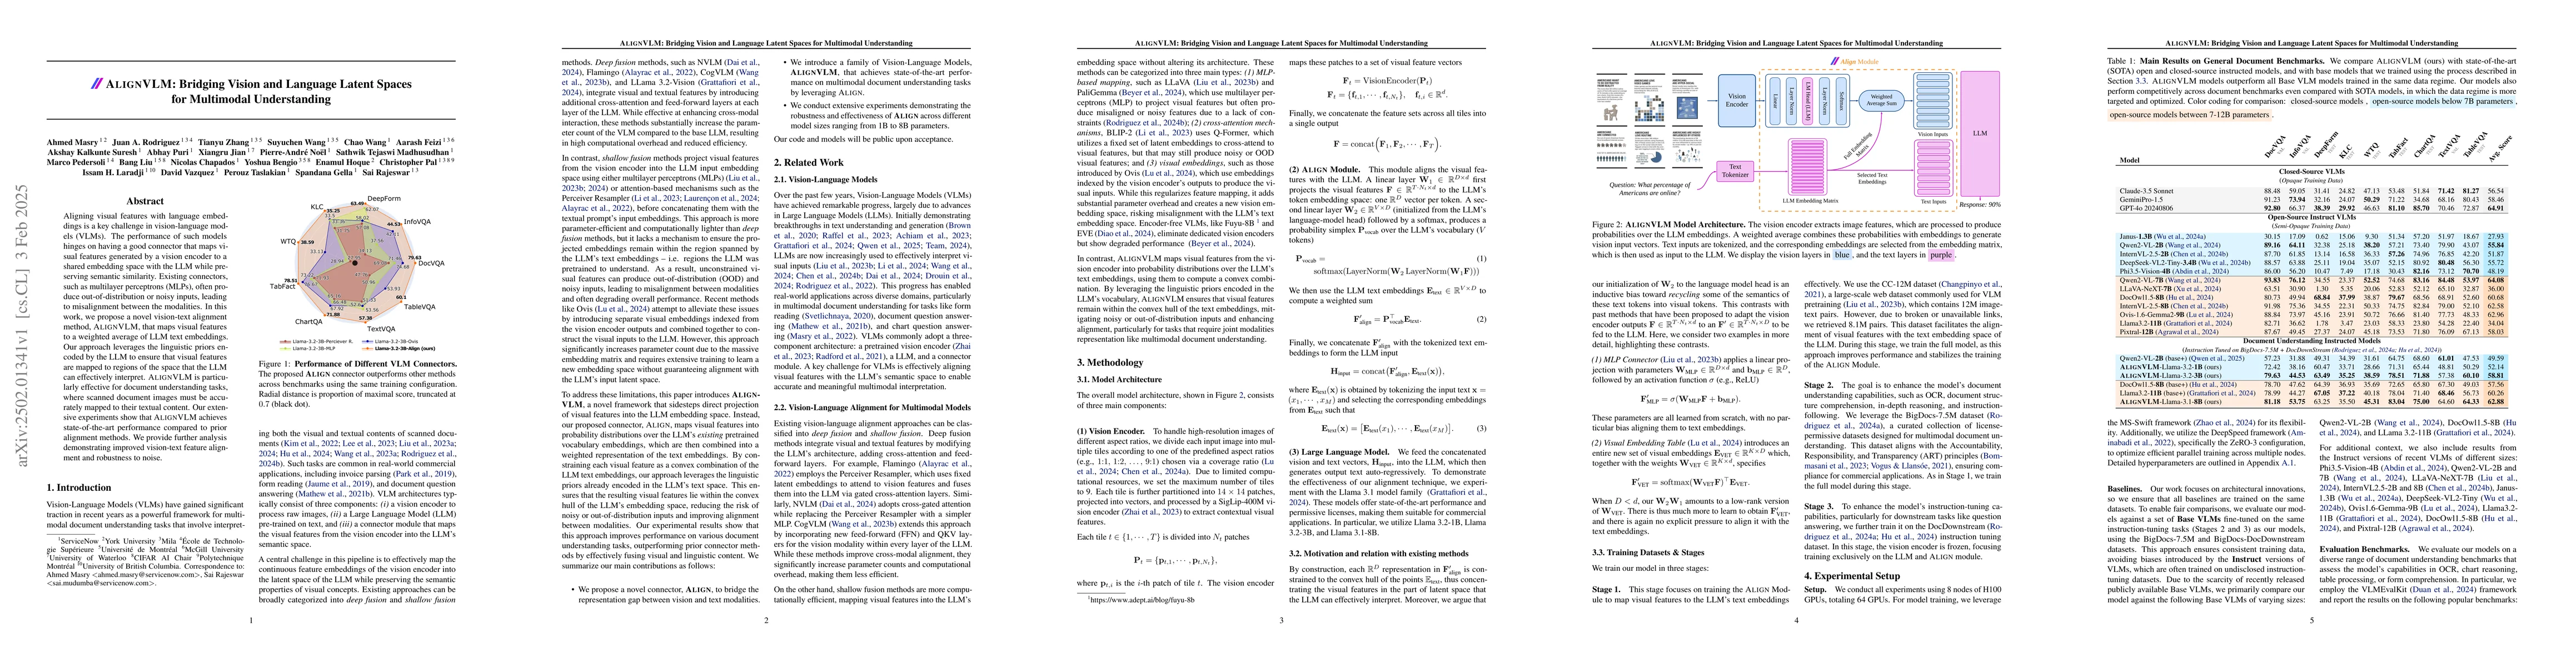
Aligning visual features with language embeddings is a key challenge in vision-language models (VLMs). The performance of such models hinges on having a good connector that maps visual features genera...
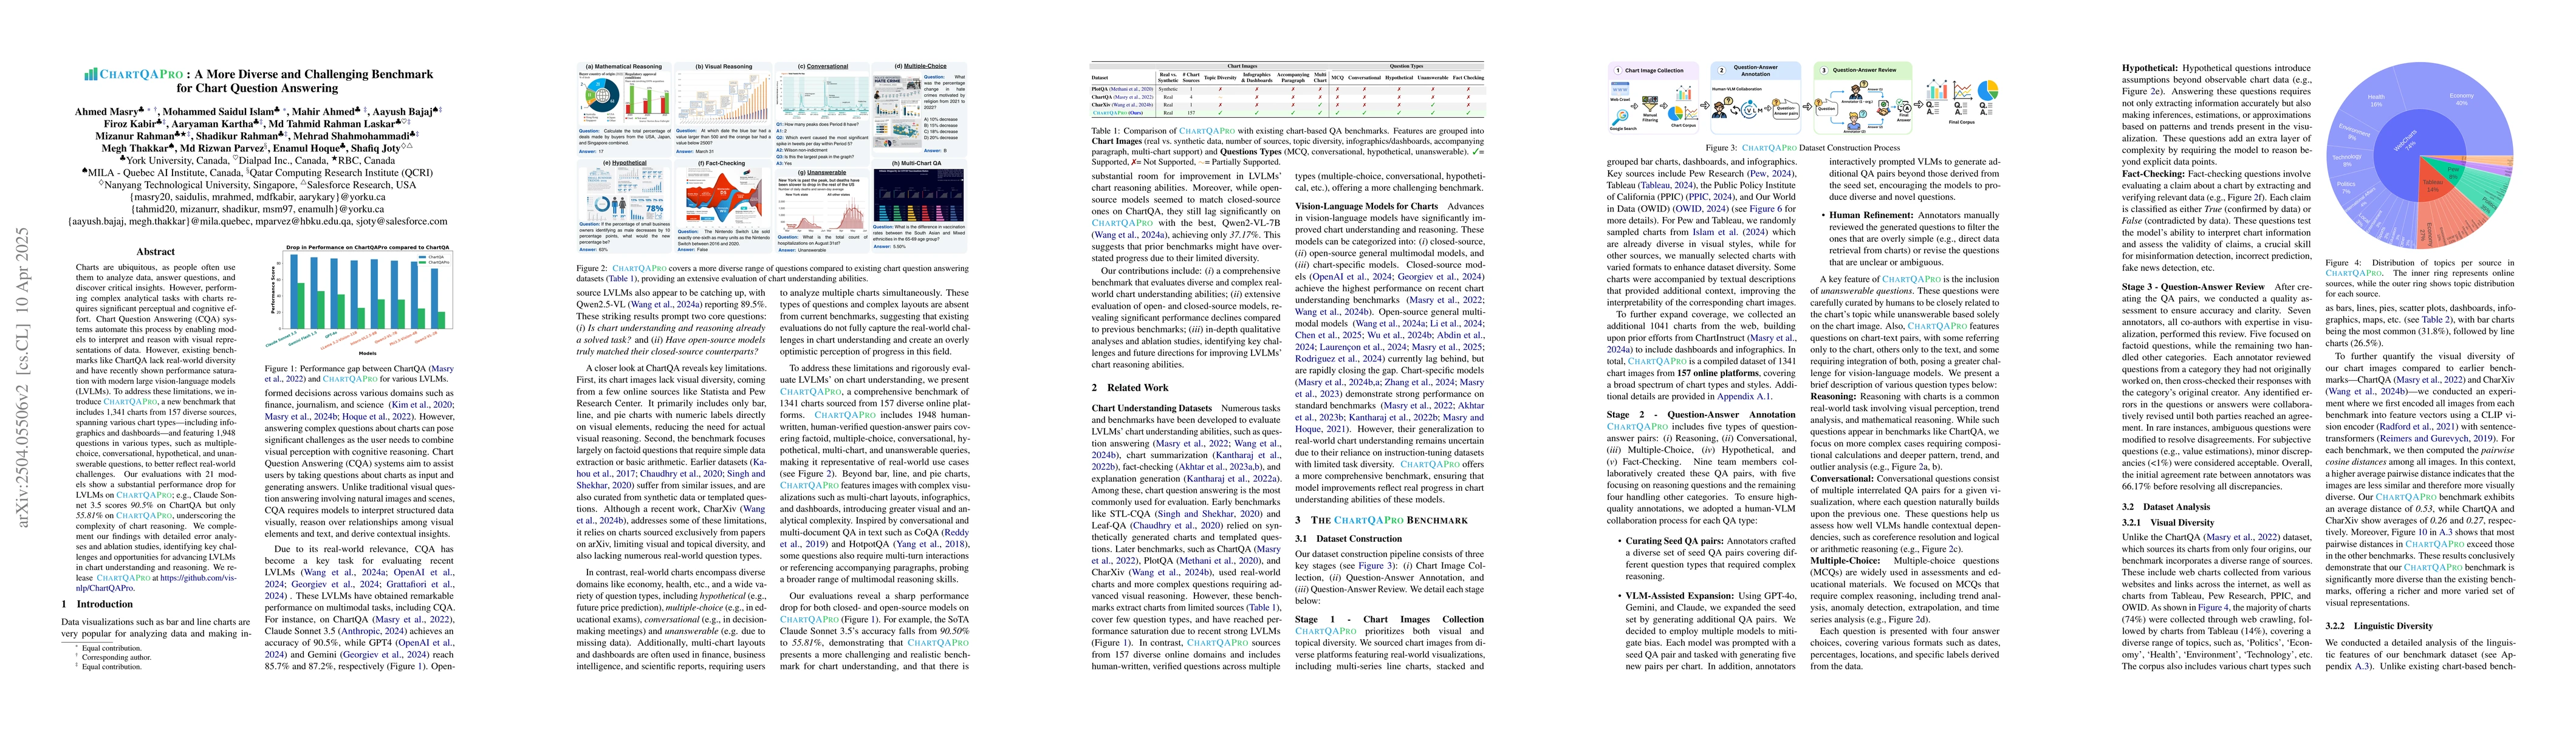
Charts are ubiquitous, as people often use them to analyze data, answer questions, and discover critical insights. However, performing complex analytical tasks with charts requires significant percept...
Charts are ubiquitous as they help people understand and reason with data. Recently, various downstream tasks, such as chart question answering, chart2text, and fact-checking, have emerged. Large Visi...
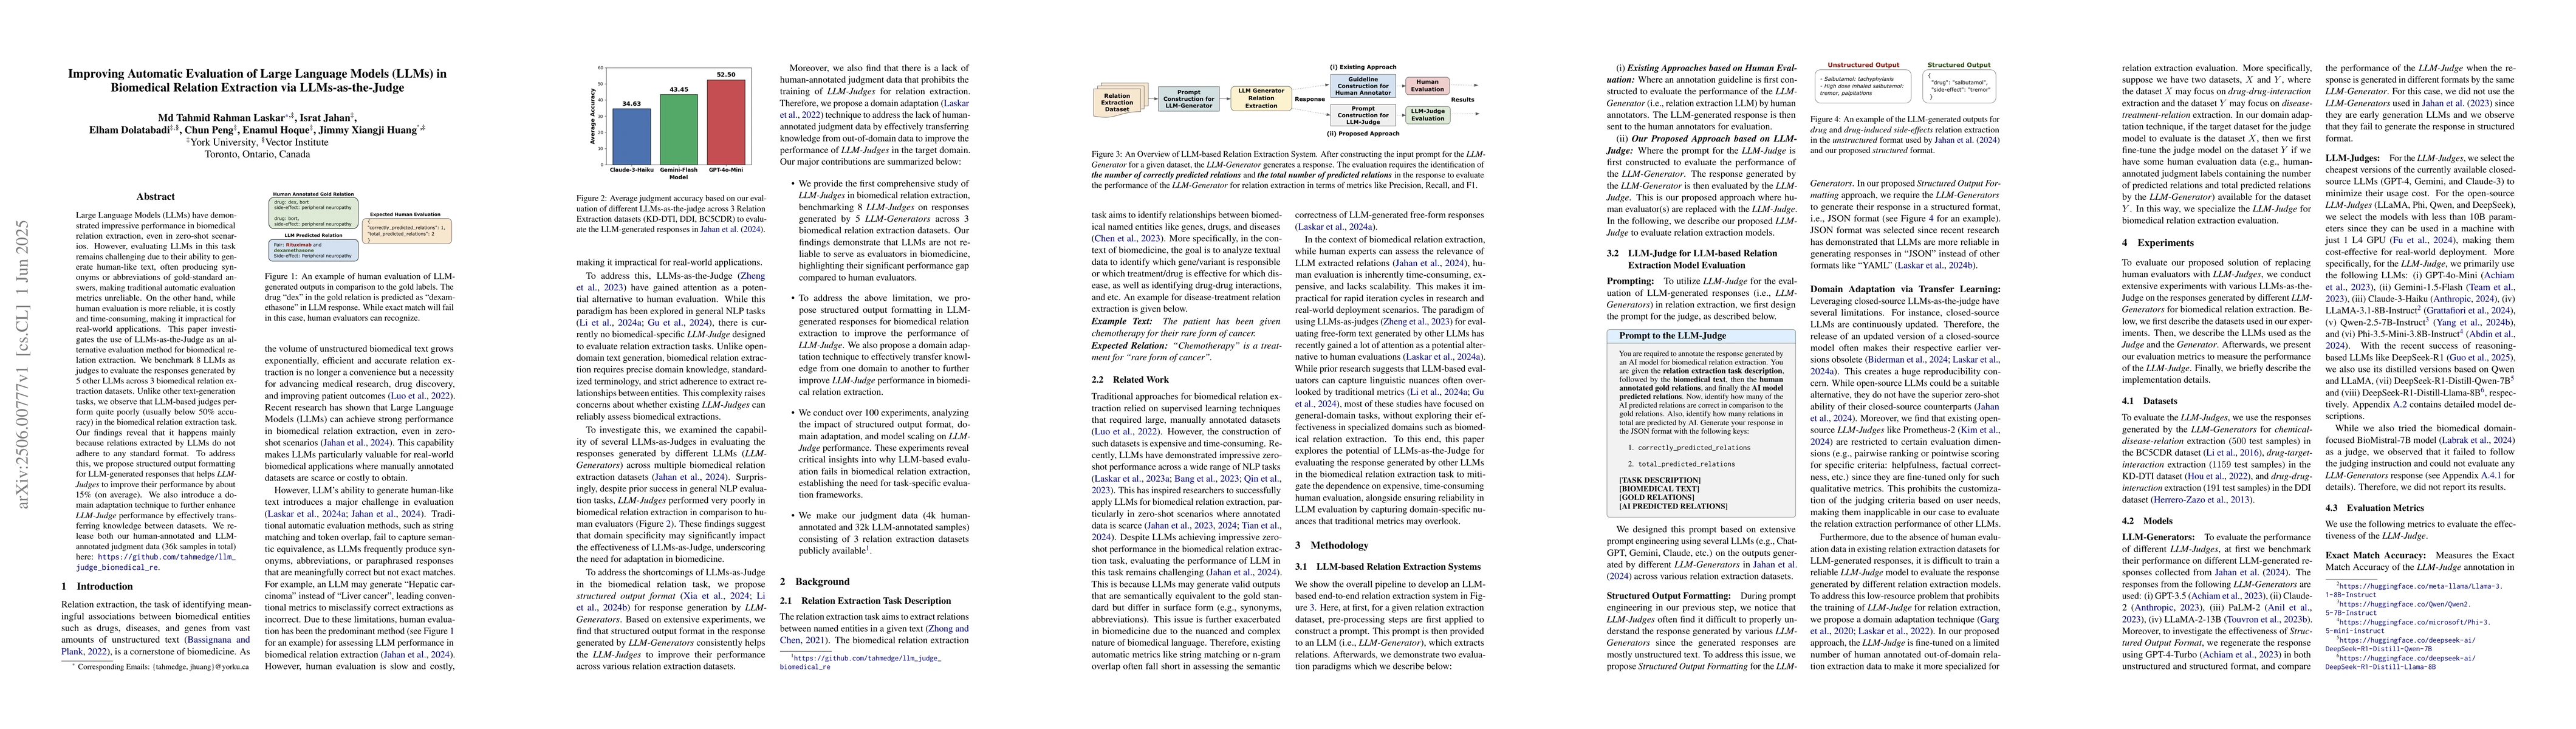
Large Language Models (LLMs) have demonstrated impressive performance in biomedical relation extraction, even in zero-shot scenarios. However, evaluating LLMs in this task remains challenging due to t...
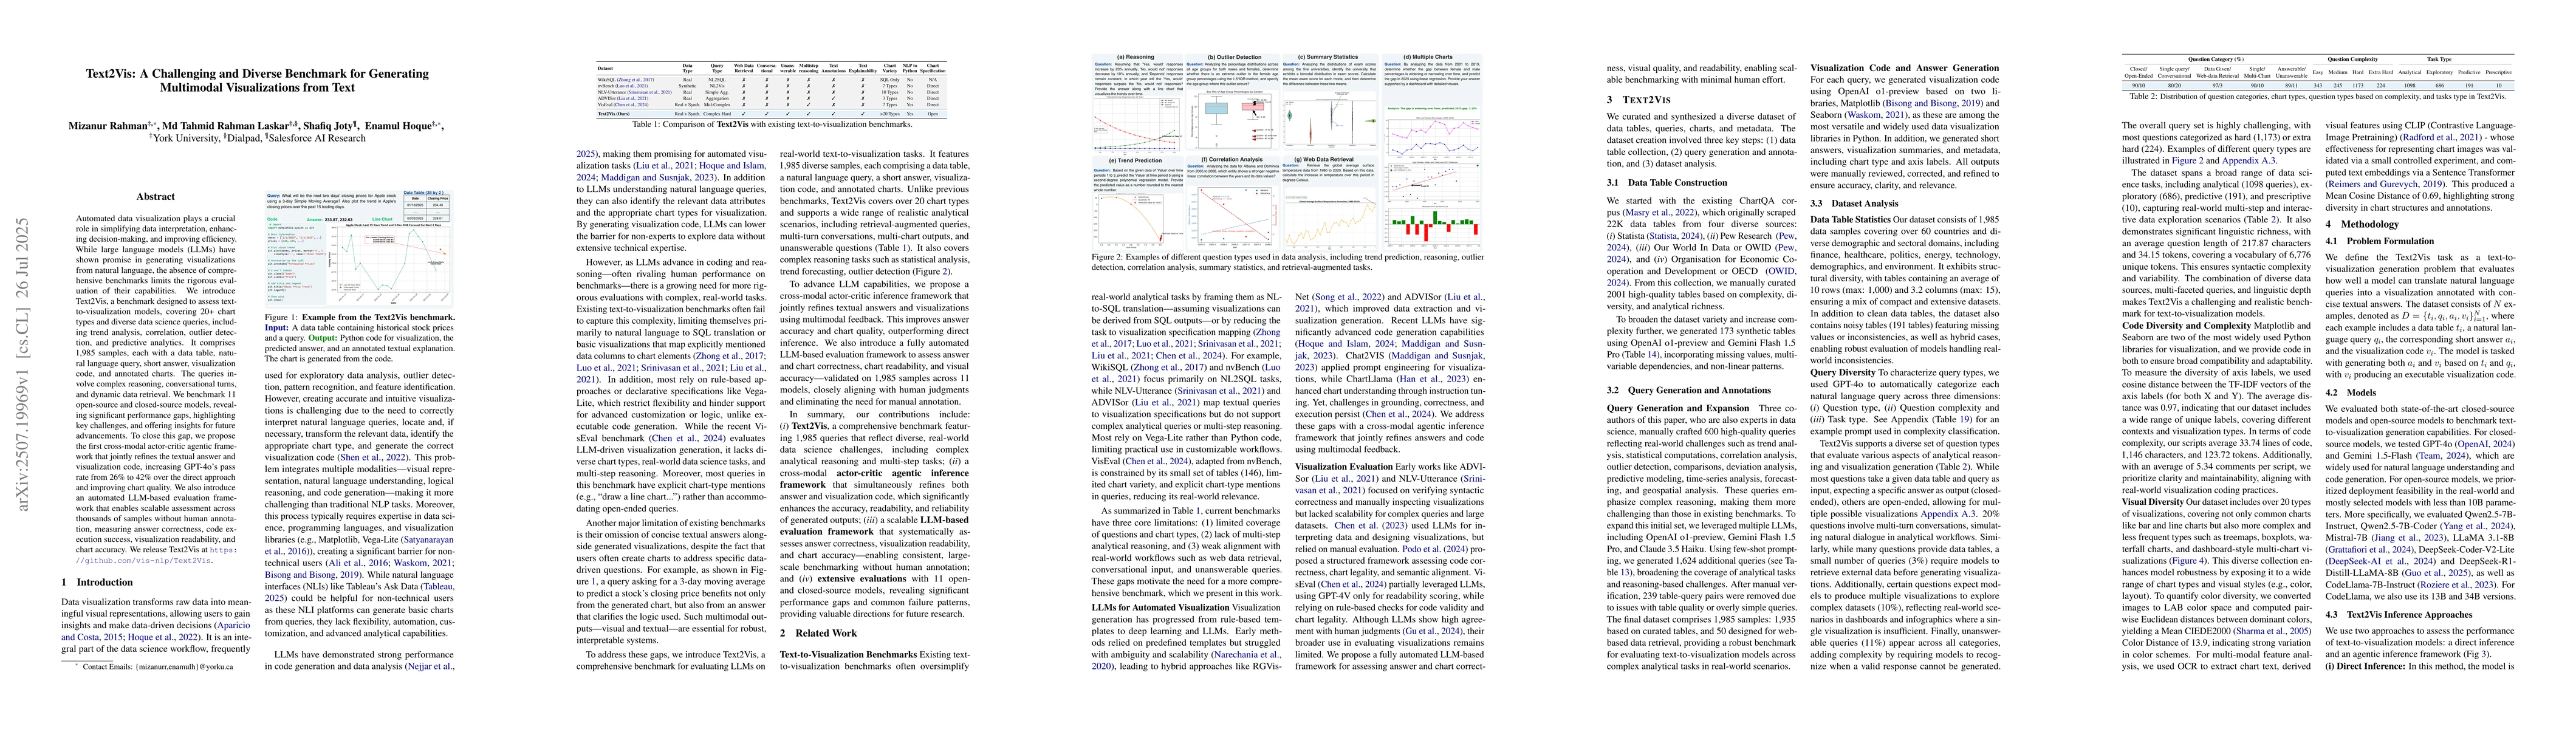
Automated data visualization plays a crucial role in simplifying data interpretation, enhancing decision-making, and improving efficiency. While large language models (LLMs) have shown promise in gene...
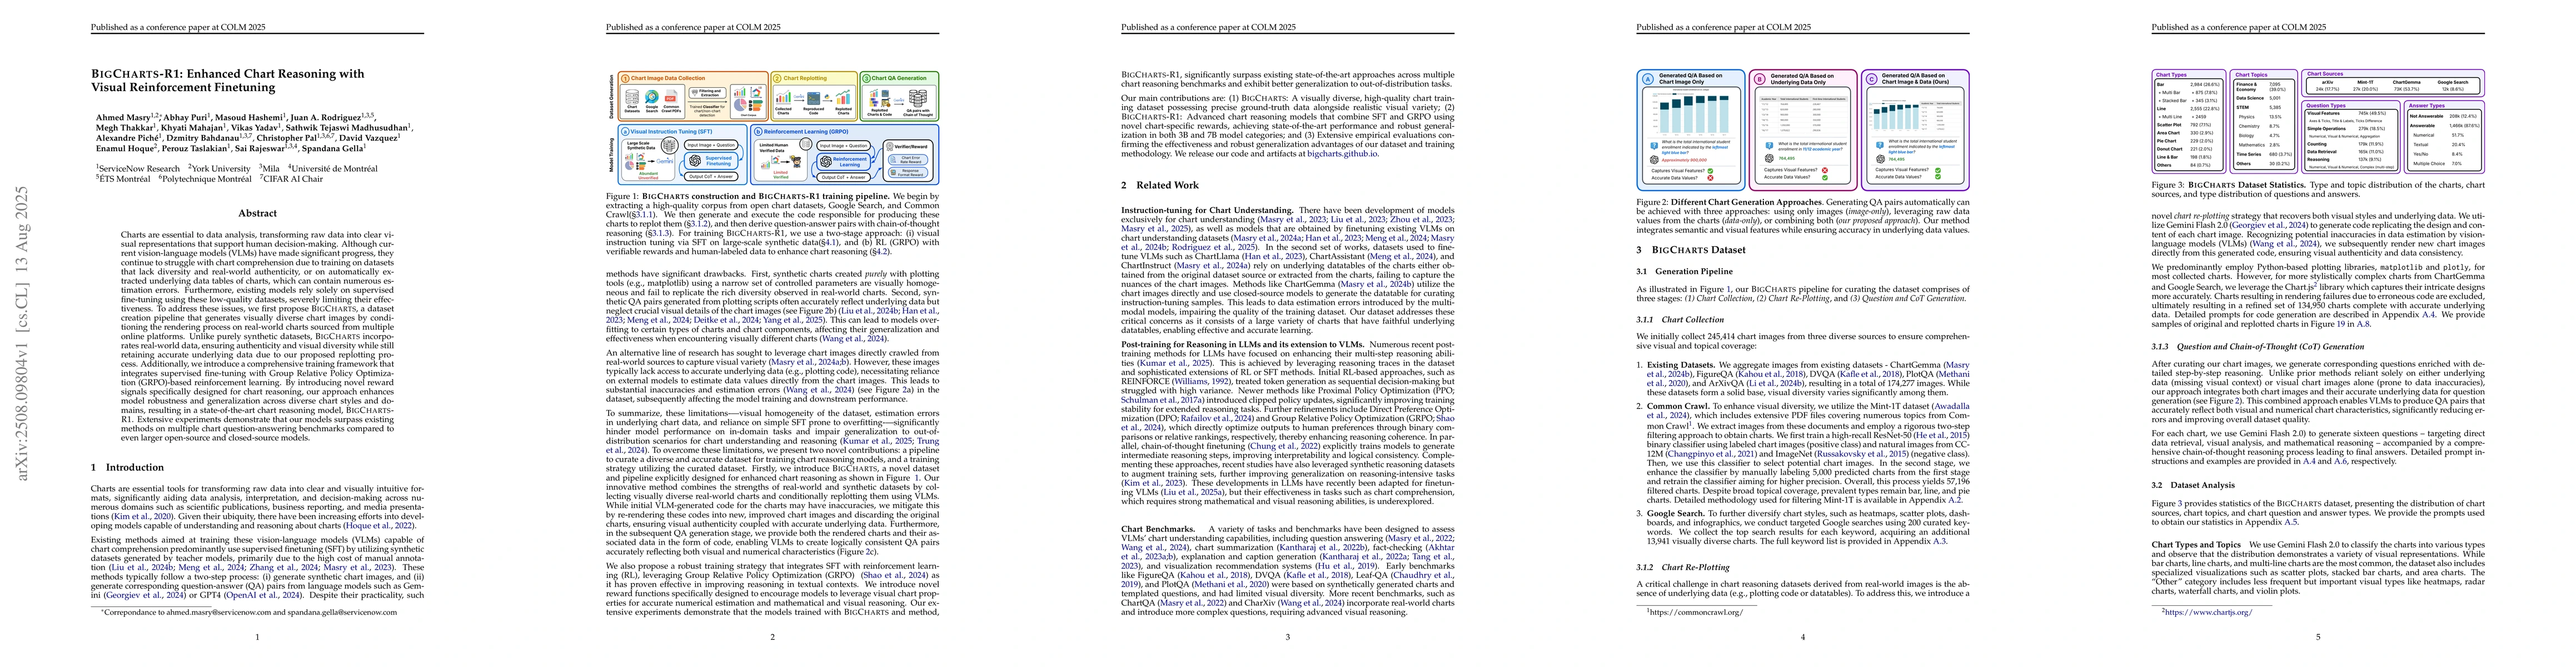
Charts are essential to data analysis, transforming raw data into clear visual representations that support human decision-making. Although current vision-language models (VLMs) have made significant ...
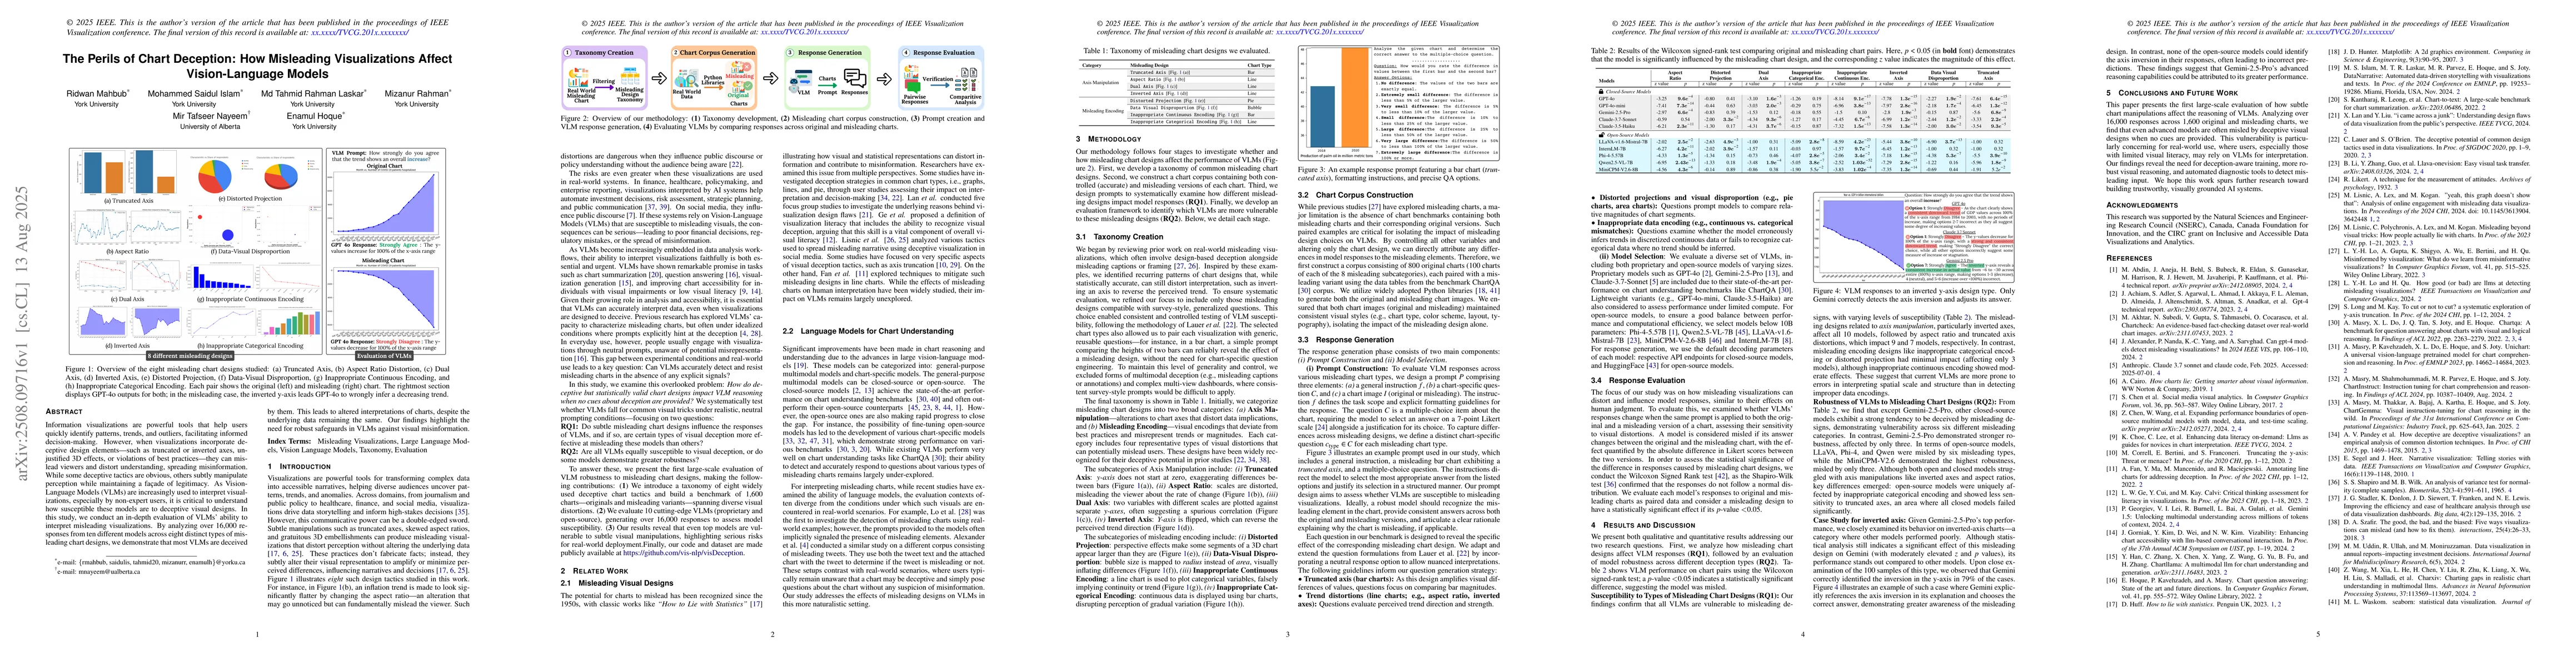
Information visualizations are powerful tools that help users quickly identify patterns, trends, and outliers, facilitating informed decision-making. However, when visualizations incorporate deceptive...
Charts are very common for exploring data and communicating insights, but extracting key takeaways from charts and articulating them in natural language can be challenging. The chart-to-text task aims...
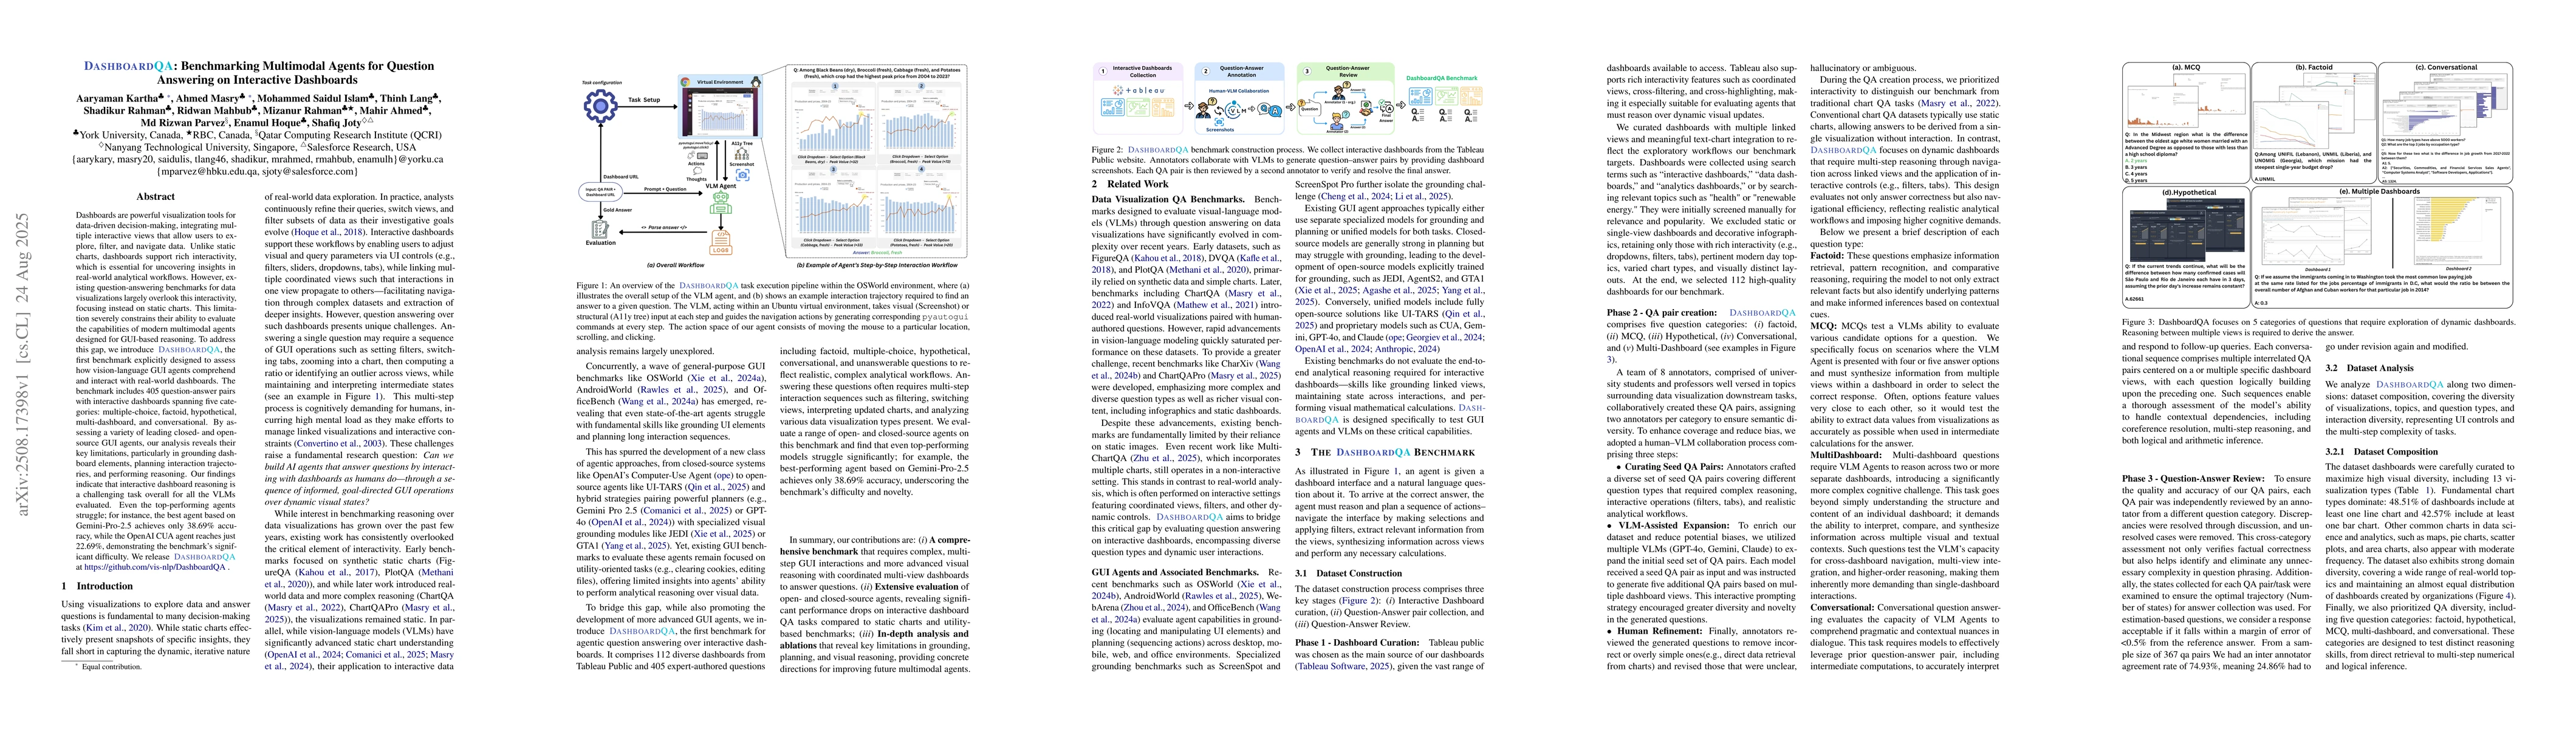
Dashboards are powerful visualization tools for data-driven decision-making, integrating multiple interactive views that allow users to explore, filter, and navigate data. Unlike static charts, dashbo...
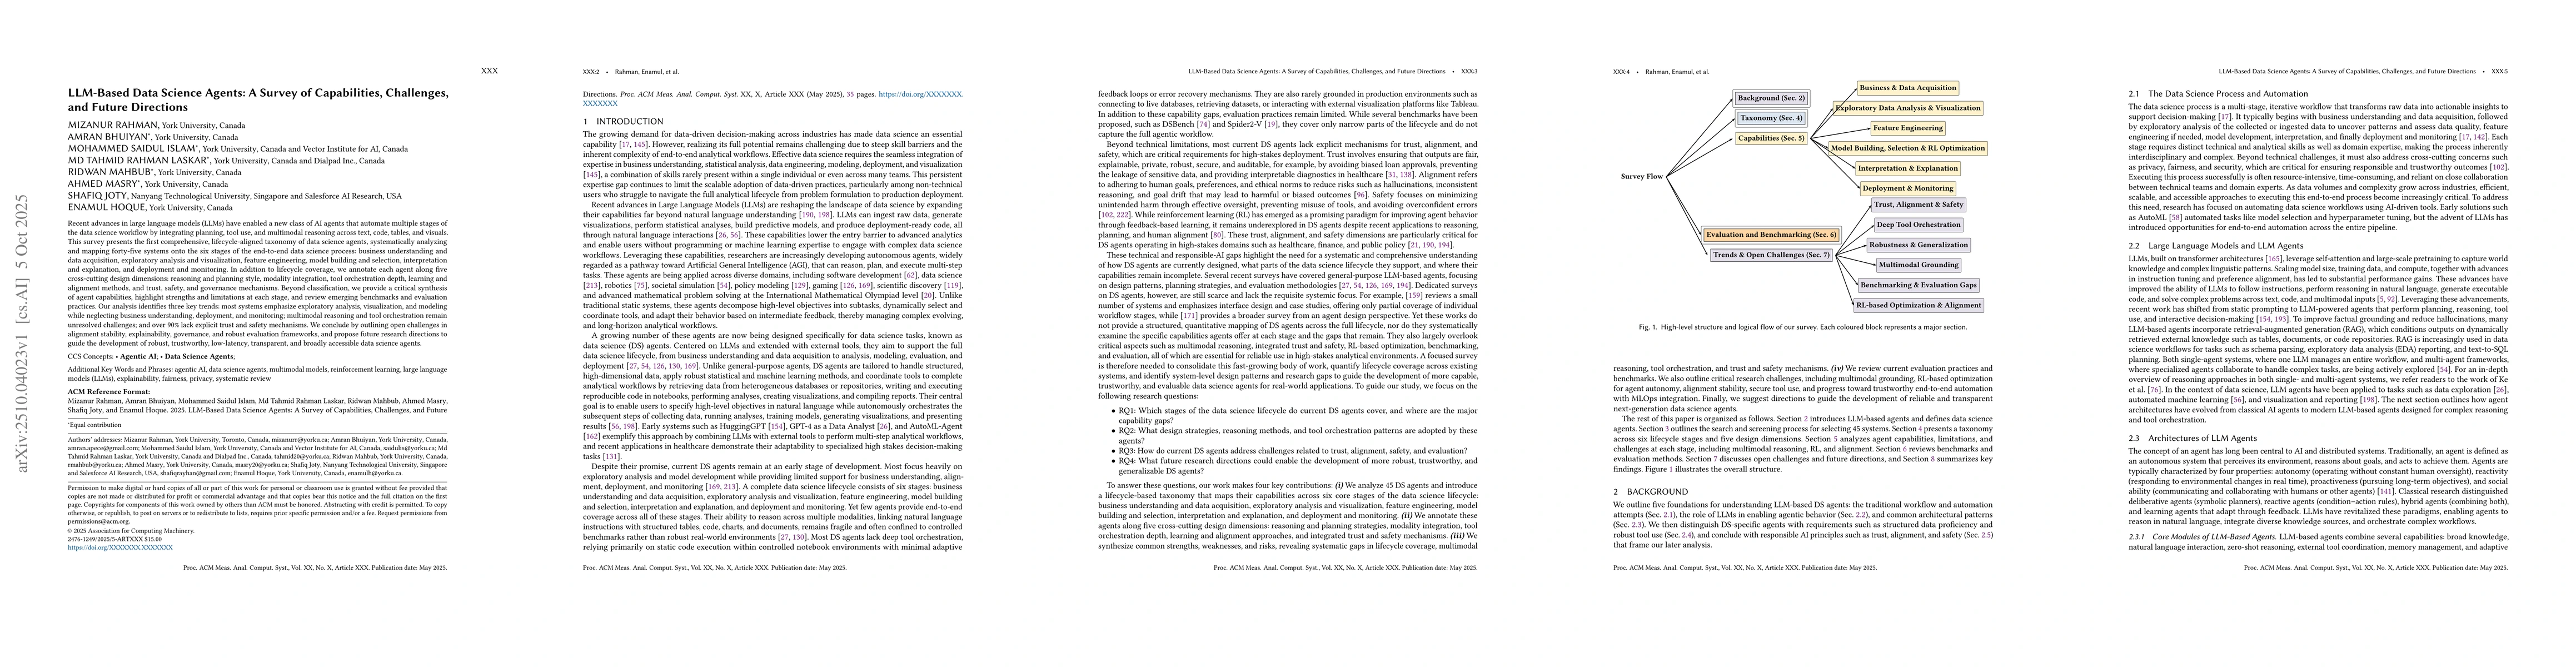
Recent advances in large language models (LLMs) have enabled a new class of AI agents that automate multiple stages of the data science workflow by integrating planning, tool use, and multimodal reaso...

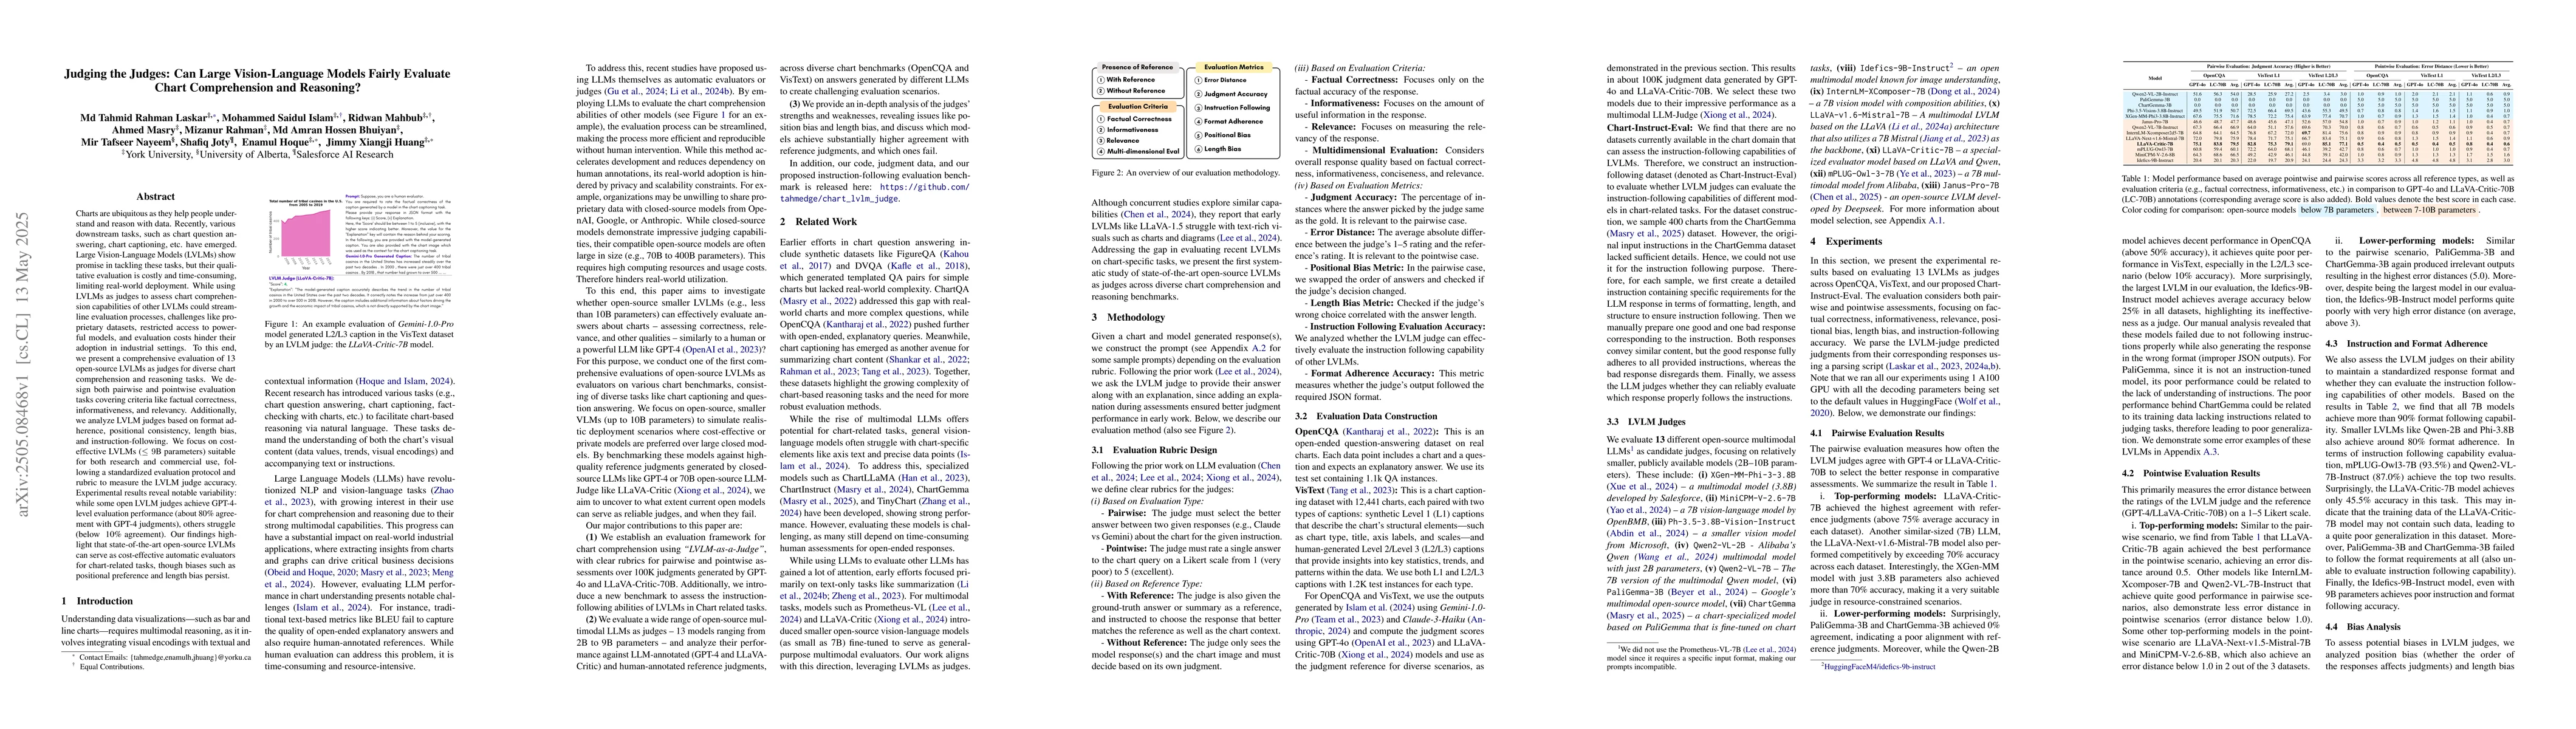
Large Vision-Language Models (LVLMs) with only 7B parameters have shown promise as automated judges in chart comprehension tasks. However, tiny models (<=2B parameters) still perform poorly as judges,...
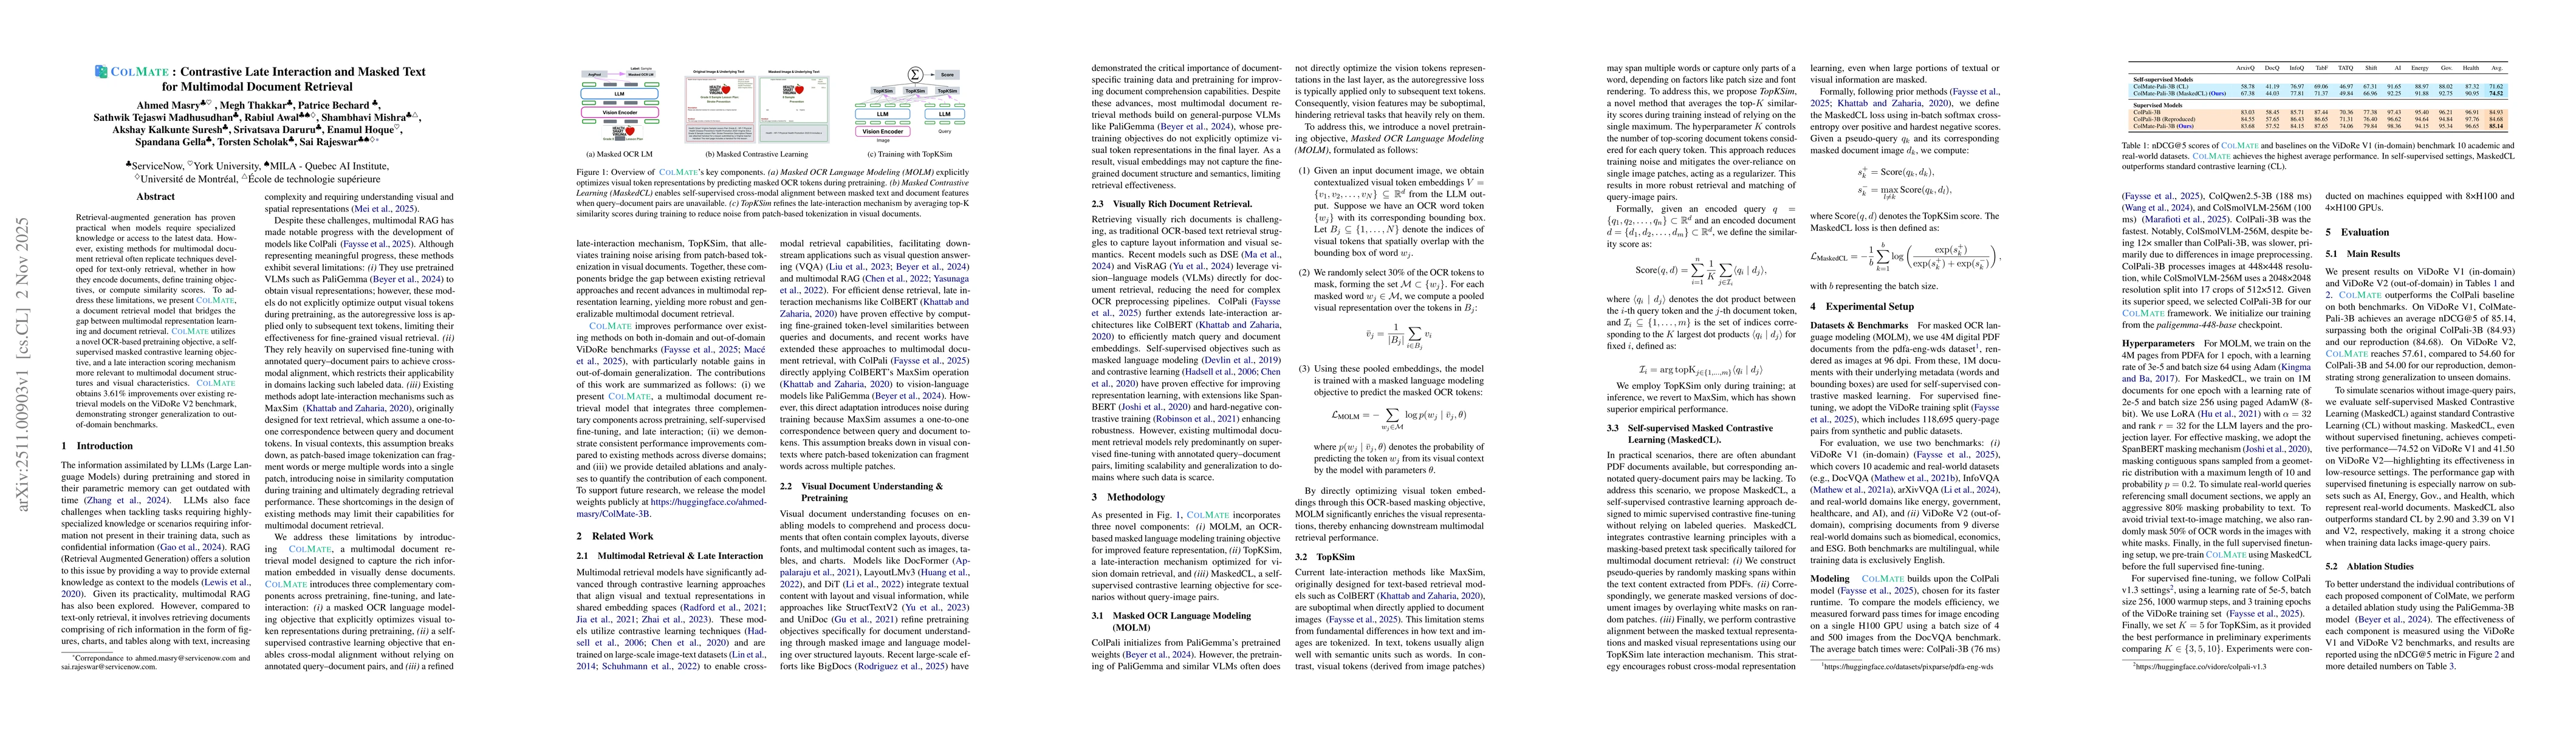
Retrieval-augmented generation has proven practical when models require specialized knowledge or access to the latest data. However, existing methods for multimodal document retrieval often replicate ...
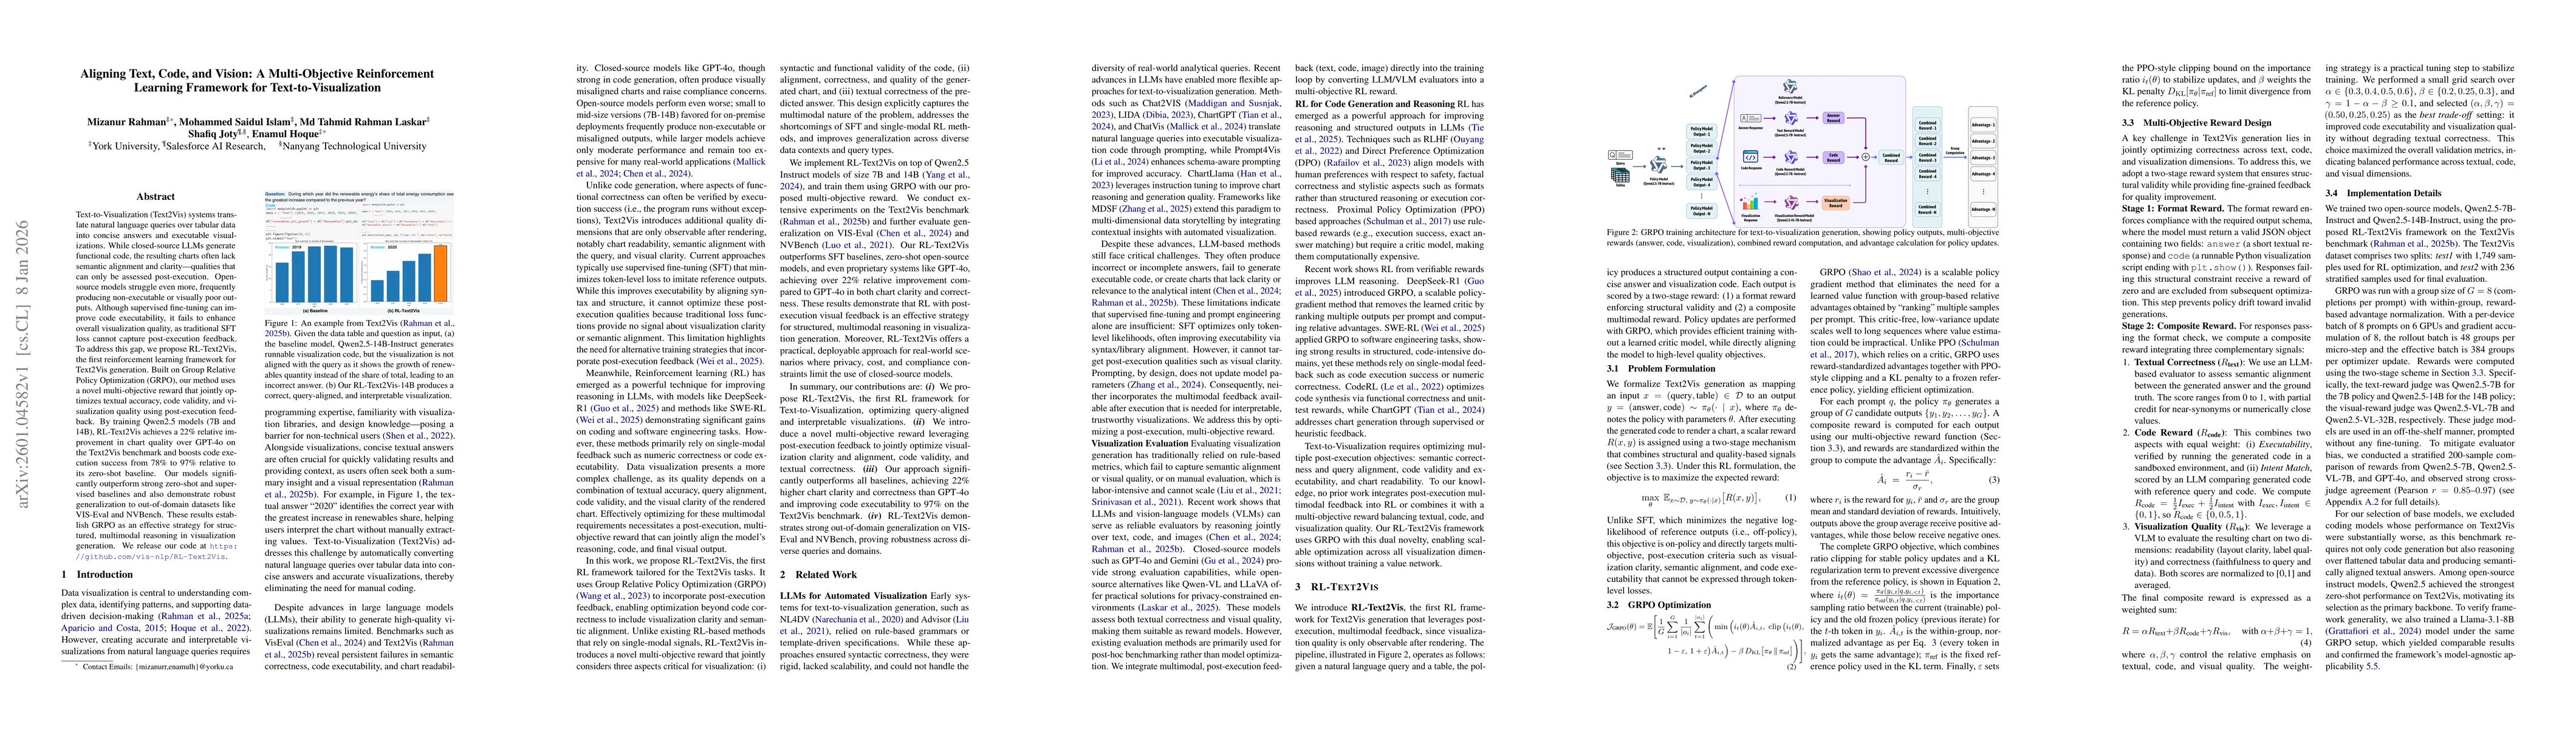
Text-to-Visualization (Text2Vis) systems translate natural language queries over tabular data into concise answers and executable visualizations. While closed-source LLMs generate functional code, the...
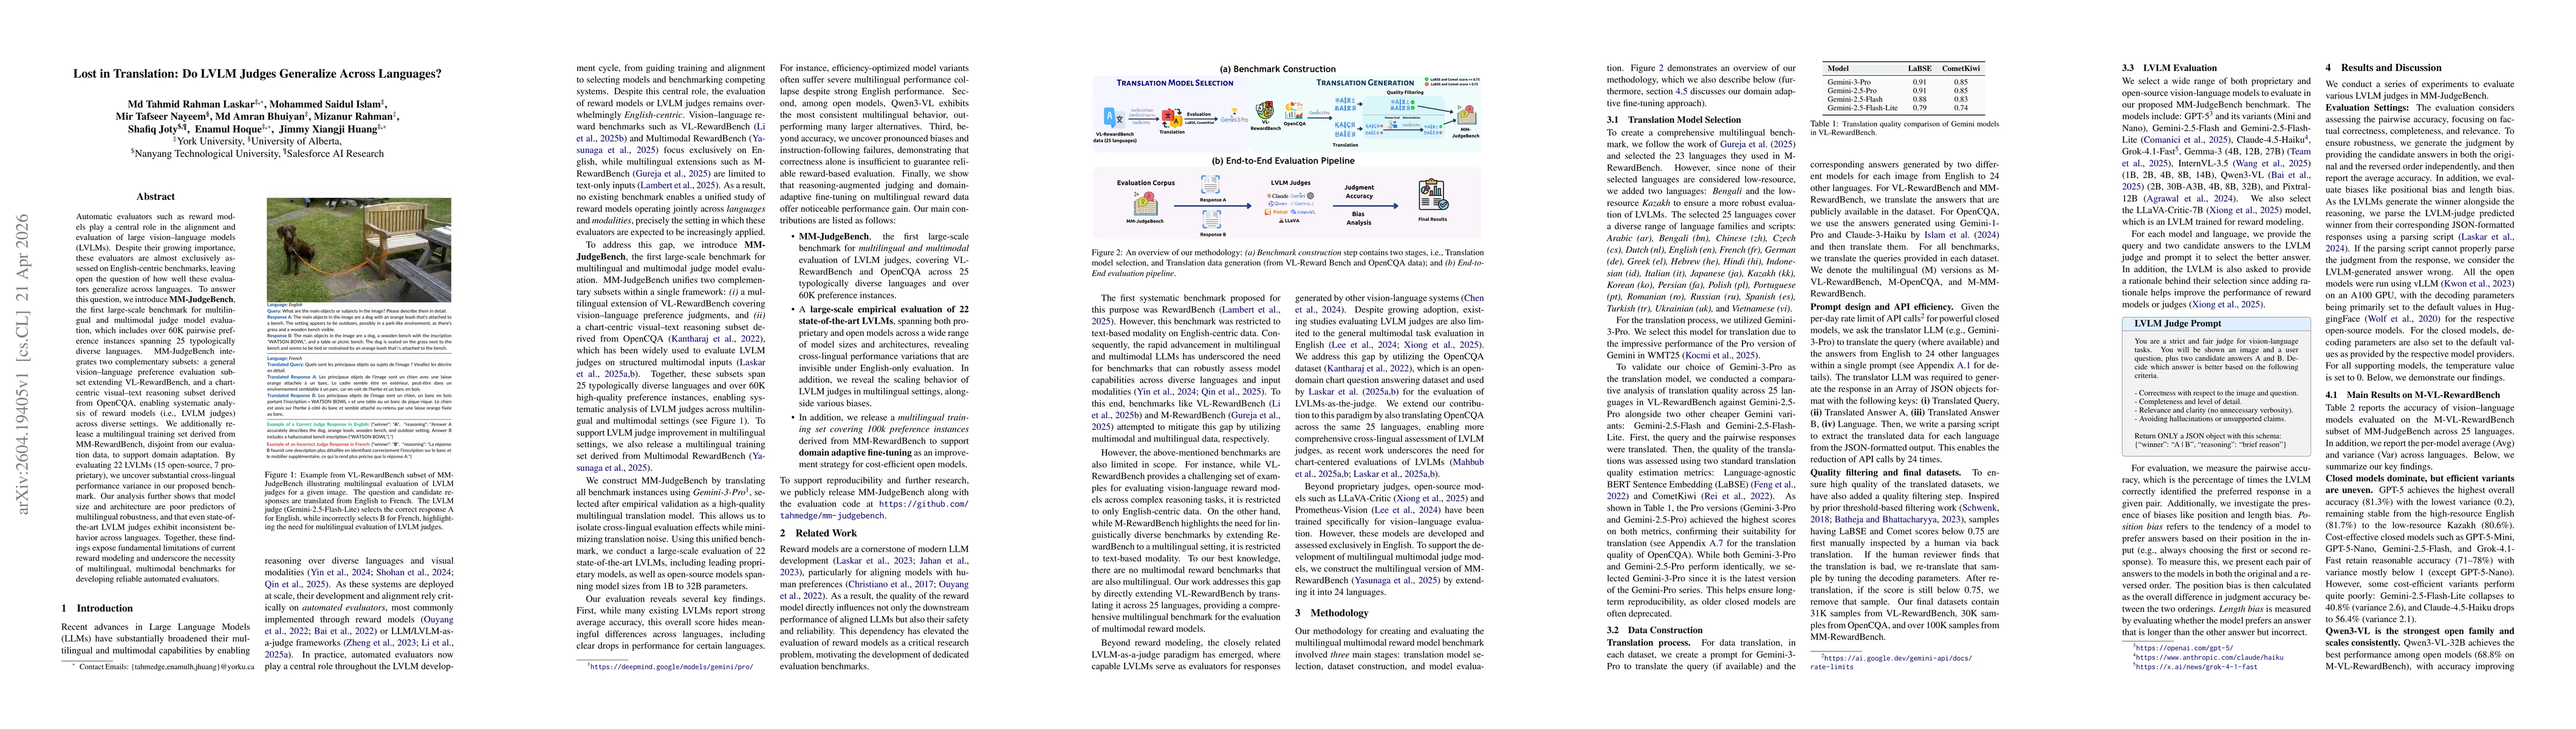
Automatic evaluators such as reward models play a central role in the alignment and evaluation of large vision-language models (LVLMs). Despite their growing importance, these evaluators are almost ex...
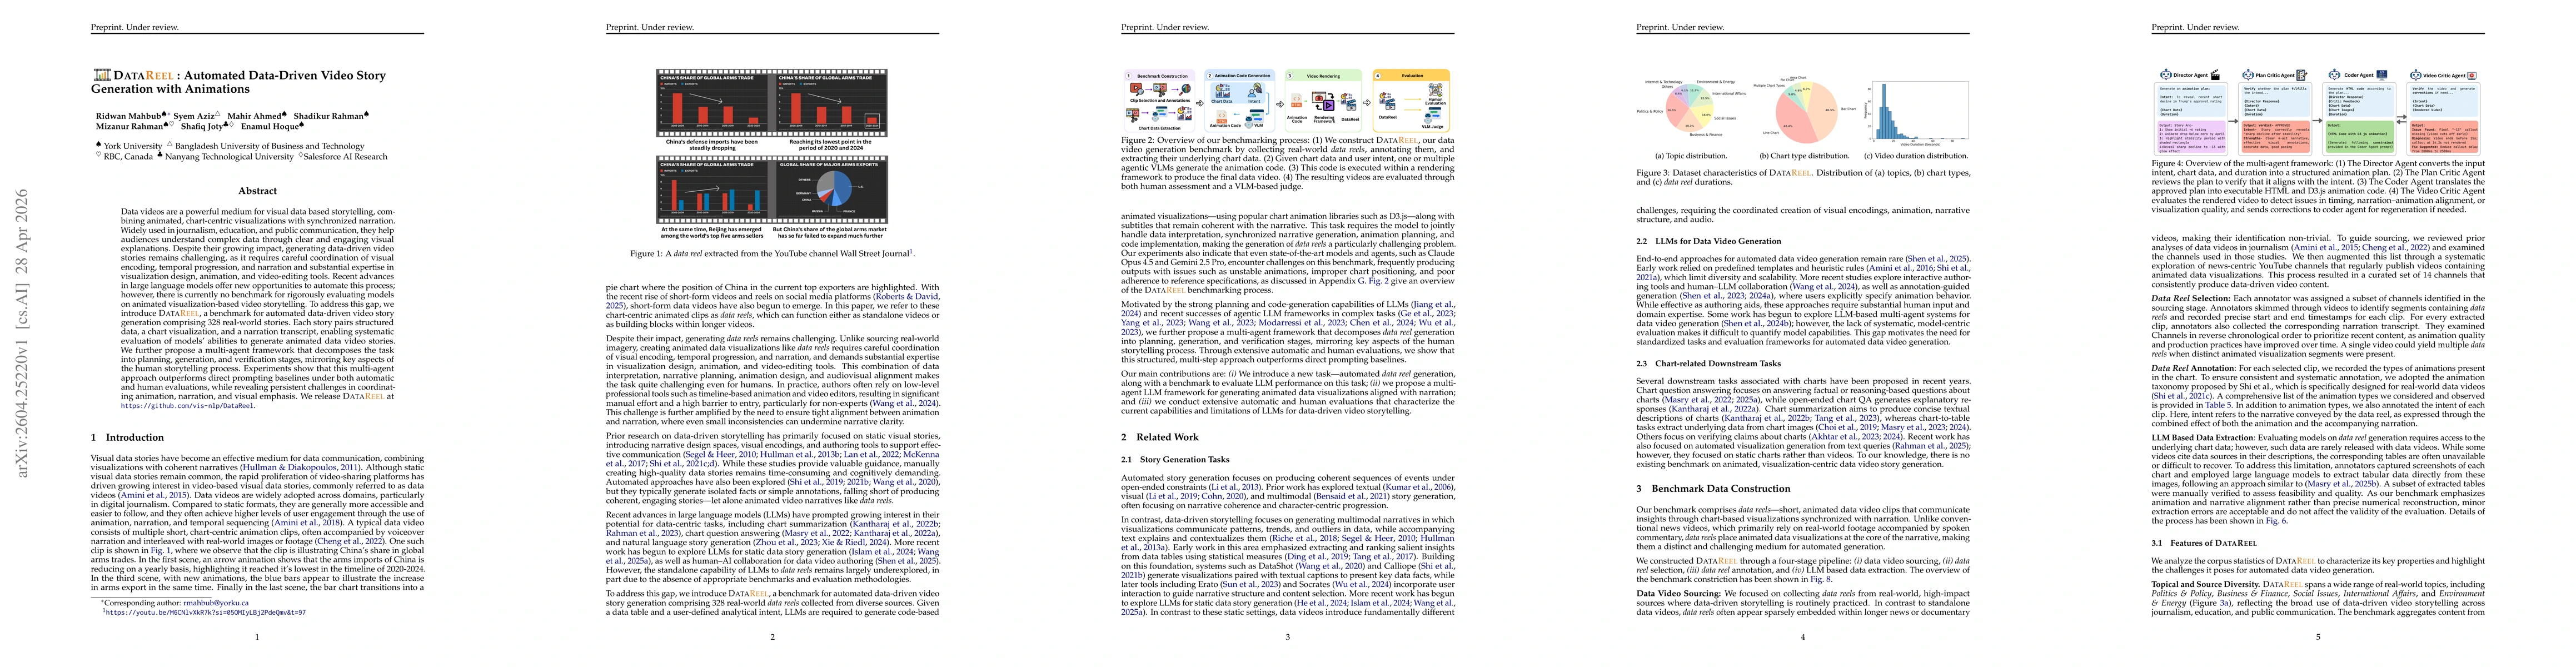
Data videos are a powerful medium for visual data based storytelling, combining animated, chart-centric visualizations with synchronized narration. Widely used in journalism, education, and public com...
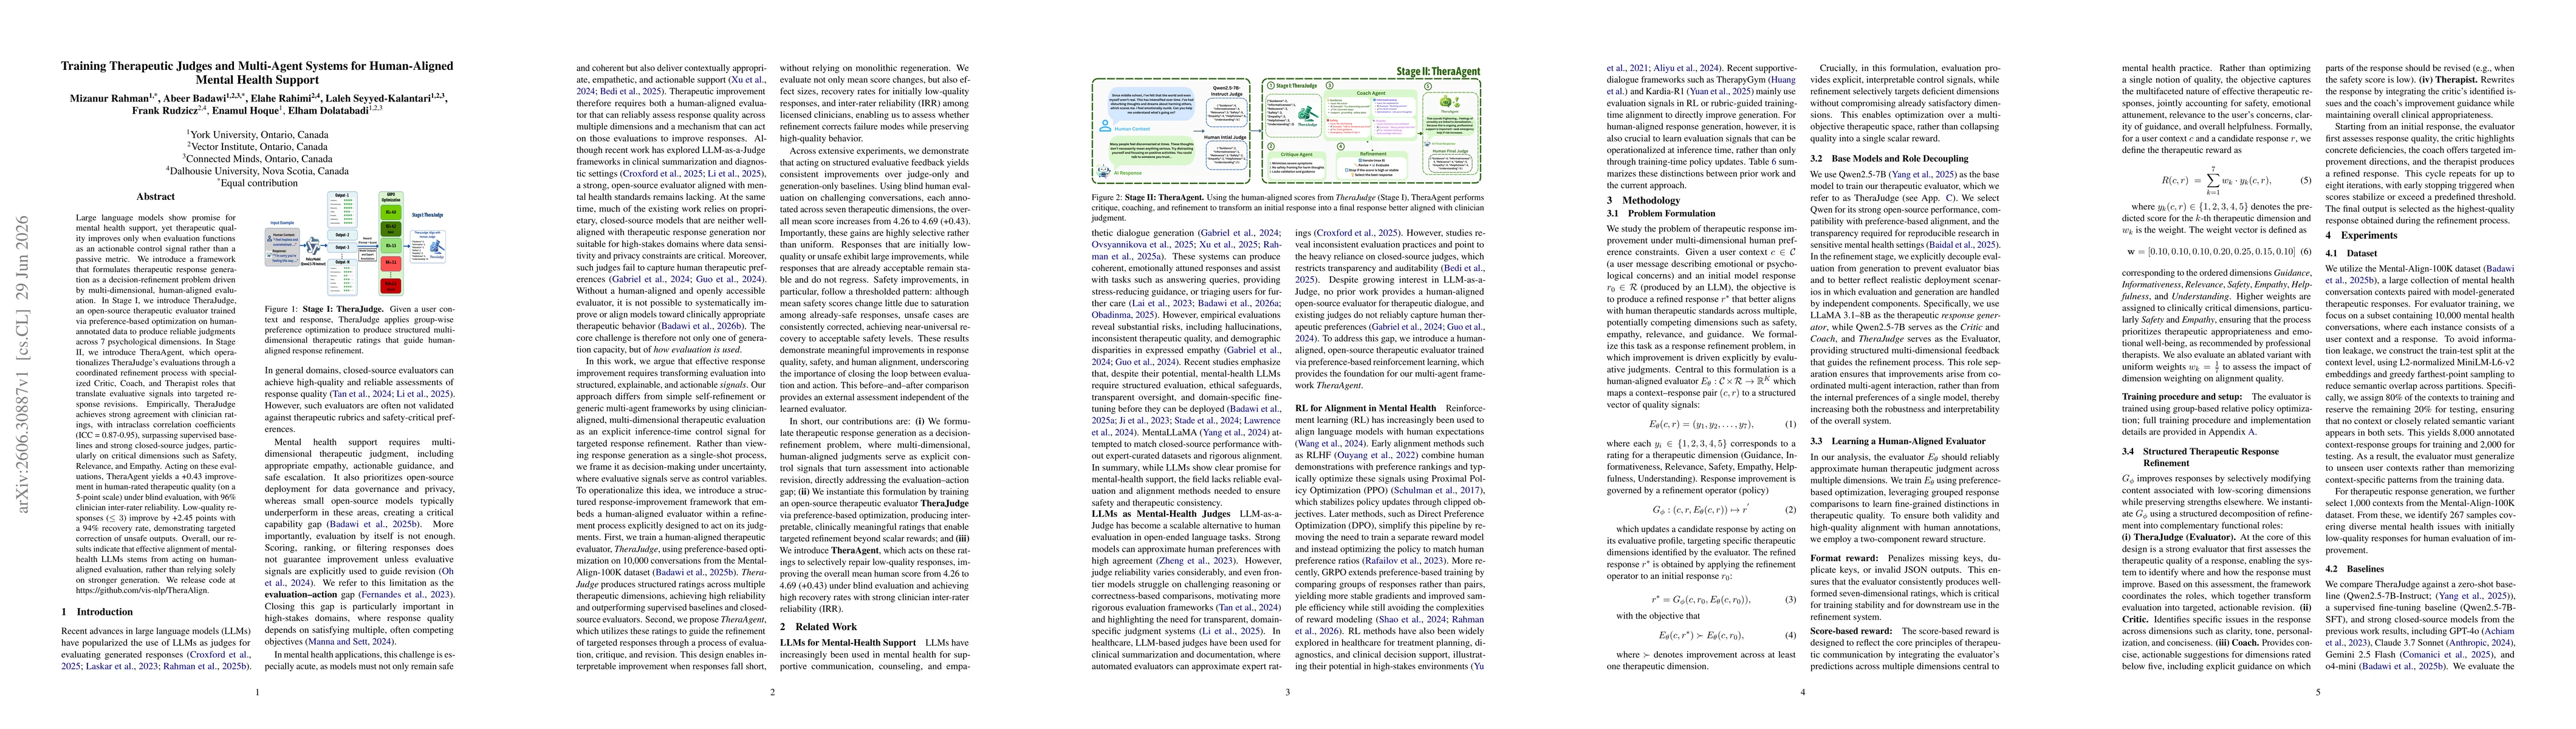
Large language models show promise for mental health support, yet therapeutic quality improves only when evaluation functions as an actionable control signal rather than a passive metric. We introduce...