This paper surveys state-of-the-art methods for generating natural language descriptions for visualizations, categorizing solutions based on five Wh-questions to clarify how, why, and where these descriptions are created and used. It highlights key challenges and future research directions in integrating text and visualizations.
No key terms available for this paper.
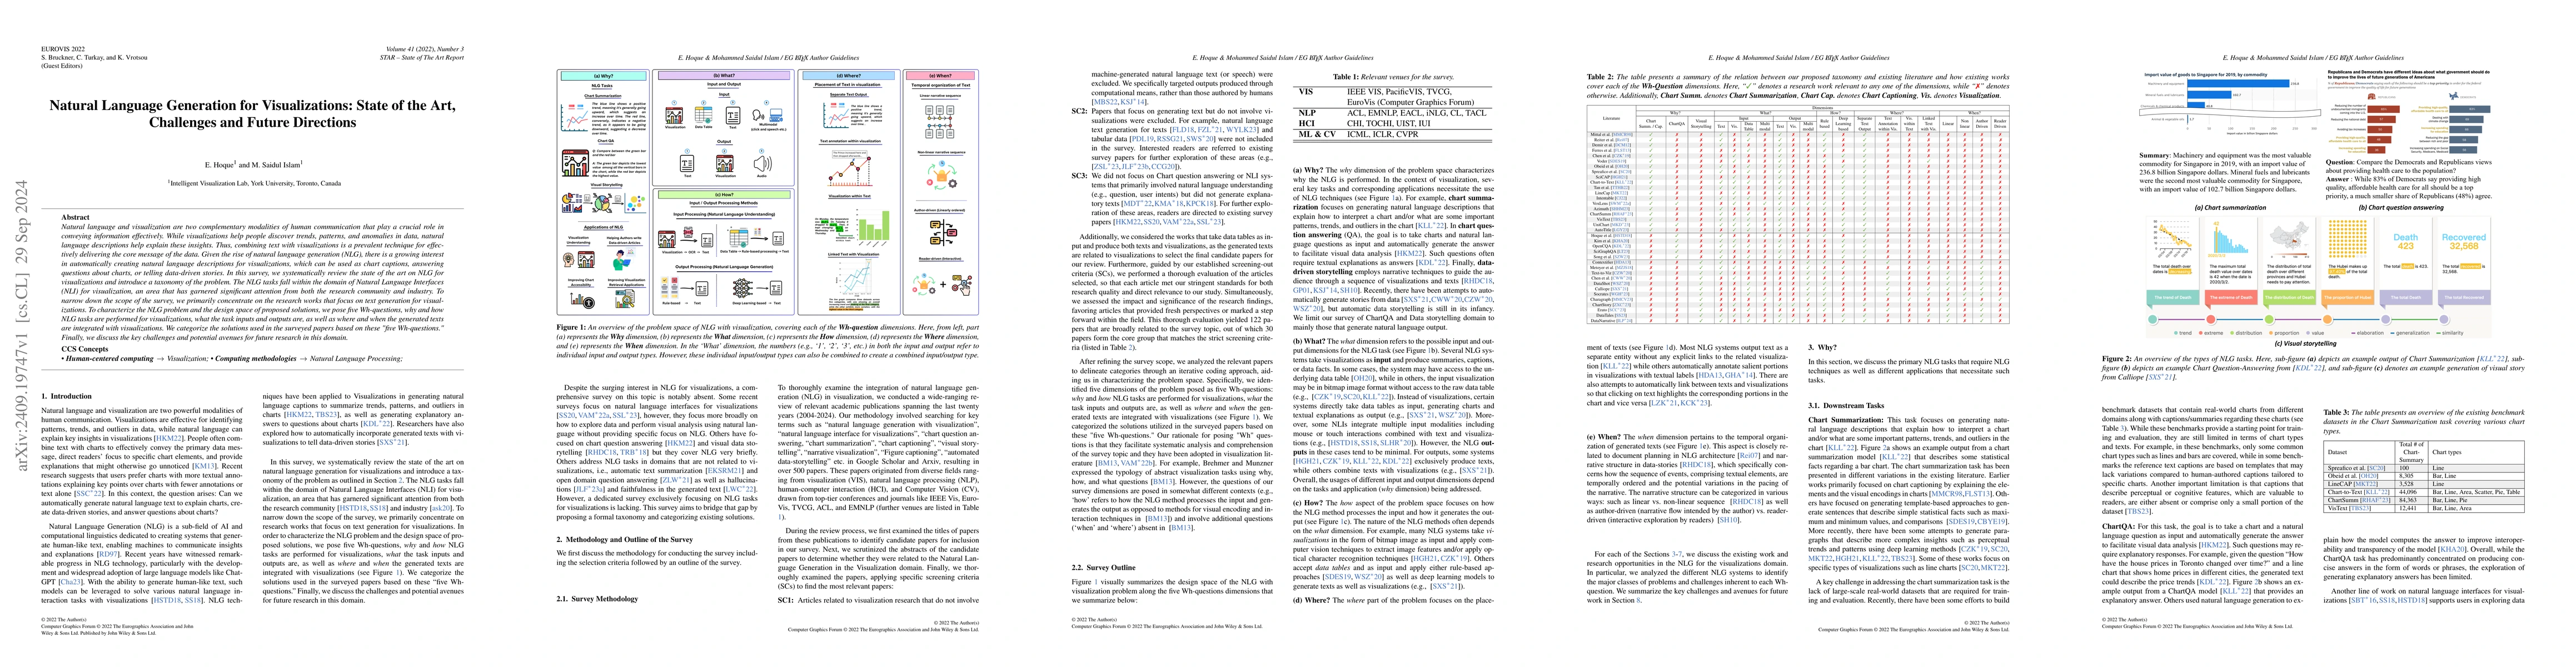
Natural language and visualization are two complementary modalities of human communication that play a crucial role in conveying information effectively. While visualizations help people discover trends, patterns, and anomalies in data, natural language descriptions help explain these insights. Thus, combining text with visualizations is a prevalent technique for effectively delivering the core message of the data. Given the rise of natural language generation (NLG), there is a growing interest in automatically creating natural language descriptions for visualizations, which can be used as chart captions, answering questions about charts, or telling data-driven stories. In this survey, we systematically review the state of the art on NLG for visualizations and introduce a taxonomy of the problem. The NLG tasks fall within the domain of Natural Language Interfaces (NLI) for visualization, an area that has garnered significant attention from both the research community and industry. To narrow down the scope of the survey, we primarily concentrate on the research works that focus on text generation for visualizations. To characterize the NLG problem and the design space of proposed solutions, we pose five Wh-questions, why and how NLG tasks are performed for visualizations, what the task inputs and outputs are, as well as where and when the generated texts are integrated with visualizations. We categorize the solutions used in the surveyed papers based on these "five Wh-questions." Finally, we discuss the key challenges and potential avenues for future research in this domain.
This graph shows how this paper is connected to other research. The current paper is shown in dark gray, papers that cite it are in green, and papers it references are in blue. You can:
• Hover over any node to see the paper title
• Click a node to view that paper's details
• Drag nodes to rearrange the graph
• Use the zoom controls (bottom right) to zoom in/out
Title | Authors | Year | Actions |
---|---|---|---|
A Review on Large Language Models for Visual Analytics
|
Navya Sonal Agarwal, S. K. Sonbhadra
|
2025
|
View Paper |
The Presenter in the Browser: Design and Evaluation of Human Interactive Overlays with Web Content
|
Maxime Cordeil, Anaïs Servais, Guillaume Truong, Tim Dwyer, Dhaval Vyas, Christophe Hurter
|
2025
|
View Paper |
Title | Authors | Year | Actions |
---|---|---|---|
DataNarrative: Automated Data-Driven Storytelling with Visualizations and Texts
|
Mohammed Saidul Islam, Enamul Hoque, Shafiq R. Joty, Md Tahmid Rahman Laskar, Md. Rizwan Parvez
|
2024
|
View Paper |
ChartGemma: Visual Instruction-tuning for Chart Reasoning in the Wild
|
Ahmed Masry, Megh Thakkar, Aayush Bajaj, Aaryaman Kartha, Enamul Hoque, Shafiq R. Joty
|
2024
|
View Paper |
Are Large Vision Language Models up to the Challenge of Chart Comprehension and Reasoning? An Extensive Investigation into the Capabilities and Limitations of LVLMs
|
Mohammed Saidul Islam, Raian Rahman, Ahmed Masry, Md Tahmid Rahman Laskar, Mir Tafseer Nayeem, Enamul Hoque
|
2024
|
View Paper |
Automated Data Visualization from Natural Language via Large Language Models: An Exploratory Study
|
Yang Wu, Yao Wan, Hongyu Zhang, Yulei Sui, Wucai Wei, Wei Zhao, Guandong Xu, Hai Jin
|
2024
|
View Paper |
ChartInstruct: Instruction Tuning for Chart Comprehension and Reasoning
|
Ahmed Masry, Mehrad Shahmohammadi, Md. Rizwan Parvez, Enamul Hoque, Shafiq R. Joty
|
2024
|
View Paper |
Do LLMs Work on Charts? Designing Few-Shot Prompts for Chart Question Answering and Summarization
|
Do Xuan Long, Mohammad Hassanpour, Ahmed Masry, P. Kavehzadeh, Enamul Hoque, Shafiq R. Joty
|
2023
|
View Paper |
Do LVLMs Understand Charts? Analyzing and Correcting Factual Errors in Chart Captioning
|
Kung-Hsiang Huang, Mingyang Zhou, Hou Pong Chan, Y. Fung, Zhenhailong Wang, Lingyu Zhang, Shih-Fu Chang, Heng Ji
|
2023
|
View Paper |
DelucionQA: Detecting Hallucinations in Domain-specific Question Answering
|
Mobashir Sadat, Zhengyu Zhou, Lukas Lange, Jun Araki, Arsalan Gundroo, Bingqing Wang, Rakesh R Menon, Md. Rizwan Parvez, Zhe Feng
|
2023
|
View Paper |
Improving Pacing in Long-Form Story Planning
|
Yichen Wang, Kevin Yang, Xiaoming Liu, Dan Klein
|
2023
|
View Paper |
Holistic Analysis of Hallucination in GPT-4V(ision): Bias and Interference Challenges
|
Chenhang Cui, Yiyang Zhou, Xinyu Yang, Shirley Wu, Linjun Zhang, James Zou, Huaxiu Yao
|
2023
|
View Paper |
Socrates: Data Story Generation via Adaptive Machine-Guided Elicitation of User Feedback
|
Guande Wu, Shunan Guo, J. Hoffswell, G. Chan, R. Rossi, E. Koh
|
2023
|
View Paper |
Azimuth: Designing Accessible Dashboards for Screen Reader Users
|
Arjun Srinivasan, Tim Harshbarger, Darrell Hilliker, Jennifer Mankoff
|
2023
|
View Paper |
Towards Efficient Interaction for Personal Health Data Queries on Smartwatches
|
Bradley Rey, Charles-Olivier Dufresne-Camaro, Pourang Irani
|
2023
|
View Paper |
DATATALES: Investigating the use of Large Language Models for Authoring Data-Driven Articles
|
N. Sultanum, Arjun Srinivasan
|
2023
|
View Paper |
SciGraphQA: A Large-Scale Synthetic Multi-Turn Question-Answering Dataset for Scientific Graphs
|
Sheng Li, Nima Tajbakhsh
|
2023
|
View Paper |
Tackling Hallucinations in Neural Chart Summarization
|
Saad Obaid ul Islam, Iza vSkrjanec, Ondrej Dusek, Vera Demberg
|
2023
|
View Paper |
Marrying Dialogue Systems with Data Visualization: Interactive Data Visualization Generation from Natural Language Conversations
|
Yuanfeng Song, Xuefang Zhao, Raymond Chi-Wing Wong
|
2023
|
View Paper |
PromptMagician: Interactive Prompt Engineering for Text-to-Image Creation
|
Yingchaojie Feng, Xingbo Wang, Kamkwai Wong, Sijia Wang, Yuhong Lu, Minfeng Zhu, Baicheng Wang, Wei Chen
|
2023
|
View Paper |
AutoTitle: An Interactive Title Generator for Visualizations
|
Can Liu, Y. Guo, Xiaoru Yuan
|
2023
|
View Paper |
VisText: A Benchmark for Semantically Rich Chart Captioning
|
Benny J. Tang, Angie Boggust
|
2023
|
View Paper |
Doom or Deliciousness: Challenges and Opportunities for Visualization in the Age of Generative Models
|
V. Schetinger, Sara Di Bartolomeo, Mennatallah El-Assady, A. Mcnutt, M. Miller, J. P. A. Passos, J. L. Adams
|
2023
|
View Paper |
UniChart: A Universal Vision-language Pretrained Model for Chart Comprehension and Reasoning
|
Ahmed Masry, P. Kavehzadeh, Do Xuan Long, Enamul Hoque, Shafiq R. Joty
|
2023
|
View Paper |
Let the Chart Spark: Embedding Semantic Context into Chart with Text-to-Image Generative Model
|
Shishi Xiao, Suizi Huang, Yue Lin, Yilin Ye, Weizhen Zeng
|
2023
|
View Paper |
ChartSumm: A Comprehensive Benchmark for Automatic Chart Summarization of Long and Short Summaries
|
Raian Rahman, Rizvi Hasan, Abdullah Al Farhad, Md Tahmid Rahman Laskar, Md. Hamjajul Ashmafee, A. Kamal
|
2023
|
View Paper |
Charagraph: Interactive Generation of Charts for Realtime Annotation of Data-Rich Paragraphs
|
Damien Masson, Sylvain Malacria, Géry Casiez, Daniel Vogel
|
2023
|
View Paper |
Exploring Chart Question Answering for Blind and Low Vision Users
|
Jiho Kim, Arjun Srinivasan, N. Kim, Yea-Seul Kim
|
2023
|
View Paper |
LIDA: A Tool for Automatic Generation of Grammar-Agnostic Visualizations and Infographics using Large Language Models
|
Victor C. Dibia
|
2023
|
View Paper |
SeeChart: Enabling Accessible Visualizations Through Interactive Natural Language Interface For People with Visual Impairments
|
Md. Zubair Ibne Alam, Shehnaz Islam, Enamul Hoque
|
2023
|
View Paper |
Advocating for a dementia-inclusive visual communication
|
Pei Soo Ang, Siang Lee Yeo, L. Koran
|
2023
|
View Paper |
Reading and Reasoning over Chart Images for Evidence-based Automated Fact-Checking
|
Mubashara Akhtar, O. Cocarascu, E. Simperl
|
2023
|
View Paper |
OpenCQA: Open-ended Question Answering with Charts
|
Shankar Kantharaj, Do Xuan Long, Rixie Tiffany Ko Leong, J. Tan, Enamul Hoque, Shafiq R. Joty
|
2022
|
View Paper |
Pix2Struct: Screenshot Parsing as Pretraining for Visual Language Understanding
|
Kenton Lee, Mandar Joshi, Iulia Turc, Hexiang Hu, Fangyu Liu, Julian Martin Eisenschlos, Urvashi Khandelwal, Peter Shaw, Ming-Wei Chang, Kristina Toutanova
|
2022
|
View Paper |
Intentable: A Mixed-Initiative System for Intent-Based Chart Captioning
|
Ji-Won Choi, Jaemin Jo
|
2022
|
View Paper |
Erato: Cooperative Data Story Editing via Fact Interpolation
|
Mengdi Sun, Ligan Cai, Weiwei Cui, Yanqiu Wu, Yang Shi, Nan Cao
|
2022
|
View Paper |
Augmented Chironomia for Presenting Data to Remote Audiences
|
Brian D. Hall, L. Bartram, M. Brehmer
|
2022
|
View Paper |
Striking a Balance: Reader Takeaways and Preferences when Integrating Text and Charts
|
Chase Stokes, V. Setlur, Bridget Cogley, Arvind Satyanarayan, Marti A. Hearst
|
2022
|
View Paper |
LineCap: Line Charts for Data Visualization Captioning Models
|
Anita Mahinpei, Zona Kostic, Christy Tanner
|
2022
|
View Paper |
ScrollyVis: Interactive Visual Authoring of Guided Dynamic Narratives for Scientific Scrollytelling
|
Eric Mörth, S. Bruckner, N. Smit
|
2022
|
View Paper |
Facilitating Conversational Interaction in Natural Language Interfaces for Visualization
|
Rishab Mitra, Arpit Narechania, A. Endert, J. Stasko
|
2022
|
View Paper |
Chart Question Answering: State of the Art and Future Directions
|
Enamul Hoque, P. Kavehzadeh, Ahmed Masry
|
2022
|
View Paper |
VoxLens: Making Online Data Visualizations Accessible with an Interactive JavaScript Plug-In
|
Ather Sharif, Olivia H. Wang, Alida T. Muongchan, Katharina Reinecke, J. Wobbrock, Jacob O. obbrock
|
2022
|
View Paper |
Misinformed by Visualization: What Do We Learn From Misinformative Visualizations?
|
Leo Yu-Ho Lo, Ayush Gupta, Kento Shigyo, Aoyu Wu, E. Bertini, Huamin Qu
|
2022
|
View Paper |
ChartQA: A Benchmark for Question Answering about Charts with Visual and Logical Reasoning
|
Ahmed Masry, Do Xuan Long, J. Tan, Shafiq R. Joty, Enamul Hoque
|
2022
|
View Paper |
Chart-to-Text: A Large-Scale Benchmark for Chart Summarization
|
Shankar Kanthara, Rixie Tiffany Ko Leong, Xiang Lin, Ahmed Masry, Megh Thakkar, Enamul Hoque, Shafiq R. Joty
|
2022
|
View Paper |
Survey of Hallucination in Natural Language Generation
|
Ziwei Ji, Nayeon Lee, Rita Frieske, Tiezheng Yu, D. Su, Yan Xu, Etsuko Ishii, Yejin Bang, Delong Chen, Wenliang Dai, Andrea Madotto, Pascale Fung
|
2022
|
View Paper |
A Survey of Controllable Text Generation Using Transformer-based Pre-trained Language Models
|
Hanqing Zhang, Haolin Song, Shaoyu Li, Ming Zhou, Dawei Song
|
2022
|
View Paper |
High-Resolution Image Synthesis with Latent Diffusion Models
|
Robin Rombach, A. Blattmann, Dominik Lorenz, Patrick Esser, B. Ommer
|
2021
|
View Paper |
Mobile Data Visualization
|
Bongshin Lee, Raimund Dachselt, Petra Isenberg, E. Choe
|
2021
|
View Paper |
SciCap: Generating Captions for Scientific Figures
|
Ting-Yao Hsu, C. Lee Giles, Ting-Hao 'Kenneth' Huang
|
2021
|
View Paper |
Accessible Visualization via Natural Language Descriptions: A Four-Level Model of Semantic Content
|
Alan Lundgard, Arvind Satyanarayan
|
2021
|
View Paper |
Towards Natural Language Interfaces for Data Visualization: A Survey
|
Leixian Shen, Enya Shen, Yuyu Luo, Xiaocong Yang, Xuming Hu, Xiongshuai Zhang, Zhiwei Tai, Jianmin Wang
|
2021
|
View Paper |
Kori: Interactive Synthesis of Text and Charts in Data Documents
|
Shahid Latif, Zhengzhong Zhou, Yoon Kim, Fabian Beck, N. Kim
|
2021
|
View Paper |
Accessible Visualization: Design Space, Opportunities, and Challenges
|
N. Kim, Shakila Cherise S. Joyner, A. Riegelhuth, Yea-Seul Kim
|
2021
|
View Paper |
Understanding Data Accessibility for People with Intellectual and Developmental Disabilities
|
Keke Wu, Emma Petersen, Tahmina Ahmad, David Burlinson, Shea Tanis, D. Szafir
|
2021
|
View Paper |
ADVISor: Automatic Visualization Answer for Natural-Language Question on Tabular Data
|
Can Liu, Yun Han, Ruike Jiang, Xiaoru Yuan
|
2021
|
View Paper |
ChartStory: Automated Partitioning, Layout, and Captioning of Charts into Comic-Style Narratives
|
Jian Zhao, Shenyu Xu, Senthil K. Chandrasegaran, Chris Bryan, F. Du, Aditi Mishra, Xin Qian, Yiran Li, K. Ma
|
2021
|
View Paper |
Automatic text summarization: A comprehensive survey
|
Wafaa S. El-Kassas, Cherif R. Salama, A. Rafea, H. K. Mohamed
|
2021
|
View Paper |
Unifying Vision-and-Language Tasks via Text Generation
|
Jaemin Cho, Jie Lei, Hao Tan, Mohit Bansal
|
2021
|
View Paper |
Outline to Story: Fine-grained Controllable Story Generation from Cascaded Events
|
Le Fang, Tao Zeng, Chao-Ning Liu, Liefeng Bo, Wen Dong, Changyou Chen
|
2021
|
View Paper |
Retrieving and Reading: A Comprehensive Survey on Open-domain Question Answering
|
Fengbin Zhu, Wenqiang Lei, Chao Wang, Jianming Zheng, Soujanya Poria, Tat-seng Chua
|
2021
|
View Paper |
ChartOCR: Data Extraction from Charts Images via a Deep Hybrid Framework
|
Junyu Luo, Zekun Li, Jinpeng Wang, Chin-Yew Lin
|
2021
|
View Paper |
Designing and Evaluating Multimodal Interactions for Facilitating Visual Analysis With Dashboards
|
I. Chowdhury, Abdul Moeid, Enamul Hoque, M. A. Kabir, Md. Sabir Hossain, Mohammad Mainul Islam
|
2020
|
View Paper |
Sneak Pique: Exploring Autocompletion as a Data Discovery Scaffold for Supporting Visual Analysis
|
V. Setlur, Enamul Hoque, Dae Hyun Kim, Angel X. Chang
|
2020
|
View Paper |
Chart-to-Text: Generating Natural Language Descriptions for Charts by Adapting the Transformer Model
|
Jason Obeid, Enamul Hoque
|
2020
|
View Paper |
Calliope: Automatic Visual Data Story Generation from a Spreadsheet
|
Danqing Shi, Xinyue Xu, F. Sun, Yang Shi, Nan Cao
|
2020
|
View Paper |
Neural Data-Driven Captioning of Time-Series Line Charts
|
Andrea Spreafico, G. Carenini
|
2020
|
View Paper |
NL4DV: A Toolkit for Generating Analytic Specifications for Data Visualization from Natural Language Queries
|
Arpit Narechania, Arjun Srinivasan, J. Stasko
|
2020
|
View Paper |
VizCommender: Computing Text-Based Similarity in Visualization Repositories for Content-Based Recommendations
|
Michael Oppermann, R. Kincaid, T. Munzner
|
2020
|
View Paper |
Investigating Pretrained Language Models for Graph-to-Text Generation
|
Leonardo F. R. Ribeiro, Martin Schmitt, Hinrich Schütze, Iryna Gurevych
|
2020
|
View Paper |
Structural Information Preserving for Graph-to-Text Generation
|
Linfeng Song, Ante Wang, Jinsong Su, Yue Zhang, Kun Xu, Yubin Ge, Dong Yu
|
2020
|
View Paper |
How to Ask What to Say?: Strategies for Evaluating Natural Language Interfaces for Data Visualization
|
Arjun Srinivasan, J. Stasko, Daniel F. Keefe, Melanie Tory
|
2020
|
View Paper |
Evaluation of Text Generation: A Survey
|
Asli Celikyilmaz, Elizabeth Clark, Jianfeng Gao
|
2020
|
View Paper |
AutoCaption: An Approach to Generate Natural Language Description from Visualization Automatically
|
Can Liu, Liwenhan Xie, Yun Han, Datong Wei, Xiaoru Yuan
|
2020
|
View Paper |
Answering Questions about Charts and Generating Visual Explanations
|
Dae Hyun Kim, Enamul Hoque, Maneesh Agrawala
|
2020
|
View Paper |
Touch? Speech? or Touch and Speech? Investigating Multimodal Interaction for Visual Network Exploration and Analysis
|
Ayshwarya Saktheeswaran, Arjun Srinivasan, J. Stasko
|
2020
|
View Paper |
InChorus: Designing Consistent Multimodal Interactions for Data Visualization on Tablet Devices
|
Arjun Srinivasan, Bongshin Lee, N. Riche, S. Drucker, K. Hinckley
|
2020
|
View Paper |
DataShot: Automatic Generation of Fact Sheets from Tabular Data
|
Yun Wang, Zhida Sun, Haidong Zhang, Weiwei Cui, Ke Xu, Xiaojuan Ma, Dongmei Zhang
|
2020
|
View Paper |
Exploring the Limits of Transfer Learning with a Unified Text-to-Text Transformer
|
Colin Raffel, Noam M. Shazeer, Adam Roberts, Katherine Lee, Sharan Narang, Michael Matena, Yanqi Zhou, Wei Li, Peter J. Liu
|
2019
|
View Paper |
Towards Automated Infographic Design: Deep Learning-based Auto-Extraction of Extensible Timeline
|
Zhutian Chen, Yun Wang, Qianwen Wang, Yong Wang, Huamin Qu
|
2019
|
View Paper |
Searching the Visual Style and Structure of D3 Visualizations
|
Enamul Hoque, Maneesh Agrawala
|
2019
|
View Paper |
Text-to-Viz: Automatic Generation of Infographics from Proportion-Related Natural Language Statements
|
Weiwei Cui, Xiaoyu Zhang, Yun Wang, He Huang, B. Chen, Lei Fang, Haidong Zhang, Jian-Guang Lou, Dongmei Zhang
|
2019
|
View Paper |
Figure Captioning with Reasoning and Sequence-Level Training
|
Charles C. Chen, Ruiyi Zhang, Eunyee Koh, Sungchul Kim, Scott D. Cohen, Tong Yu, Razvan C. Bunescu, Razvan C. Bunescu
|
2019
|
View Paper |
Concepts and Techniques
|
Marcia Heiman, Joshua Slomianko
|
2019
|
View Paper |
Augmenting Visualizations with Interactive Data Facts to Facilitate Interpretation and Communication
|
Arjun Srinivasan, S. Drucker, A. Endert, J. Stasko
|
2019
|
View Paper |
Timeline Storyteller: The Design & Deployment of an Interactive Authoring Tool for Expressive Timeline Narratives
|
M. Brehmer, Bongshin Lee, N. Riche, D. Tittsworth, Kate Lytvynets, D. Edge, Christopher M. White
|
2018
|
View Paper |
Facilitating Document Reading by Linking Text and Tables
|
Dae Hyun Kim, Enamul Hoque, Juho Kim, Maneesh Agrawala
|
2018
|
View Paper |
Data-to-Text Generation with Content Selection and Planning
|
Ratish Puduppully, Li Dong, Mirella Lapata
|
2018
|
View Paper |
Hierarchical Neural Story Generation
|
Angela Fan, M. Lewis, Yann Dauphin
|
2018
|
View Paper |
Valletto: A Multimodal Interface for Ubiquitous Visual Analytics
|
Jan-Frederik Kassel, Michael Rohs
|
2018
|
View Paper |
Design Patterns for Data Comics
|
Benjamin Bach, Zezhong Wang, Matteo Farinella, Dave Murray-Rust, N. Riche
|
2018
|
View Paper |
When David Meets Goliath: Combining Smartwatches with a Large Vertical Display for Visual Data Exploration
|
Tom Horak, Sriram Karthik Badam, N. Elmqvist, Raimund Dachselt
|
2018
|
View Paper |
Storytelling and Visualization: An Extended Survey
|
Chao Tong, Richard C. Roberts, R. Borgo, S. Walton, R. Laramee, Kodzo Wegba, Aidong Lu, Yun Wang, Huamin Qu, Qiong Luo, Xiaojuan Ma
|
2018
|
View Paper |
Driving data storytelling from learning design
|
Vanessa Echeverría, Roberto Martínez Maldonado, Roger Granda, Katherine Chiluiza, C. Conati, S. B. Shum
|
2018
|
View Paper |
DataSite: Proactive visual data exploration with computation of insight-based recommendations
|
Zhe Cui, Sriram Karthik Badam, Adil Yalçin, N. Elmqvist
|
2018
|
View Paper |
DVQA: Understanding Data Visualizations via Question Answering
|
Kushal Kafle, Scott D. Cohen, Brian L. Price, Christopher Kanan
|
2018
|
View Paper |
Coupling Story to Visualization: Using Textual Analysis as a Bridge Between Data and Interpretation
|
Ronald A. Metoyer, Qiyu Zhi, Bart Janczuk, W. Scheirer
|
2017
|
View Paper |
FigureQA: An Annotated Figure Dataset for Visual Reasoning
|
Samira Ebrahimi Kahou, Adam Atkinson, Vincent Michalski, Ákos Kádár, Adam Trischler, Yoshua Bengio
|
2017
|
View Paper |
Bottom-Up and Top-Down Attention for Image Captioning and Visual Question Answering
|
Peter Anderson, Xiaodong He, Chris Buehler, Damien Teney, Mark Johnson, Stephen Gould, Lei Zhang
|
2017
|
View Paper |
ChartAccent: Annotation for data-driven storytelling
|
Donghao Ren, M. Brehmer, Bongshin Lee, Tobias Höllerer, E. Choe
|
2017
|
View Paper |
Mask R-CNN
|
Kaiming He, Georgia Gkioxari, Piotr Dollár, Ross B. Girshick
|
2017
|
View Paper |
Eviza: A Natural Language Interface for Visual Analysis
|
V. Setlur, S. Battersby, Melanie Tory, Rich Gossweiler, Angel X. Chang
|
2016
|
View Paper |
Supporting visual exploration for multiple users in large display environments
|
Sriram Karthik Badam, Fereshteh Amini, N. Elmqvist, Pourang Irani
|
2016
|
View Paper |
Mastering the game of Go with deep neural networks and tree search
|
David Silver, Aja Huang, Chris J. Maddison, A. Guez, L. Sifre, George van den Driessche, Julian Schrittwieser, Ioannis Antonoglou, Vedavyas Panneershelvam, Marc Lanctot, S. Dieleman, Dominik Grewe, John Nham, Nal Kalchbrenner, I. Sutskever, T. Lillicrap, M. Leach, K. Kavukcuoglu, T. Graepel, D. Hassabis
|
2016
|
View Paper |
Faster R-CNN: Towards Real-Time Object Detection with Region Proposal Networks
|
Shaoqing Ren, Kaiming He, Ross B. Girshick, Jian Sun
|
2015
|
View Paper |
NewsViews: an automated pipeline for creating custom geovisualizations for news
|
Tong Gao, J. Hullman, Eytan Adar, Brent J. Hecht, N. Diakopoulos
|
2014
|
View Paper |
Extracting references between text and charts via crowdsourcing
|
Nicholas Kong, Marti A. Hearst, Maneesh Agrawala
|
2014
|
View Paper |
A Multi-Level Typology of Abstract Visualization Tasks
|
M. Brehmer, T. Munzner
|
2013
|
View Paper |
A Deeper Understanding of Sequence in Narrative Visualization
|
J. Hullman, S. Drucker, N. Riche, Bongshin Lee, Danyel Fisher, Eytan Adar
|
2013
|
View Paper |
Evaluating a Tool for Improving Accessibility to Charts and Graphs
|
L. Ferres, G. Lindgaard, Livia Sumegi, Bruce Tsuji
|
2013
|
View Paper |
Towards retrieving relevant information graphics
|
Zhuo Li, Matthew Stagitis, S. Carberry, Kathleen F. McCoy
|
2013
|
View Paper |
Storytelling: The Next Step for Visualization
|
Robert Kosara, J. Mackinlay
|
2013
|
View Paper |
Contextifier: automatic generation of annotated stock visualizations
|
J. Hullman, N. Diakopoulos, Eytan Adar
|
2013
|
View Paper |
Understanding Pen and Touch Interaction for Data Exploration on Interactive Whiteboards
|
Jagoda Walny, Bongshin Lee, Paul Johns, N. Riche, Sheelagh Carpendale
|
2012
|
View Paper |
A Survey of Monte Carlo Tree Search Methods
|
C. Browne, E. Powley, D. Whitehouse, S. Lucas, P. Cowling, Philipp Rohlfshagen, Stephen Tavener, Diego Perez Liebana, Spyridon Samothrakis, S. Colton
|
2012
|
View Paper |
Narrative Visualization: Telling Stories with Data
|
E. Segel, Jeffrey Heer
|
2010
|
View Paper |
An Architecture for Data-to-Text Systems
|
Ehud Reiter
|
2007
|
View Paper |
AutoBrief: an experimental system for the automatic generation of briefings in integrated text and information graphics
|
N. Green, G. Carenini, S. Kerpedjiev, Joe Mattis, Johanna D. Moore, Steven F. Roth
|
2004
|
View Paper |
What storytelling can do for information visualization
|
N. Gershon, Ward Page
|
2001
|
View Paper |
Describing Complex Charts in Natural Language: A Caption Generation System
|
Vibhu Mittal, Johanna D. Moore, G. Carenini, Steven F. Roth
|
1998
|
View Paper |
Building applied natural language generation systems
|
Ehud Reiter, R. Dale
|
1997
|
View Paper |
Scientific Chart Summarization: Datasets and Improved Text Modeling
|
Hao Tan, Chen-Tse Tsai, Yujie He, Mohit Bansal
|
2022
|
View Paper |
The Why and The How: A Survey on Natural Language Interaction in Visualization
|
Henrik Voigt, Ozge Alacam, M. Meuschke, K. Lawonn, Sina Zarrieß
|
2022
|
View Paper |
BERT: Pre-training of Deep Bidirectional Transformers for Language Understanding
|
Jacob Devlin, Ming-Wei Chang, Kenton Lee, Kristina Toutanova
|
2019
|
View Paper |
Language Models are Unsupervised Multitask Learners
|
Alec Radford, Jeff Wu, R. Child, D. Luan, Dario Amodei, I. Sutskever
|
2019
|
View Paper |
Orko: Facilitating Multimodal Interaction for Visual Exploration and Analysis of Networks
|
Arjun Srinivasan, J. Stasko
|
2018
|
View Paper |
Applying Pragmatics Principles for Interaction with Visual Analytics
|
Enamul Hoque, V. Setlur, Melanie Tory, I. Dykeman
|
2018
|
View Paper |
Data-Driven Storytelling
|
N. Riche, C. Hurter, N. Diakopoulos, Sheelagh Carpendale
|
2017
|
View Paper |
Short biographies of the authors
|
H. Shadi
|
2017
|
View Paper |
Aggre-gated residual transformations for deep neural networks
|
2017
|
||
VisJockey : Enriching Data Stories through Orchestrated Interactive Visualization
|
Bum Chul Kwon, Florian Stoffel, Dominik Jäckle, Bongshin Lee, D. Keim
|
2014
|
View Paper |
Summarizing Information Graphics Textually
|
Seniz Demir, S. Carberry, Kathleen F. McCoy
|
2012
|
View Paper |
What is This? Downloaded from
|
2011
|
View Paper | |
Faith-fulness in natural language generation: A systematic survey of analysis, evaluation and optimization methods, 2022
|
|||
SC2: Papers that focus on generating text but do not involve visualizations were excluded
|
|||
Tableau’s Ask Data
|
|||
Bloomberg story
|
|||
Visual instruction tuning, 2023
|
|||
is pursuing Master’s in Computer Science at York University under the supervision of Enamul Hoque
|
|||
answering [HKM22, KHA20, KDL ∗ 22, MDT ∗ 22]
|
|||
X. E
|
|||
Emphasischecker: A tool for guiding chart and caption emphasis, 2023
|
|||
Accessible visualization ©2022TheAuthor(s)ComputerGraphicsForum©2022TheEurographicsAssociationandJohnWiley
|
Showing first page preview. Click "Open Full PDF" to view the complete paper.
Sandro Pezzelle, Raquel Fernández, Aditya K Surikuchi
Published: 2025-02-18
Diksha Khurana, Aditya Koli, Kiran Khatter, Sukhdev Singh
Published: 2022-08-01
Yilin Ye, Wei Zeng, Shishi Xiao, Zhan Wang, Yuyu Luo, Jianing Hao, Yihan Hou
Published: 2024-04-30
You need to log in to post a comment.
Your comment contains inappropriate language.
Are you sure you want to remove this tag?
Someone just favorited a paper!
Comments (0)