Publication
Metrics
AI Quick Summary
SeeChart is an interactive tool that converts web-based charts into accessible audio summaries for people with visual impairments, addressing the lack of alt texts. Evaluations showed it effectively reduces cognitive load and enhances understanding of chart insights.
Paper Preview
Abstract
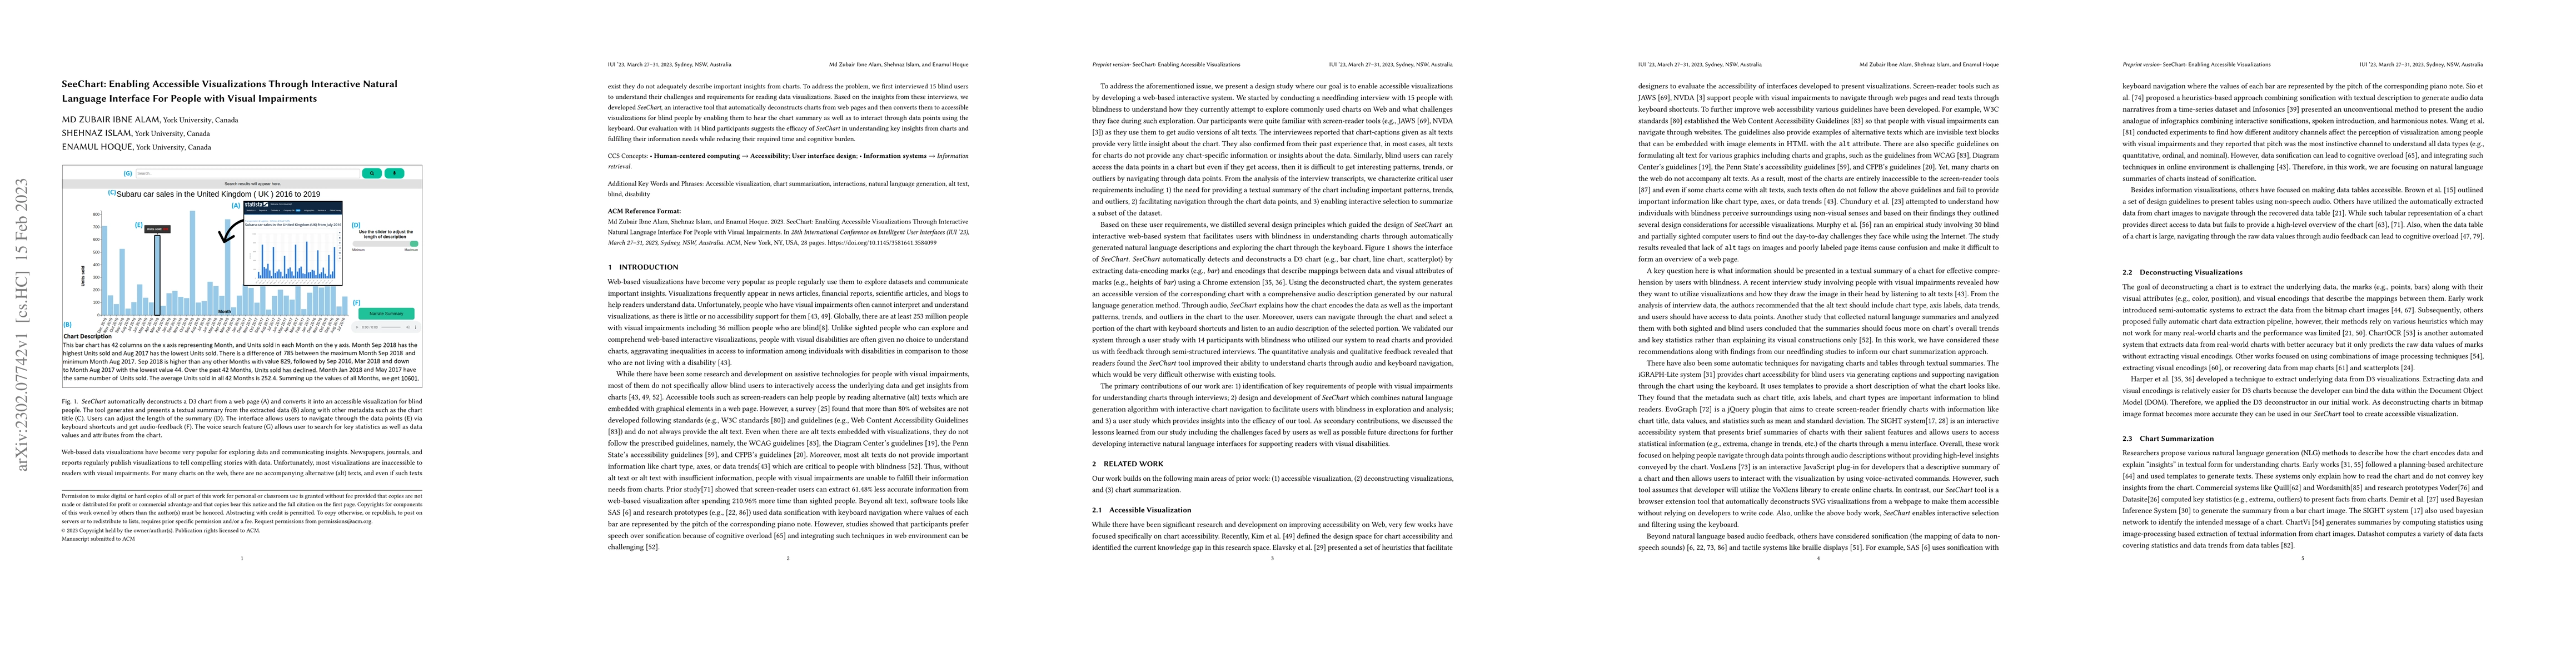
Web-based data visualizations have become very popular for exploring data and communicating insights. Newspapers, journals, and reports regularly publish visualizations to tell compelling stories with data. Unfortunately, most visualizations are inaccessible to readers with visual impairments. For many charts on the web, there are no accompanying alternative (alt) texts, and even if such texts exist they do not adequately describe important insights from charts. To address the problem, we first interviewed 15 blind users to understand their challenges and requirements for reading data visualizations. Based on the insights from these interviews, we developed SeeChart, an interactive tool that automatically deconstructs charts from web pages and then converts them to accessible visualizations for blind people by enabling them to hear the chart summary as well as to interact through data points using the keyboard. Our evaluation with 14 blind participants suggests the efficacy of SeeChart in understanding key insights from charts and fulfilling their information needs while reducing their required time and cognitive burden.
AI Key Findings
Get AI-generated insights about this paper's methodology, results, significance, and more — seven facets brought into focus.
Impact
Paper Details
Authors
PDF Preview
Key Terms
Citation Network
Current paper (gray), citations (green), references (blue)
Display is limited for performance on very large graphs.
Discussion 0