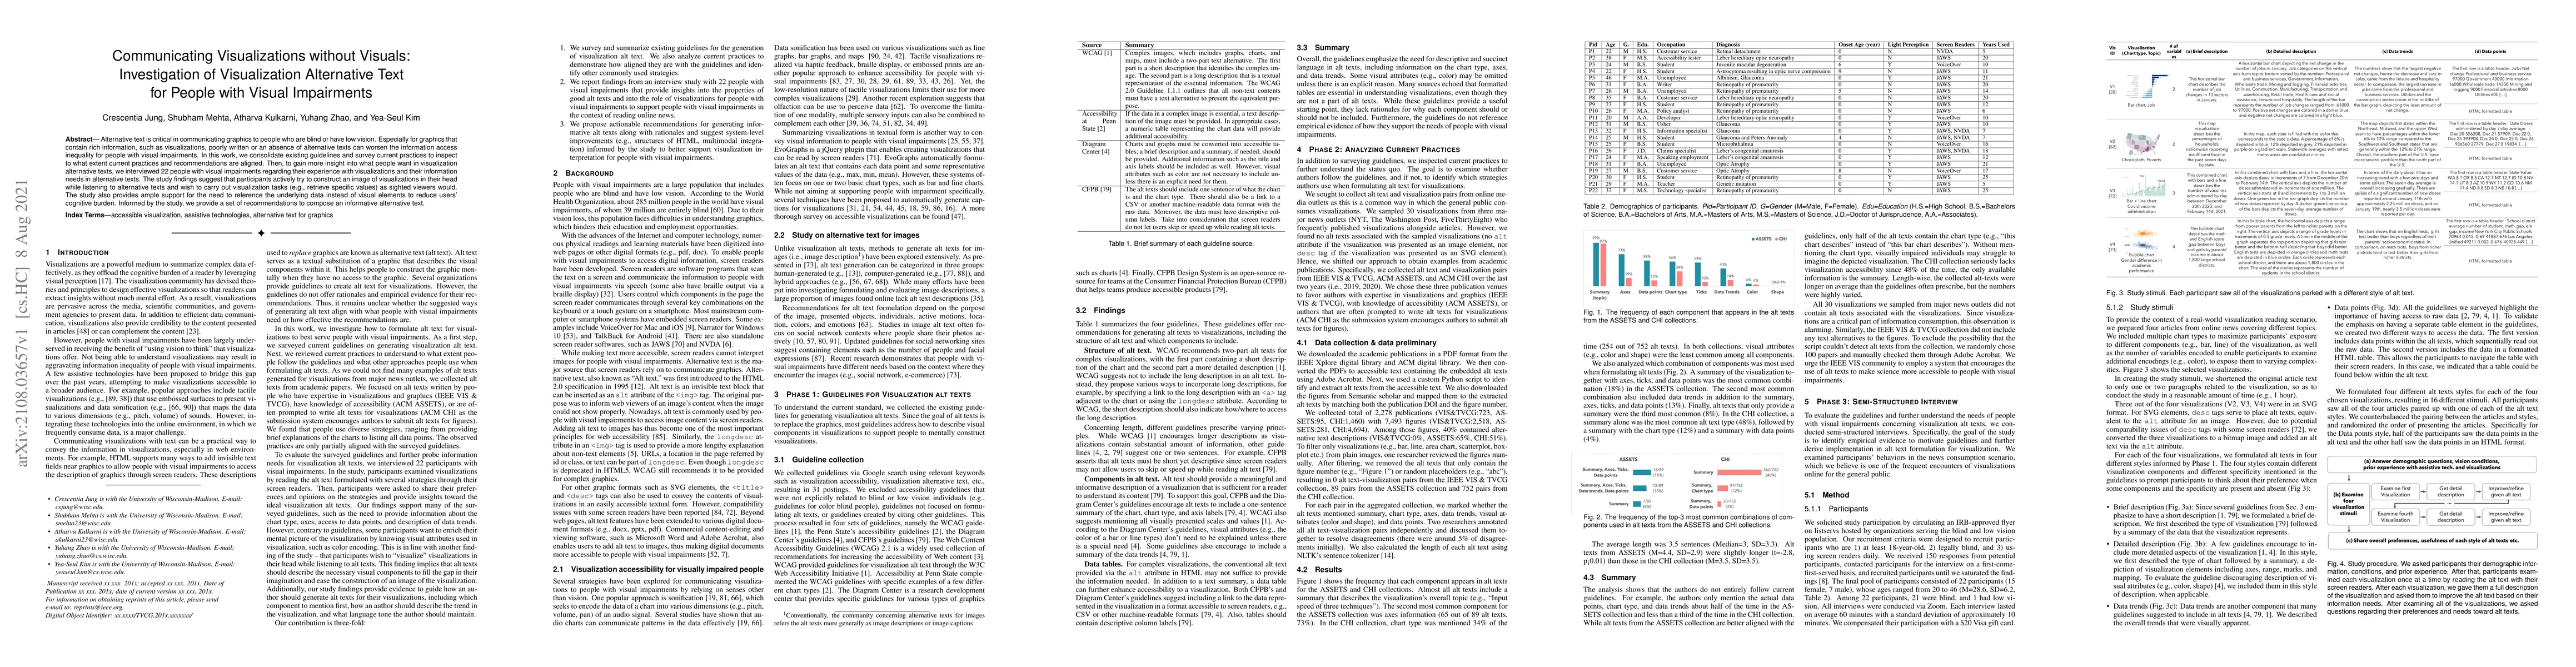
This paper investigates how to effectively communicate visualizations to people with visual impairments through alternative text. Findings from interviews with 22 visually impaired individuals highlight the need for alternative texts that reference underlying data, rather than visual elements, to reduce cognitive load and enable visualization tasks.
Alternative text is critical in communicating graphics to people who are blind or have low vision. Especially for graphics that contain rich information, such as visualizations, poorly written or an absence of alternative texts can worsen the information access inequality for people with visual impairments. In this work, we consolidate existing guidelines and survey current practices to inspect to what extent current practices and recommendations are aligned. Then, to gain more insight into what people want in visualization alternative texts, we interviewed 22 people with visual impairments regarding their experience with visualizations and their information needs in alternative texts. The study findings suggest that participants actively try to construct an image of visualizations in their head while listening to alternative texts and wish to carry out visualization tasks (e.g., retrieve specific values) as sighted viewers would. The study also provides ample support for the need to reference the underlying data instead of visual elements to reduce users' cognitive burden. Informed by the study, we provide a set of recommendations to compose an informative alternative text.
This graph shows how this paper is connected to other research. The current paper is shown in dark gray, papers that cite it are in green, and papers it references are in blue. You can:
• Hover over any node to see the paper title
• Click a node to view that paper's details
• Drag nodes to rearrange the graph
• Use the zoom controls (bottom right) to zoom in/out
Title | Authors | Year | Actions |
---|---|---|---|
Accessible Text Descriptions for UpSet Plots
|
Andrew McNutt, Maggie K McCracken, Ishrat Jahan Eliza, Daniel Hajas, Jake Wagoner, Nate Lanza, Jack Wilburn, Sarah H. Creem-Regehr, Alexander Lex
|
2025
|
View Paper |
Pluto: Authoring Semantically Aligned Text and Charts for Data-Driven Communication
|
Arjun Srinivasan, V. Setlur, Arvind Satyanarayan
|
2025
|
View Paper |
AltGosling: automatic generation of text descriptions for accessible genomics data visualization
|
Thomas C. Smits, S. L’Yi, Andrew P. Mar, Nils Gehlenborg
|
2024
|
View Paper |
Accessible Text Descriptions for UpSet Plots
|
Ishrat Jahan Eliza, Jake Wagoner, Jack Wilburn, Nate Lanza, Daniel Hajas, Alexander Lex
|
2024
|
View Paper |
Explaining Unfamiliar Genomics Data Visualizations to a Blind Individual through Transitions
|
Thomas C. Smits, S. L’Yi, Huyen N. Nguyen, Andrew P. Mar, Nils Gehlenborg
|
2024
|
View Paper |
From Graphs to Words: A Computer-Assisted Framework for the Production of Accessible Text Descriptions
|
Qiang Xu, Thomas Hurtut
|
2024
|
View Paper |
Anonymization-Based Method for Privacy-Preservation of Users in Internet Services
|
Dardan Maraj, Marin Vuković
|
2024
|
View Paper |
Identifying the Information Gap for Visually Impaired Students during Lecture Talks
|
Katharina Anderer, Matthias Wölfel, Jan Niehues
|
2024
|
View Paper |
When Refreshable Tactile Displays Meet Conversational Agents: Investigating Accessible Data Presentation and Analysis with Touch and Speech
|
Samuel Reinders, Matthew Butler, Ingrid Zukerman, Bongshin Lee, Lizhen Qu, Kim Marriott
|
2024
|
View Paper |
SaGol: Using MiniGPT-4 to Generate Alt Text for Improving Image Accessibility
|
Yunseo Moon, Hyunmin Lee, S. Oh, Hyunggu Jung
|
2024
|
View Paper |
AltGeoViz: Facilitating Accessible Geovisualization
|
Chu Li, Rock Yuren Pang, Ather Sharif, Arnavi Chheda-Kothary, Jeffrey Heer, Jon E. Froehlich
|
2024
|
View Paper |
AltChart: Enhancing VLM-based Chart Summarization Through Multi-Pretext Tasks
|
Omar Moured, Jiaming Zhang, M. Sarfraz, Rainer Stiefelhagen
|
2024
|
View Paper |
How Do Low-Vision Individuals Experience Information Visualization?
|
Yanan Wang, Yuhang Zhao, Yea-Seul Kim
|
2024
|
View Paper |
Designing Unobtrusive Modulated Electrotactile Feedback on Fingertip Edge to Assist Blind and Low Vision (BLV) People in Comprehending Charts
|
Chutian Jiang, Yinan Fan, Junan Xie, Emily Kuang, Kaihao Zhang, Mingming Fan
|
2024
|
View Paper |
Investigating The Upward Trend of Social Media and Assistive Technology Usage Among Persons with Visual Impairment
|
Mahnoor Irshad, Dr. Afshan Rahat, Dr. Riffat Tahira
|
2024
|
View Paper |
Evaluating the Accessibility of Banking Web Sites in Malaysia Using Wave
|
Bavani Ramayah, Joseph Chan JianMin
|
2023
|
View Paper |
TactualPlot: Spatializing Data as Sound Using Sensory Substitution for Touchscreen Accessibility
|
Pramod Chundury, Yasmin Reyazuddin, J. Jordan, Jonathan Lazar, N. Elmqvist
|
2023
|
View Paper |
VizAbility: Multimodal Accessible Data Visualization with Keyboard Navigation and Conversational Interaction
|
Joshua Gorniak, Jacob Ottiger, Donglai Wei, Nam Wook Kim
|
2023
|
View Paper |
Azimuth: Designing Accessible Dashboards for Screen Reader Users
|
Arjun Srinivasan, Tim Harshbarger, Darrell Hilliker, Jennifer Mankoff
|
2023
|
View Paper |
A Large-Scale Mixed-Methods Analysis of Blind and Low-vision Research in ACM and IEEE
|
Y. Thoo, Maximiliano Jeanneret Medina, Jon E. Froehlich, Jeanneret Medina
|
2023
|
View Paper |
Speaking with My Screen Reader: Using Audio Fictions to Explore Conversational Access to Interfaces
|
Mahika Phutane, Crescentia Jung, Niu Chen, Shiri Azenkot
|
2023
|
View Paper |
VizAbility: Enhancing Chart Accessibility with LLM-based Conversational Interaction
|
Joshua Gorniak, Yoon Kim, Donglai Wei, Nam Wook Kim
|
2023
|
View Paper |
What Does the Chart Say? Grouping Cues Guide Viewer Comparisons and Conclusions in Bar Charts
|
Cindy Xiong Bearfield, Chase Stokes, Andrew Lovett, Steven Franconeri
|
2023
|
View Paper |
Key Issues Affecting the Inclusion of Alt Text in Scholarly PDF Publications
|
Beth Richard
|
2023
|
View Paper |
Data Navigator: An Accessibility-Centered Data Navigation Toolkit
|
Frank Elavsky, Lucas Nadolskis, Dominik Moritz
|
2023
|
View Paper |
Making Data-Driven Articles more Accessible: An Active Preference Learning Approach to Data Fact Personalization
|
Yanan Wang, Yea-Seul Kim
|
2023
|
View Paper |
VisText: A Benchmark for Semantically Rich Chart Captioning
|
Benny J. Tang, Angie Boggust
|
2023
|
View Paper |
Beyond Alternative Text and tables: Comparative Analysis of Visualization Tools and Accessibility Methods
|
Nam Wook Kim, Grace Ataguba, Shakila Cherise S. Joyner, Chuangdian Zhao, Hyejin Im
|
2023
|
View Paper |
Description of dynamic images: a systematic mapping for the understanding and transparency of information that may be perceptible visually impaired citizens
|
João Marcelo dos Santos Marques, Simone Bacellar Leal Ferreira
|
2023
|
View Paper |
Towards accessible chart visualizations for the non-visuals: Research, applications and gaps
|
Mandhatya Singh, Muhammad Suhaib Kanroo, Hadia Showkat Kawoosa, Puneet Goyal
|
2023
|
View Paper |
“Explain What a Treemap is”: Exploratory Investigation of Strategies for Explaining Unfamiliar Chart to Blind and Low Vision Users
|
Gye-Gyoung Kim, Jiho Kim, Yea-Seul Kim
|
2023
|
View Paper |
Exploring Chart Question Answering for Blind and Low Vision Users
|
Jiho Kim, Arjun Srinivasan, N. Kim, Yea-Seul Kim
|
2023
|
View Paper |
Accessible Data Representation with Natural Sound
|
Md. Naimul Hoque, Md Ehtesham-Ul-Haque, N. Elmqvist, Syed Masum Billah
|
2023
|
View Paper |
Chart Reader: Accessible Visualization Experiences Designed with Screen Reader Users
|
John Thompson, Jesse J Martinez, Alper Sarıkaya, Edward Cutrell, Bongshin Lee
|
2023
|
View Paper |
What is the message? Perspectives on Visual Data Communication
|
Laura Koesten, Kathleen Gregory, Regina Schuster, Christian Knoll, Sarah Davies, T. Möller
|
2023
|
View Paper |
Crowdsourcing Thumbnail Captions: Data Collection and Validation
|
Carlos Alejandro Aguirre, Shiye Cao, Amama Mahmood, Chien-Ming Huang
|
2023
|
View Paper |
SeeChart: Enabling Accessible Visualizations Through Interactive Natural Language Interface For People with Visual Impairments
|
Md. Zubair Ibne Alam, Shehnaz Islam, Enamul Hoque
|
2023
|
View Paper |
Generating colorblind-friendly scatter plots for single-cell data
|
Tejas Guha, E. Fertig, Atul Deshpande
|
2022
|
View Paper |
Photosensitive Accessibility for Interactive Data Visualizations
|
Laura South, M. Borkin
|
2022
|
View Paper |
The Accessibility of Data Visualizations on the Web for Screen Reader Users: Practices and Experiences During COVID-19
|
Danyang Fan, Alexa Fay Siu, Hrishikesh V. Rao, Gene S.-H. Kim, Xavier Vazquez, Lucy Greco, Sile O'Modhrain, Sean Follmer
|
2022
|
View Paper |
Striking a Balance: Reader Takeaways and Preferences when Integrating Text and Charts
|
Chase Stokes, V. Setlur, Bridget Cogley, Arvind Satyanarayan, Marti A. Hearst
|
2022
|
View Paper |
“So What? What's That to Do With Me?” Expectations of People With Visual Impairments for Image Descriptions in Their Personal Photo Activities
|
Ju-Yeon Jung, Tom Steinberger, Junbeom Kim, M. Ackerman
|
2022
|
View Paper |
Seeing Through Sounds: Mapping Auditory Dimensions to Data and Charts for People with Visual Impairments
|
R. Wang, C. Jung, Y. Kim
|
2022
|
View Paper |
How accessible is my visualization? Evaluating visualization accessibility with Chartability
|
Frank Elavsky, Cynthia L. Bennett, Dominik Moritz
|
2022
|
View Paper |
Rich Screen Reader Experiences for Accessible Data Visualization
|
Jonathan Zong, Crystal Lee, Alan Lundgard, JiWoong Jang, Daniel Hajas, Arvind Satyanarayan
|
2022
|
View Paper |
How Do Captions Affect Visualization Reading?
|
S. Cheng, Hazel Zhu, Eugene Wu
|
2022
|
View Paper |
What makes web data tables accessible? Insights and a tool for rendering accessible tables for people with visual impairments
|
Yanan Wang, Ruobin Wang, C. Jung, Yea-Seul Kim
|
2022
|
View Paper |
Visualization Accessibility in the Wild: Challenges Faced by Visualization Designers
|
Shakila Cherise S. Joyner, A. Riegelhuth, Kathleen Garrity, Yea-Seul Kim, N. Kim
|
2022
|
View Paper |
Toward supporting quality alt text in computing publications
|
Candace Williams, Lilian de Greef, E. Harris, Leah Findlater, Amy Pavel, Cynthia L. Bennett
|
2022
|
View Paper |
Crowdsourcing Thumbnail Captions via Time-Constrained Methods
|
Carlos Alejandro Aguirre, Amama Mahmood, Chien-Ming Huang
|
2022
|
View Paper |
scatterHatch: an R/Bioconductor package for generating colorblind-friendly scatter plots for single-cell data
|
Tejas Guha, E. Fertig, Atul Deshpande
|
2021
|
View Paper |
"Customization is Key": Four Characteristics of Textual Affordances for Accessible Data Visualization
|
Shuli Jones, Isabella Pedraza Pineros, Daniel Hajas, Jonathan Zong, Arvind Satyanarayan
|
2023
|
View Paper |
Alt-Texify: A Pipeline to Generate Alt-text from SVG Visualizations
|
Aspen Belle, V. Goh, Akshay Kumar, Richard Pranjatno, Pui Man Yip, Umayangani Wickramaratne, Humphrey O. Obie
|
2022
|
View Paper |
The Why and The How: A Survey on Natural Language Interaction in Visualization
|
Henrik Voigt, Ozge Alacam, M. Meuschke, K. Lawonn, Sina Zarrieß
|
2022
|
View Paper |
Enamul Hoque, Md Zubair Ibne Alam, Shehnaz Islam
Published: 2023-02-16
Published: 2021-04-01
Nihanth W Cherukuru, David A Bailey, Tiffany Fourment, Becca Hatheway, Marika M Holland, Matt Rehme
Published: 2022-07-28
Felix M. Schmitt-Koopmann, Elaine M. Huang, Hans-Peter Hutter, Alireza Darvishy
Published: 2025-03-28
Comments (0)