Beyond Visuals : Examining the Experiences of Geoscience Professionals With Vision Disabilities in Accessing Data Visualizations
Publication
Metrics
AI Quick Summary
This study explores the challenges faced by geoscience professionals with vision disabilities in accessing data visualizations, revealing significant barriers impacting their careers and research. Recommendations from participants highlight the need for improved accessibility tools and a more aligned pace of visualization and accessibility research.
Paper Preview
Abstract
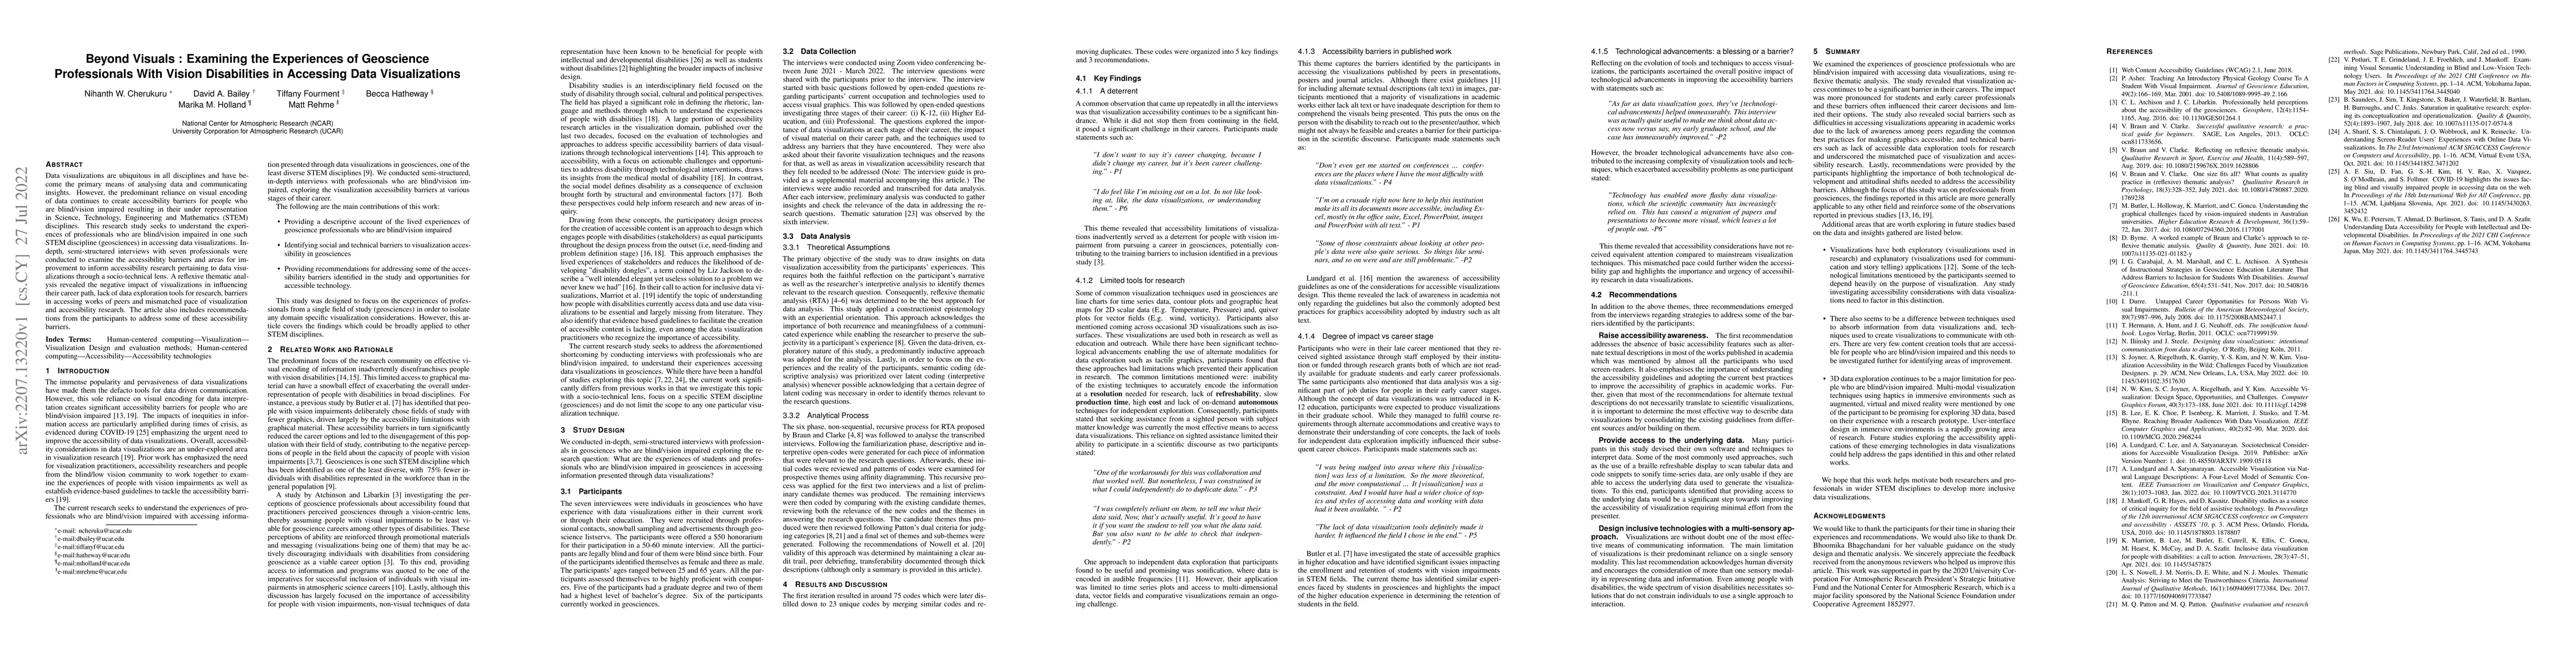
Data visualizations are ubiquitous in all disciplines and have become the primary means of analysing data and communicating insights. However, the predominant reliance on visual encoding of data continues to create accessibility barriers for people who are blind/vision impaired resulting in their under representation in Science, Technology, Engineering and Mathematics (STEM) disciplines. This research study seeks to understand the experiences of professionals who are blind/vision impaired in one such STEM discipline (geosciences) in accessing data visualizations. In-depth, semi-structured interviews with seven professionals were conducted to examine the accessibility barriers and areas for improvement to inform accessibility research pertaining to data visualizations through a socio-technical lens. A reflexive thematic analysis revealed the negative impact of visualizations in influencing their career path, lack of data exploration tools for research, barriers in accessing works of peers and mismatched pace of visualization and accessibility research. The article also includes recommendations from the participants to address some of these accessibility barriers.
AI Key Findings
Get AI-generated insights about this paper's methodology, results, significance, and more — seven facets brought into focus.
Impact
Paper Details
Authors
PDF Preview
Key Terms
Citation Network
Current paper (gray), citations (green), references (blue)
Display is limited for performance on very large graphs.
Discussion 0