ChartA11y is an app developed for blind smartphone users to access 2-D visualizations via multimodal interactions. It employs a participatory design process and offers two modes for enhanced chart understanding, addressing scatter plots' non-linear data distribution.
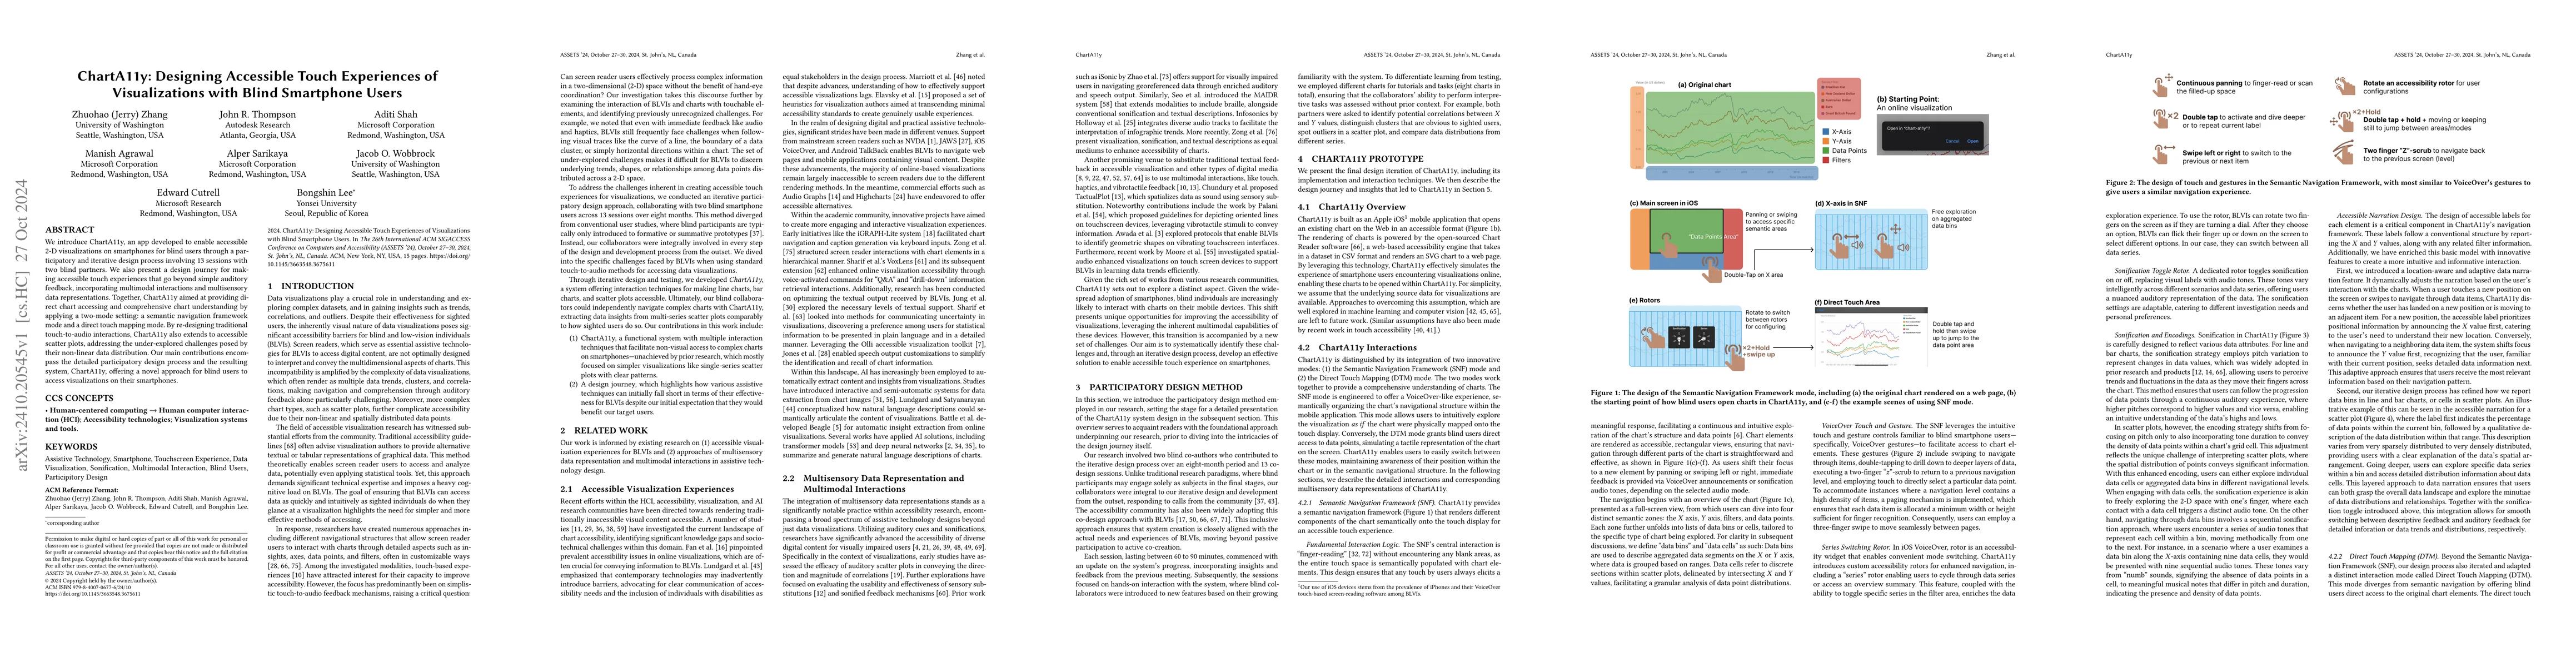
We introduce ChartA11y, an app developed to enable accessible 2-D visualizations on smartphones for blind users through a participatory and iterative design process involving 13 sessions with two blind partners. We also present a design journey for making accessible touch experiences that go beyond simple auditory feedback, incorporating multimodal interactions and multisensory data representations. Together, ChartA11y aimed at providing direct chart accessing and comprehensive chart understanding by applying a two-mode setting: a semantic navigation framework mode and a direct touch mapping mode. By re-designing traditional touch-to-audio interactions, ChartA11y also extends to accessible scatter plots, addressing the under-explored challenges posed by their non-linear data distribution. Our main contributions encompass the detailed participatory design process and the resulting system, ChartA11y, offering a novel approach for blind users to access visualizations on their smartphones.
Get AI-generated insights about this paper's methodology, results, and significance.
Current paper (gray), citations (green), references (blue)
Yilin Xia, Bongshin Lee, JooYoung Seo et al.
Yang Wang, Tanusree Sharma, Sauvik Das et al.
Matthew Butler, Samuel Reinders, Kim Marriott et al.
Title | Authors | Year | Actions |
---|---|---|---|
When Refreshable Tactile Displays Meet Conversational Agents: Investigating Accessible Data Presentation and Analysis with Touch and Speech
|
Samuel Reinders, Matthew Butler, Ingrid Zukerman, Bongshin Lee, Lizhen Qu, Kim Marriott
|
2024
|
View Paper |
Title | Authors | Year | Actions |
---|---|---|---|
Spatial Audio-Enhanced Multimodal Graph Rendering for Efficient Data Trend Learning on Touchscreen Devices
|
Wilfredo Joshua Robinson Moore, Medhani Kalal, Jennifer L. Tennison, N. Giudice, Jenna L. Gorlewicz
|
2024
|
View Paper |
MAIDR: Making Statistical Visualizations Accessible with Multimodal Data Representation
|
JooYoung Seo, Yilin Xia, Bongshin Lee, Sean McCurry, Yu Jun Yam
|
2024
|
View Paper |
Umwelt: Accessible Structured Editing of Multi-Modal Data Representations
|
Jonathan Zong, Isabella Pedraza Pineros, M. Chen, Daniel Hajas, Arvind Satyanarayan
|
2024
|
View Paper |
Shape2Vibe: A Tangible Tool for Vibrotactile Co-Design with People with Deafblindness
|
Xavière Van Rooyen, Gijs Huisman, M. Plaisier, Sylvia C. Pont
|
2024
|
View Paper |
TADA: Making Node-link Diagrams Accessible to Blind and Low-Vision People
|
Yichun Zhao, Miguel A. Nacenta, M. Sukhai, Sowmya Somanath
|
2023
|
View Paper |
BrushLens: Hardware Interaction Proxies for Accessible Touchscreen Interface Actuation
|
Chen Liang, Yasha Iravantchi, Thomas Krolikowski, Ruijie Geng, Alanson P. Sample, Anhong Guo
|
2023
|
View Paper |
Conveying Uncertainty in Data Visualizations to Screen-Reader Users Through Non-Visual Means
|
Ather Sharif, Ruican Zhong, Yadi Wang
|
2023
|
View Paper |
Developing and Deploying a Real-World Solution for Accessible Slide Reading and Authoring for Blind Users
|
Zhuohao Zhang, Gene S-H Kim, Jacob O. Wobbrock
|
2023
|
View Paper |
“Customization is Key”: Reconfigurable Textual Tokens for Accessible Data Visualizations
|
Shuli Jones, Isabella Pedraza Pineros, Daniel Hajas, Jonathan Zong, Arvind Satyanarayan
|
2023
|
View Paper |
Understanding and Improving Drilled-Down Information Extraction from Online Data Visualizations for Screen-Reader Users
|
Ather Sharif, Andrew M. Zhang, Katharina Reinecke, J. Wobbrock
|
2023
|
View Paper |
Chart Reader: Accessible Visualization Experiences Designed with Screen Reader Users
|
John Thompson, Jesse J Martinez, Alper Sarıkaya, Edward Cutrell, Bongshin Lee
|
2023
|
View Paper |
Toucha11y: Making Inaccessible Public Touchscreens Accessible
|
Jiasheng Li, Zeyu Yan, Arushi Shah, J. Lazar, Huaishu Peng
|
2023
|
View Paper |
Accessible Data Representation with Natural Sound
|
Md. Naimul Hoque, Md Ehtesham-Ul-Haque, N. Elmqvist, Syed Masum Billah
|
2023
|
View Paper |
A11yBoard: Making Digital Artboards Accessible to Blind and Low-Vision Users
|
Zhuohao Zhang, J. Wobbrock
|
2023
|
View Paper |
SeeChart: Enabling Accessible Visualizations Through Interactive Natural Language Interface For People with Visual Impairments
|
Md. Zubair Ibne Alam, Shehnaz Islam, Enamul Hoque
|
2023
|
View Paper |
“What Makes Sonification User-Friendly?” Exploring Usability and User-Friendliness of Sonified Responses
|
Ather Sharif, Olivia H. Wang, Alida T. Muongchan
|
2022
|
View Paper |
The Accessibility of Data Visualizations on the Web for Screen Reader Users: Practices and Experiences During COVID-19
|
Danyang Fan, Alexa Fay Siu, Hrishikesh V. Rao, Gene S.-H. Kim, Xavier Vazquez, Lucy Greco, Sile O'Modhrain, Sean Follmer
|
2022
|
View Paper |
How accessible is my visualization? Evaluating visualization accessibility with Chartability
|
Frank Elavsky, Cynthia L. Bennett, Dominik Moritz
|
2022
|
View Paper |
Rich Screen Reader Experiences for Accessible Data Visualization
|
Jonathan Zong, Crystal Lee, Alan Lundgard, JiWoong Jang, Daniel Hajas, Arvind Satyanarayan
|
2022
|
View Paper |
Infosonics: Accessible Infographics for People who are Blind using Sonification and Voice
|
Leona Holloway, Cagatay Goncu, Alon Ilsar, M. Butler, K. Marriott
|
2022
|
View Paper |
VoxLens: Making Online Data Visualizations Accessible with an Interactive JavaScript Plug-In
|
Ather Sharif, Olivia H. Wang, Alida T. Muongchan, Katharina Reinecke, J. Wobbrock, Jacob O. obbrock
|
2022
|
View Paper |
CollabAlly: Accessible Collaboration Awareness in Document Editing
|
Cheuk Yin Phipson Lee, Zhuohao Zhang, Jaylin Herskovitz, Jooyoung Seo, Anhong Guo
|
2022
|
View Paper |
Visualization Accessibility in the Wild: Challenges Faced by Visualization Designers
|
Shakila Cherise S. Joyner, A. Riegelhuth, Kathleen Garrity, Yea-Seul Kim, N. Kim
|
2022
|
View Paper |
Understanding Screen-Reader Users’ Experiences with Online Data Visualizations
|
Ather Sharif, S. Chintalapati, J. Wobbrock, Katharina Reinecke
|
2021
|
View Paper |
Accessible Visualization via Natural Language Descriptions: A Four-Level Model of Semantic Content
|
Alan Lundgard, Arvind Satyanarayan
|
2021
|
View Paper |
Towards Understanding Sensory Substitution for Accessible Visualization: An Interview Study
|
Pramod Chundury, Biswaksen Patnaik, Yasmin Reyazuddin, Christine Tang, J. Lazar, N. Elmqvist
|
2021
|
View Paper |
Accessible Visualization: Design Space, Opportunities, and Challenges
|
N. Kim, Shakila Cherise S. Joyner, A. Riegelhuth, Yea-Seul Kim
|
2021
|
View Paper |
Social Sensemaking with AI: Designing an Open-ended AI Experience with a Blind Child
|
C. Morrison, Edward Cutrell, Martin Grayson, Anja Thieme, Alex S Taylor, G. Roumen, Camilla Longden, Sebastian Tschiatschek, R. Marques, A. Sellen
|
2021
|
View Paper |
Towards an efficient framework for Data Extraction from Chart Images
|
Weihong Ma, Hesuo Zhang, Shuang Yan, Guang Yao, Yichao Huang, Hui Li, Yaqiang Wu, Lianwen Jin
|
2021
|
View Paper |
Inclusive data visualization for people with disabilities
|
K. Marriott, Bongshin Lee, M. Butler, Edward Cutrell, K. Ellis, Cagatay Goncu, Marti A. Hearst, Kathleen F. McCoy, D. Szafir
|
2021
|
View Paper |
Technology Developments in Touch-Based Accessible Graphics: A Systematic Review of Research 2010-2020
|
M. Butler, Leona Holloway, Samuel Reinders, Cagatay Goncu, K. Marriott
|
2021
|
View Paper |
Information Graphic Summarization using a Collection of Multimodal Deep Neural Networks
|
Edward J. Kim, Connor Onweller, Kathleen F. McCoy
|
2021
|
View Paper |
Collaborative Tabletops for Blind People
|
Daniel Mendes, Sofia Reis, J. Guerreiro, Hugo Nicolau
|
2020
|
View Paper |
Playing With Others: Depicting Multiplayer Gaming Experiences of People With Visual Impairments
|
David Gonçalves, André Rodrigues, Tiago Guerreiro
|
2020
|
View Paper |
Chart-to-Text: Generating Natural Language Descriptions for Charts by Adapting the Transformer Model
|
Jason Obeid, Enamul Hoque
|
2020
|
View Paper |
Tensor Fields for Data Extraction from Chart Images: Bar Charts and Scatter Plots
|
Jaya Sreevalsan-Nair, Komal Dadhich, Siri Chandana Daggubati
|
2020
|
View Paper |
Audio AR to support nature connectedness in people with visual disabilities
|
Maryam Bandukda, C. Holloway
|
2020
|
View Paper |
Design Guidelines and Recommendations for Multimodal, Touchscreen-based Graphics
|
J. Gorlewicz, Jennifer L. Tennison, Phillip Merlin Uesbeck, Margaret E. Richard, H. Palani, A. Stefik, Derrick W. Smith, N. Giudice
|
2020
|
View Paper |
Sociotechnical Considerations for Accessible Visualization Design
|
Alan Lundgard, Crystal Lee, Arvind Satyanarayan
|
2019
|
View Paper |
Data Extraction from Charts via Single Deep Neural Network
|
Xiaoyi Liu, D. Klabjan, Patrick N. Bless
|
2019
|
View Paper |
Visualizing for the Non‐Visual: Enabling the Visually Impaired to Use Visualization
|
Jinho Choi, Sanghun Jung, Deok Gun Park, J. Choo, N. Elmqvist
|
2019
|
View Paper |
Designing Interactive 3D Printed Models with Teachers of the Visually Impaired
|
Lei Shi, Holly Lawson, Zhuohao Zhang, Shiri Azenkot
|
2019
|
View Paper |
Multimodal Deep Learning using Images and Text for Information Graphic Classification
|
Edward Kim, Kathleen F. McCoy
|
2018
|
View Paper |
Haptic Information Access Using Touchscreen Devices: Design Guidelines for Accurate Perception of Angular Magnitude and Line Orientation
|
H. Palani, G. Bernard Giudice, N. Giudice
|
2018
|
View Paper |
Beagle: Automated Extraction and Interpretation of Visualizations from the Web
|
L. Battle, Peitong Duan, Zachery Miranda, Dana Mukusheva, Remco Chang, M. Stonebraker
|
2017
|
View Paper |
ChartSense: Interactive Data Extraction from Chart Images
|
Daekyoung Jung, Wonjae Kim, Hyunjoo Song, Jeongin Hwang, Bongshin Lee, Bo Hyoung Kim, Jinwook Seo
|
2017
|
View Paper |
Designing Wearable Mobile Device Controllers for Blind People: A Co-Design Approach
|
Catherine Feng
|
2016
|
View Paper |
Design for user empowerment
|
Richard E. Ladner
|
2015
|
View Paper |
Beating the bubble: using kinematic triggering in the bubble lens for acquiring small, dense targets
|
Martez E. Mott, J. Wobbrock
|
2014
|
View Paper |
Evaluating a Tool for Improving Accessibility to Charts and Graphs
|
L. Ferres, G. Lindgaard, Livia Sumegi, Bruce Tsuji
|
2013
|
View Paper |
Surface haptic interactions with a TPad tablet
|
Joe Mullenbach, Craig D. Shultz, Anne Marie Piper, M. Peshkin, J. Colgate
|
2013
|
View Paper |
Towards Digital Image Accessibility for Blind Users Via Vibrating Touch Screen: A Feasibility Test Protocol
|
Amine Awada, Youssef Bou Issa, C. Ghannam, Joe Tekli, R. Chbeir
|
2012
|
View Paper |
ReVision: automated classification, analysis and redesign of chart images
|
M. Savva, Nicholas Kong, Arti Chhajta, Li Fei-Fei, Maneesh Agrawala, Jeffrey Heer
|
2011
|
View Paper |
Usable gestures for blind people: understanding preference and performance
|
Shaun K. Kane, J. Wobbrock, Richard E. Ladner
|
2011
|
View Paper |
Slide rule: making mobile touch screens accessible to blind people using multi-touch interaction techniques
|
Shaun K. Kane, Jeffrey P. Bigham, J. Wobbrock
|
2008
|
View Paper |
Toward accessible 3D virtual environments for the blind and visually impaired
|
Gareth R. T. White, G. Fitzpatrick, G. McAllister
|
2008
|
View Paper |
Data Sonification for Users with Visual Impairment: A Case Study with Georeferenced Data
|
Haixia Zhao, C. Plaisant, B. Shneiderman, J. Lazar
|
2008
|
View Paper |
Barrier pointing: using physical edges to assist target acquisition on mobile device touch screens
|
Jon E. Froehlich, J. Wobbrock, Shaun K. Kane
|
2007
|
View Paper |
What Frustrates Screen Reader Users on the Web: A Study of 100 Blind Users
|
J. Lazar, Aaron Allen, Jason Kleinman, C. Malarkey
|
2007
|
View Paper |
SoundBar: exploiting multiple views in multimodal graph browsing
|
D. McGookin, S. Brewster
|
2006
|
View Paper |
The bubble cursor: enhancing target acquisition by dynamic resizing of the cursor's activation area
|
Tovi Grossman, Ravin Balakrishnan
|
2005
|
View Paper |
Semantic pointing: improving target acquisition with control-display ratio adaptation
|
R. Blanch, Y. Guiard, M. Beaudouin-Lafon
|
2004
|
View Paper |
DESIGN GUIDELINES FOR AUDIO PRESENTATION OF GRAPHS AND TABLES
|
Lorna M. Brown, S. Brewster, R. Ramloll, Mike Burton, B. Riedel
|
2003
|
View Paper |
The benefits of physical edges in gesture-making: empirical support for an edge-based unistroke alphabet
|
J. Wobbrock
|
2003
|
View Paper |
Cross-Modal Equivalence of Visual and Auditory Scatterplots for Exploring Bivariate Data Samples
|
J. H. Flowers, Dion C. Buhman, Kimberly D. Turnage
|
1997
|
View Paper |
.TactualPlot:spatializingdataassoundusingsensorysubstitution fortouchscreenaccessibility
|
2023
|
||
Microsoft Soundscape – A map delivered in 3D sound
|
2021
|
||
AUDITORY AUGMENTATION OF HAPTIC GRAPHS: DEVELOPING A GRAPHIC TOOL FOR TEACHING PRECALCULUS SKILL TO BLIND STUDENTS
|
F. L. Scoy, Don E. McLaughlin, Angela Fullmer
|
2005
|
View Paper |
Using speech and touch to enable blind people to access schematic diagrams
|
P. Blenkhorn, D. G. Evans
|
1998
|
View Paper |
2022. Communicating Visualizations without Visuals: Investigation of Visualization Alternative Text for People with Visual Impairments
|
|||
Apple Developer Documentation. 2023-06-16.
|
|||
2022. Olli: An Extensible Visualization Library for Screen Reader Accessibility
|
|||
Highcharts. 2024-04-05.
|
|||
ASSETS ’24, October 27–30, 2024
|
|||
Freedom Scientifc Inc. 2024-04-05.
|
Showing first page preview. Click "Open Full PDF" to view the complete paper.
Your comment contains inappropriate language and has been rejected.
Are you sure you want to remove this tag? This action cannot be undone.
Someone just favorited a paper!
Comments (0)