Publication
Metrics
AI Quick Summary
MAIDR enhances accessibility for blind users by integrating multimodal data representations, including braille and review, alongside sonification and textual descriptions to interpret statistical visualizations. User study results indicate that the system supports accurate interpretation and highlights the importance of user autonomy in accessible data visualizations.
Paper Preview
Abstract
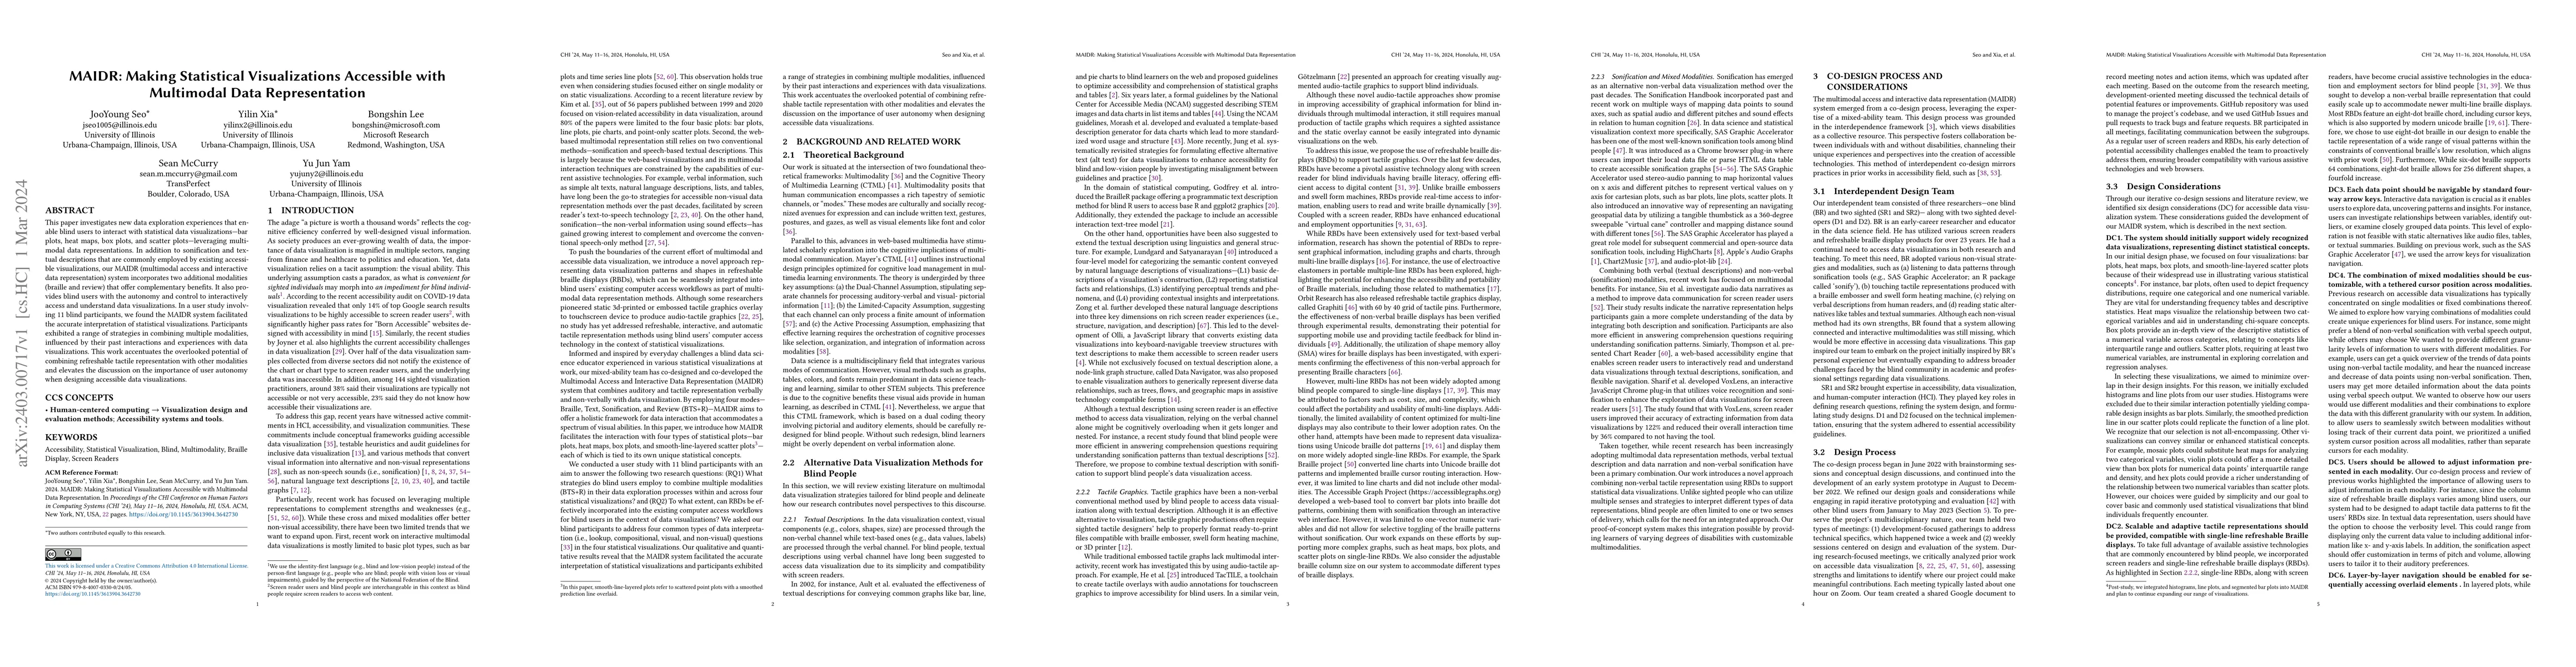
This paper investigates new data exploration experiences that enable blind users to interact with statistical data visualizations$-$bar plots, heat maps, box plots, and scatter plots$-$leveraging multimodal data representations. In addition to sonification and textual descriptions that are commonly employed by existing accessible visualizations, our MAIDR (multimodal access and interactive data representation) system incorporates two additional modalities (braille and review) that offer complementary benefits. It also provides blind users with the autonomy and control to interactively access and understand data visualizations. In a user study involving 11 blind participants, we found the MAIDR system facilitated the accurate interpretation of statistical visualizations. Participants exhibited a range of strategies in combining multiple modalities, influenced by their past interactions and experiences with data visualizations. This work accentuates the overlooked potential of combining refreshable tactile representation with other modalities and elevates the discussion on the importance of user autonomy when designing accessible data visualizations.
AI Key Findings
Get AI-generated insights about this paper's methodology, results, significance, and more — seven facets brought into focus.
Impact
Paper Details
Authors
PDF Preview
Key Terms
Citation Network
Current paper (gray), citations (green), references (blue)
Display is limited for performance on very large graphs.
Discussion 0