Academic Profile
Statistics
Similar Authors
Papers on arXiv
While recent years have seen a growing interest in accessible visualization tools and techniques for blind people, little attention is paid to the learning opportunities and teaching strategies of d...
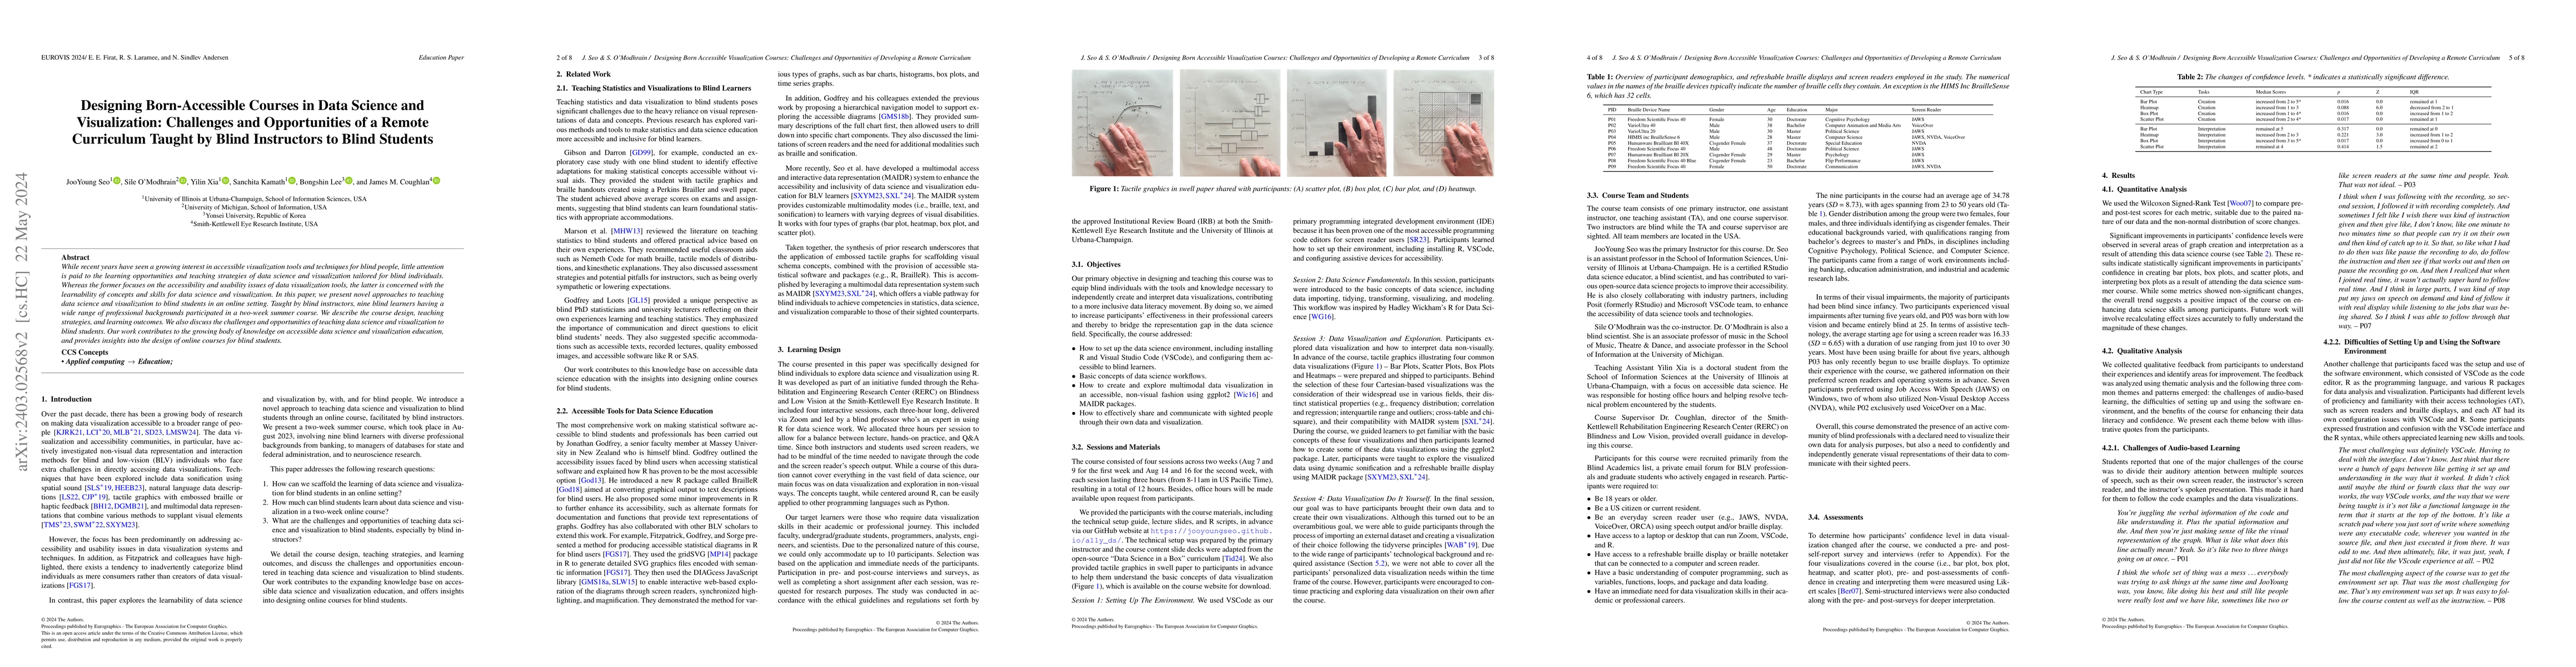
This paper investigates new data exploration experiences that enable blind users to interact with statistical data visualizations$-$bar plots, heat maps, box plots, and scatter plots$-$leveraging mu...
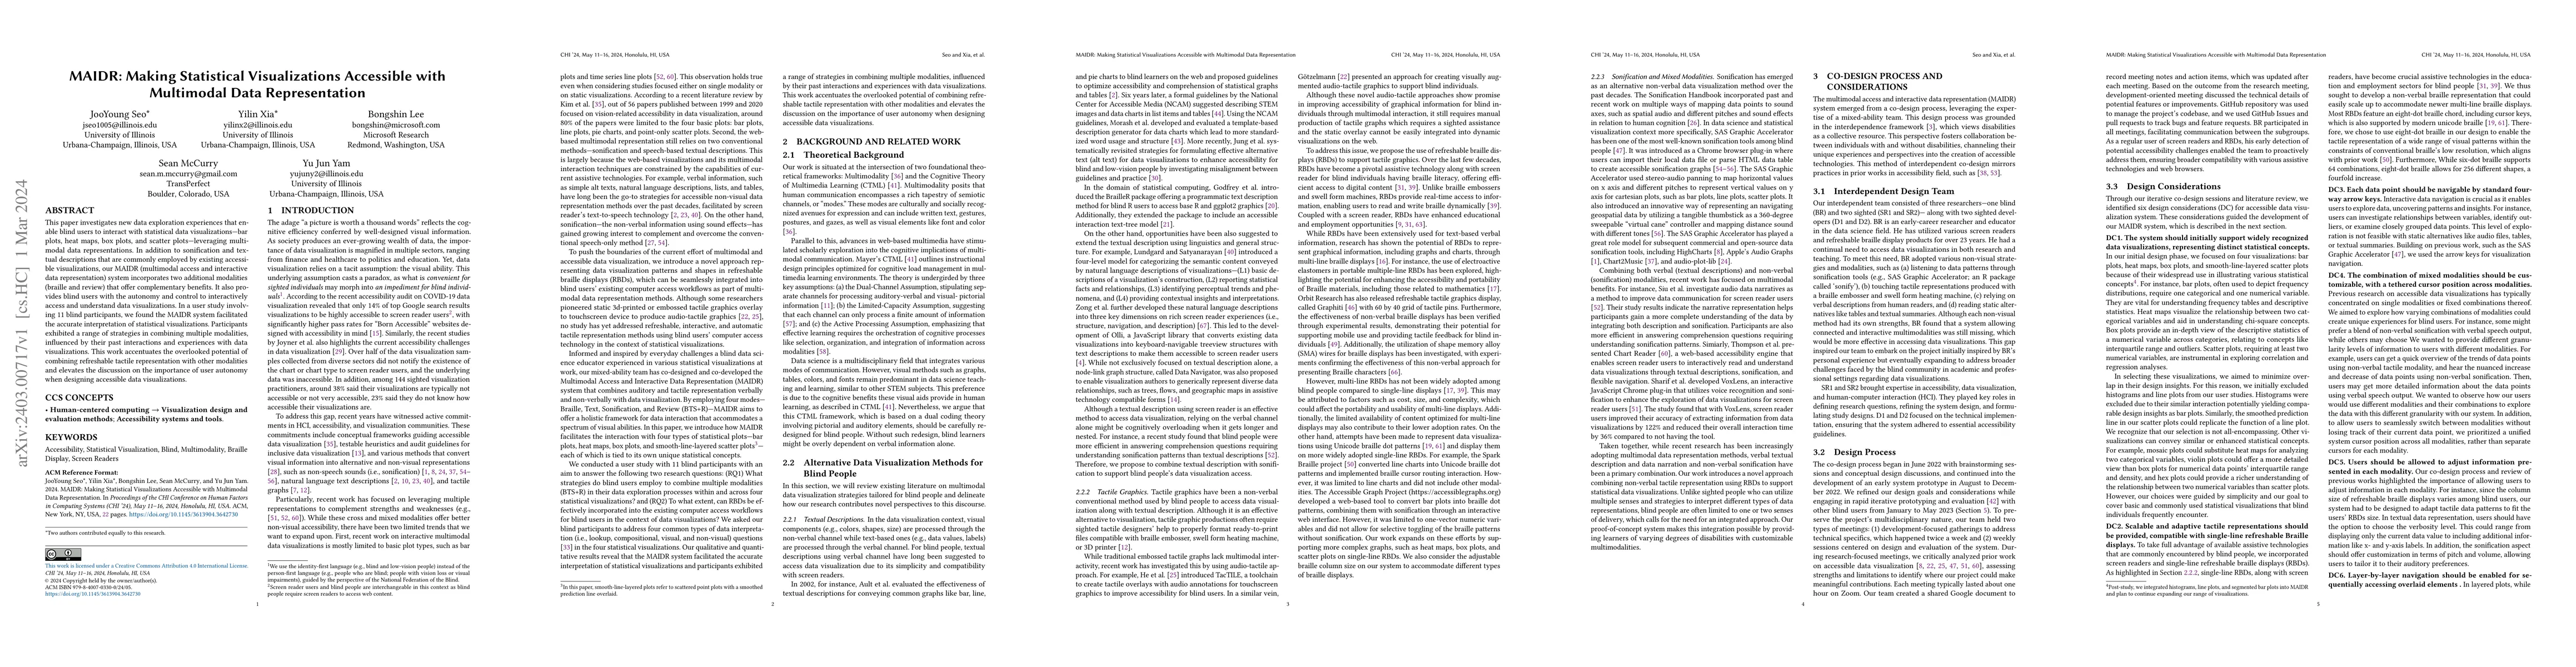
We present a systematic review and design space for visualizations on smartwatches and the context in which these visualizations are displayed--smartwatch faces. A smartwatch face is the main smartw...
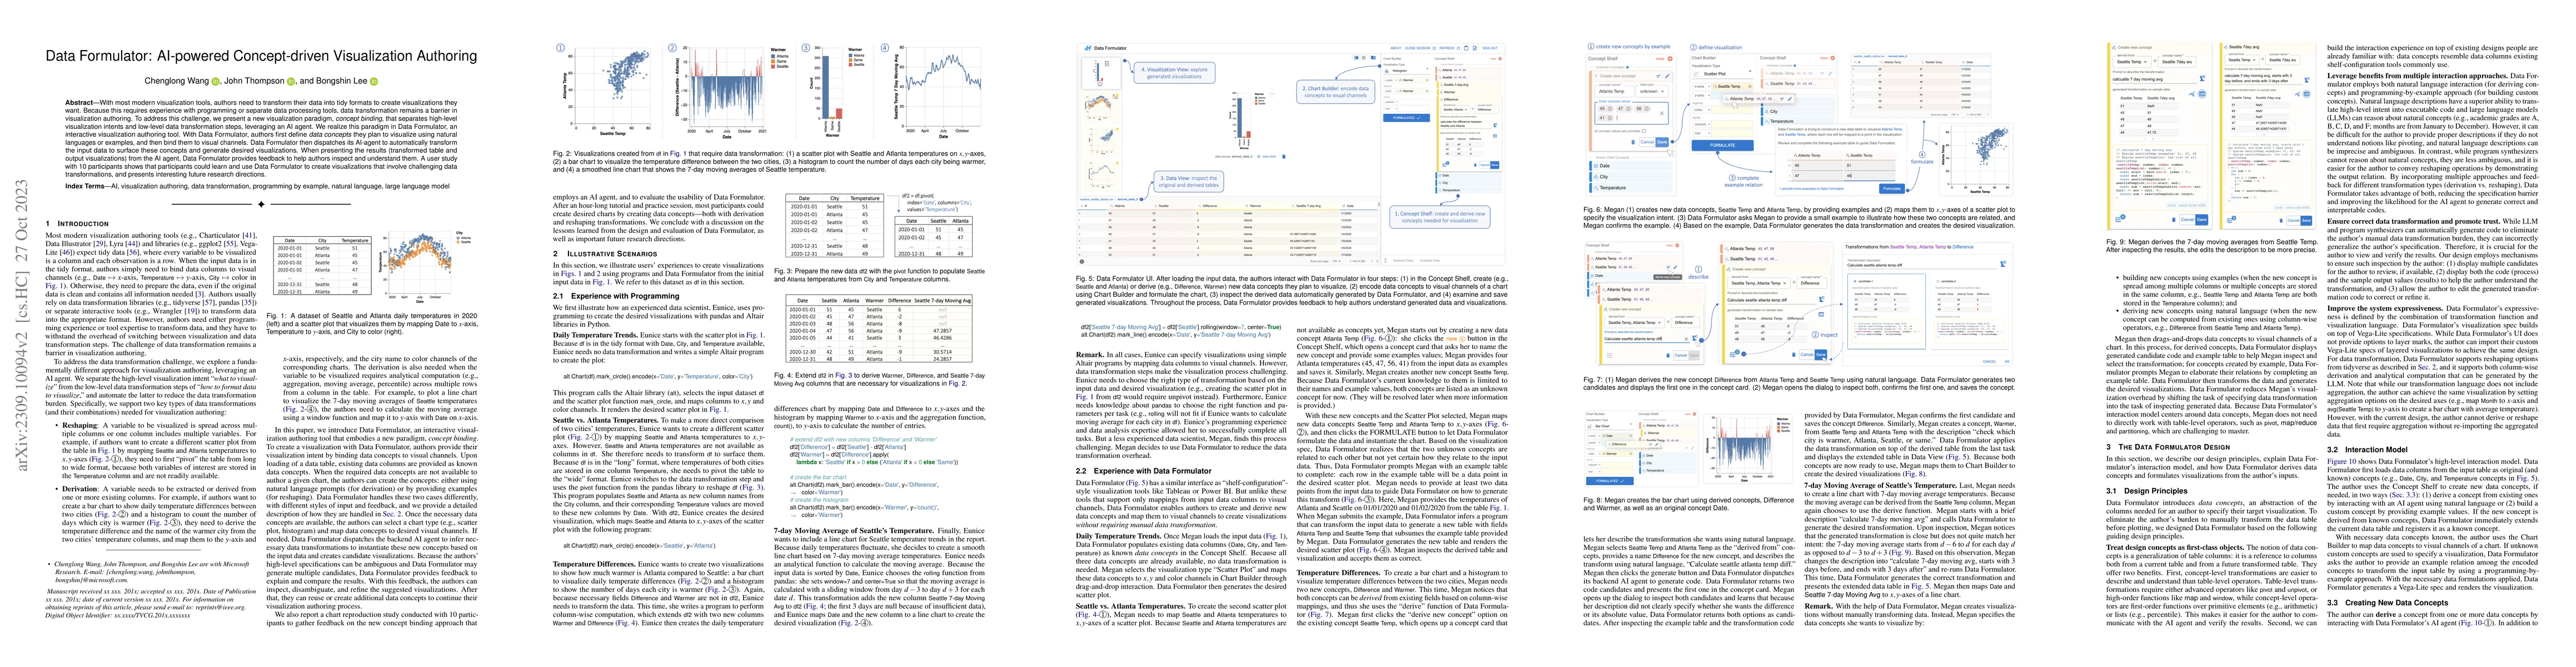
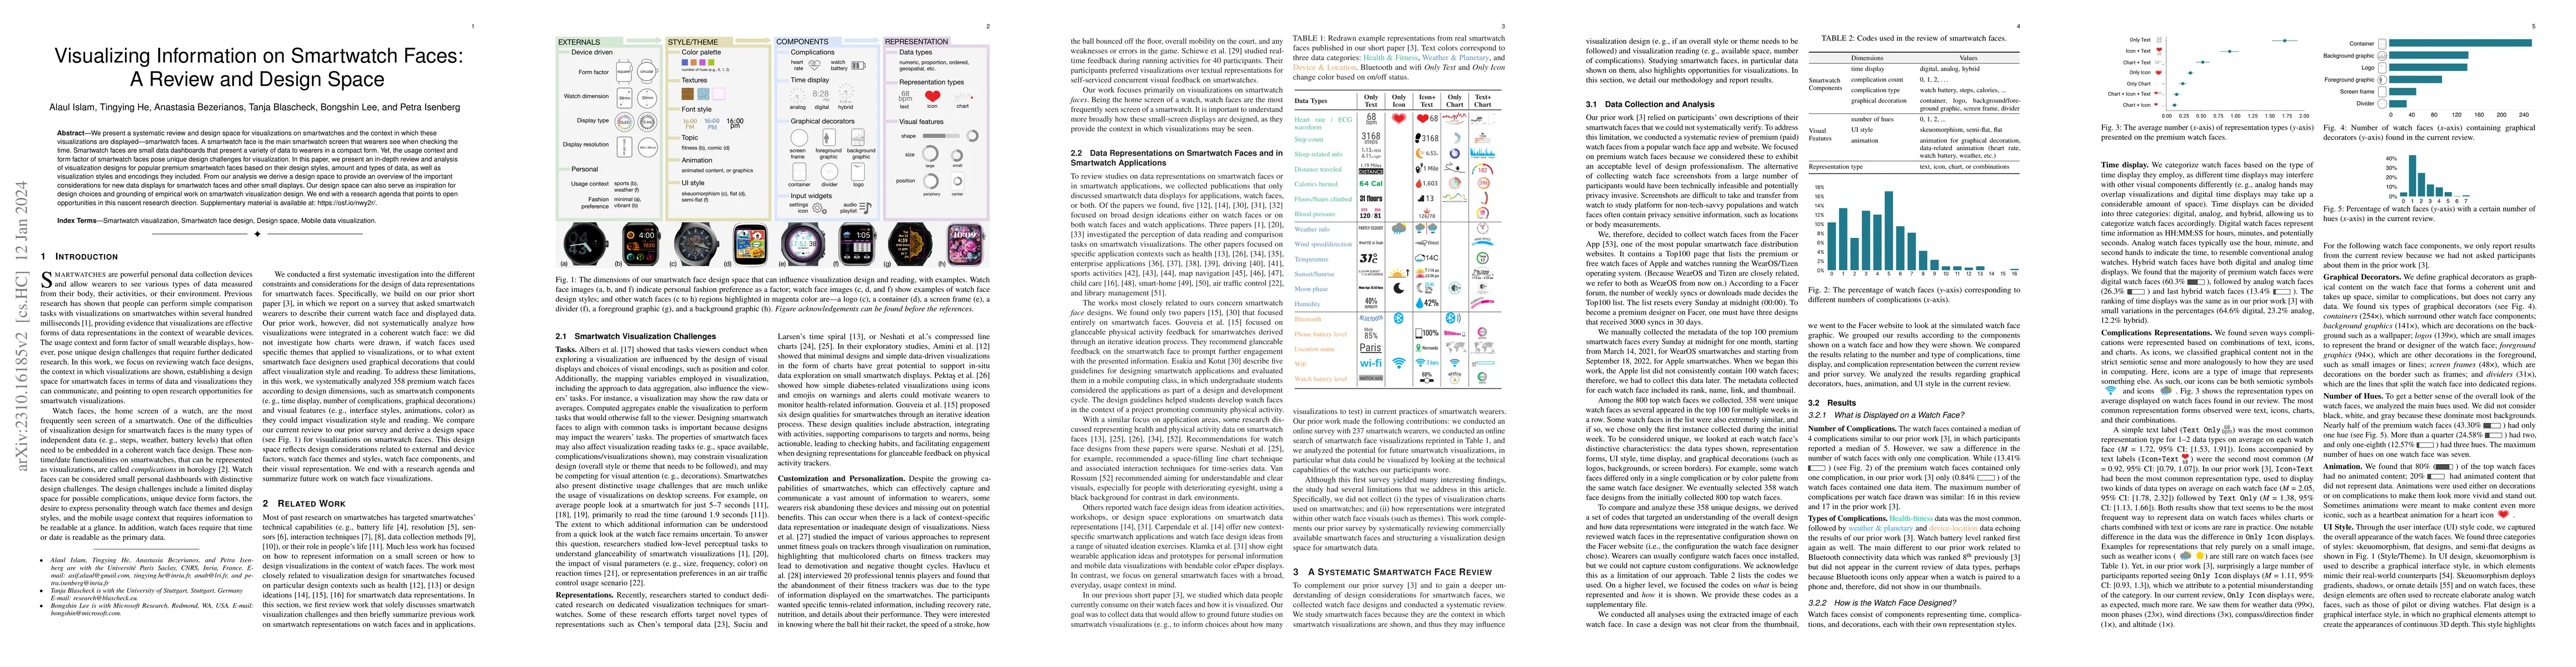
With most modern visualization tools, authors need to transform their data into tidy formats to create visualizations they want. Because this requires experience with programming or separate data pr...
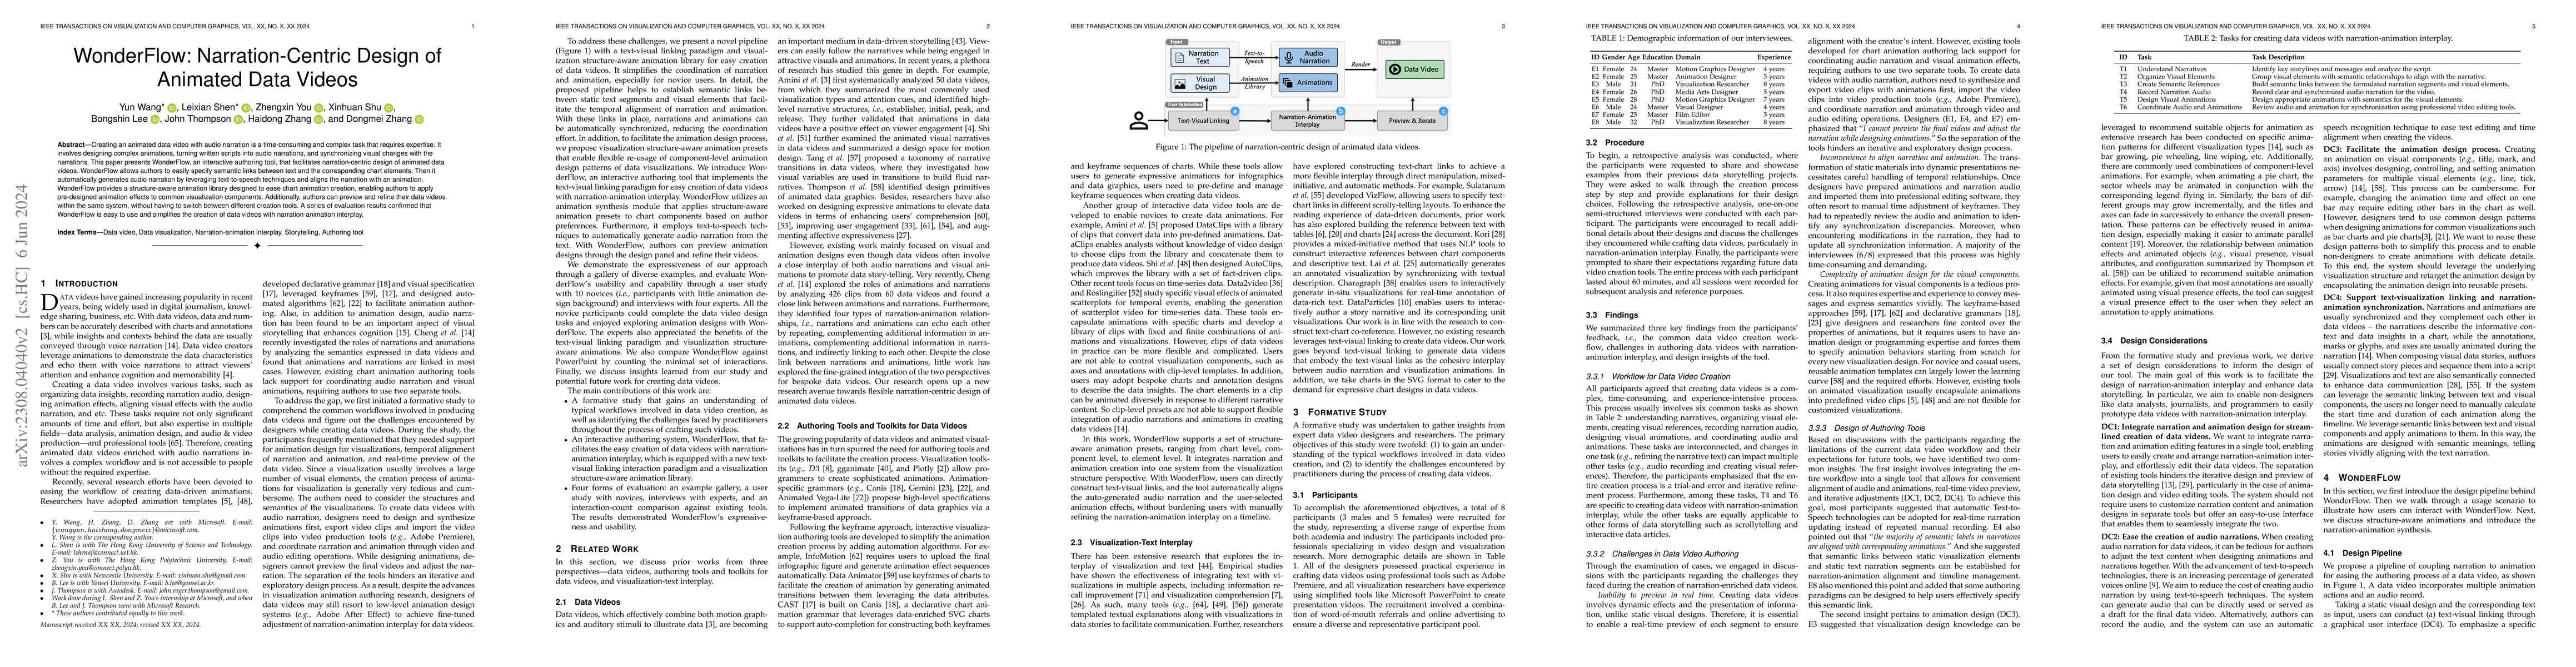
Creating an animated data video enriched with audio narration takes a significant amount of time and effort and requires expertise. Users not only need to design complex animations, but also turn wr...
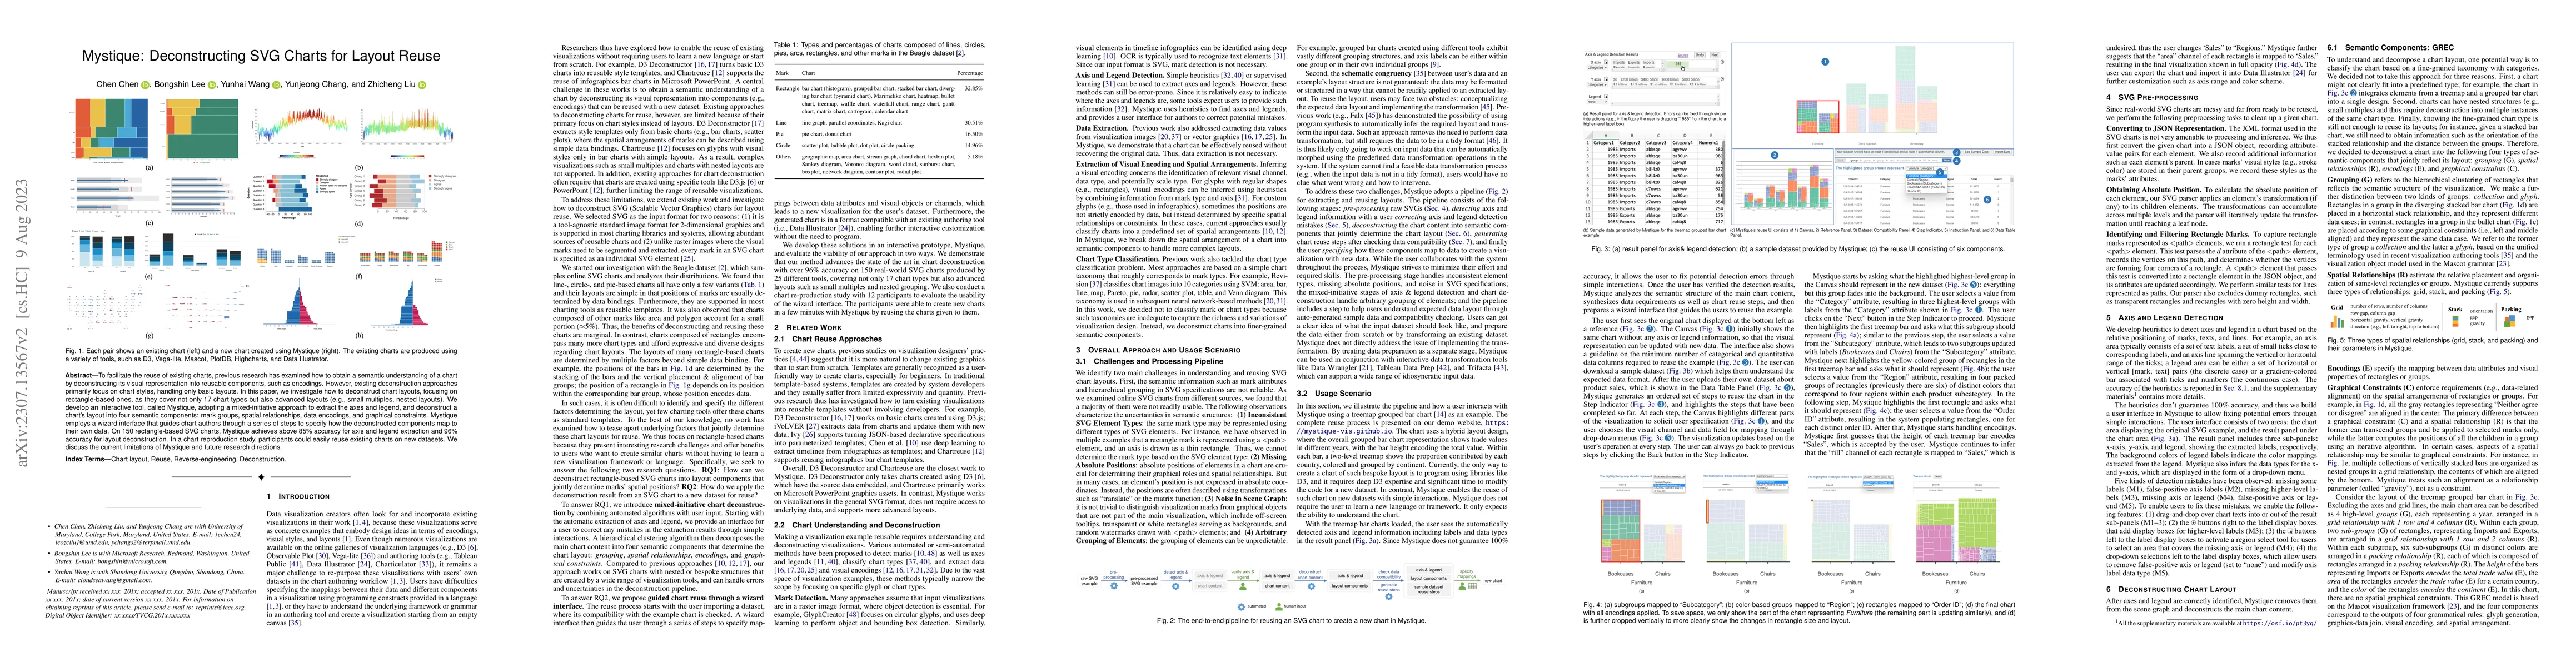
To facilitate the reuse of existing charts, previous research has examined how to obtain a semantic understanding of a chart by deconstructing its visual representation into reusable components, suc...
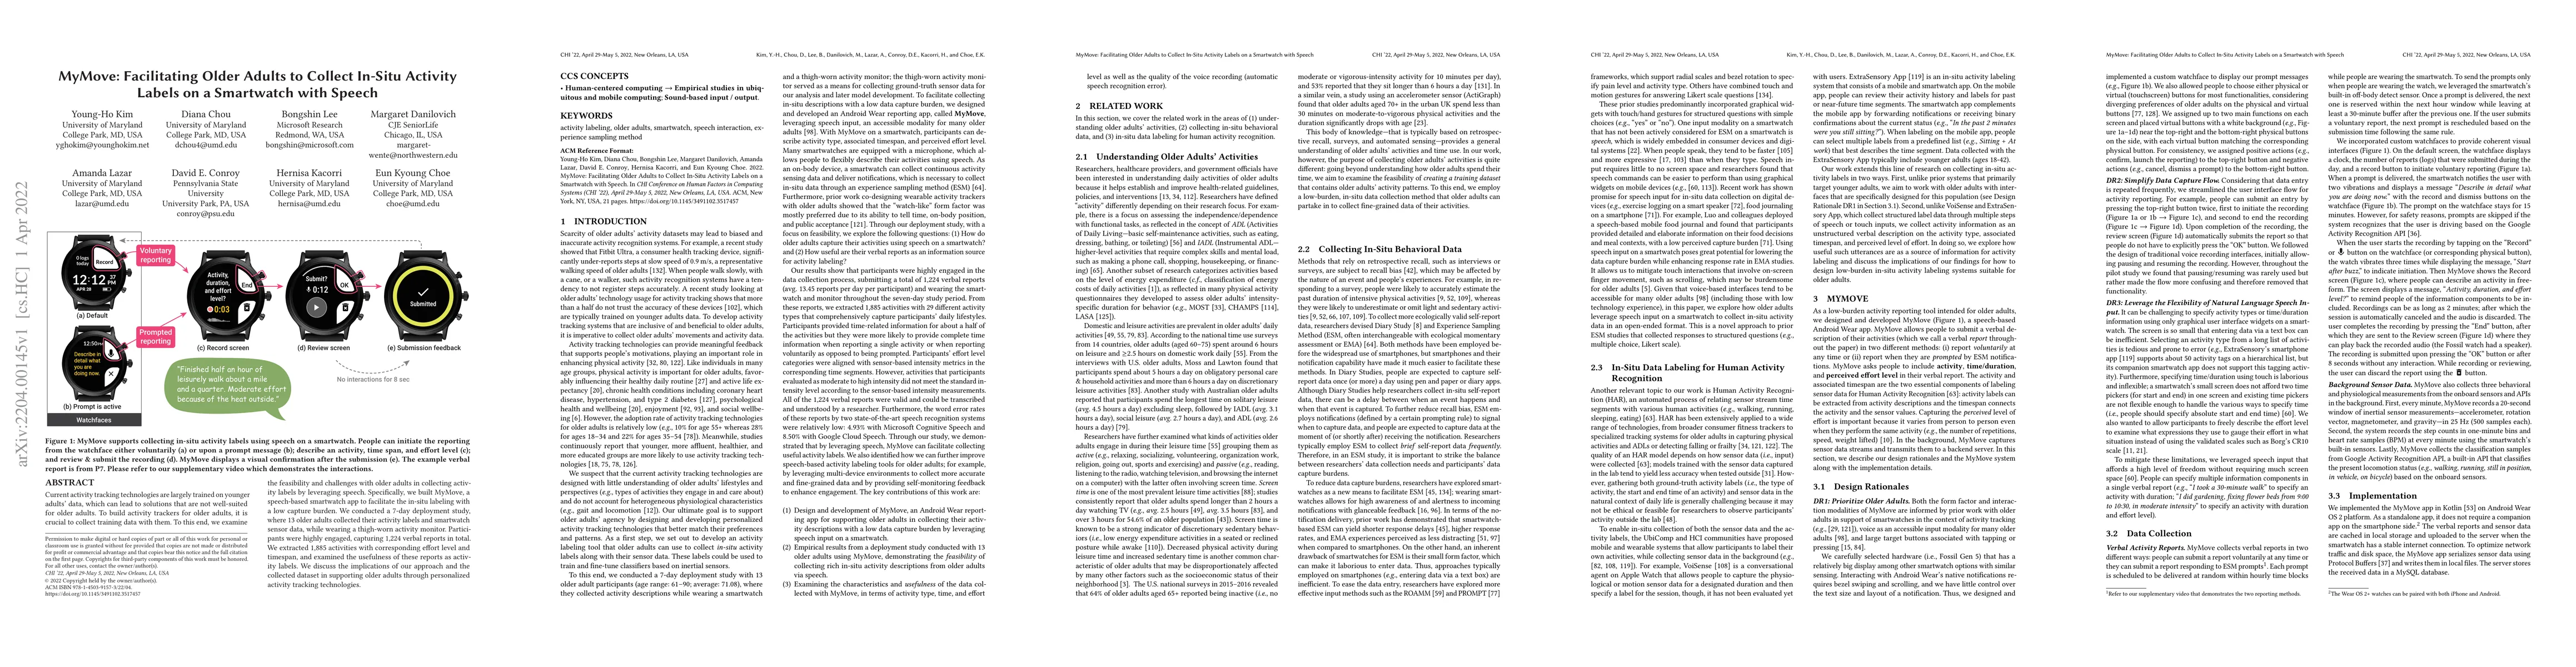
Current activity tracking technologies are largely trained on younger adults' data, which can lead to solutions that are not well-suited for older adults. To build activity trackers for older adults...
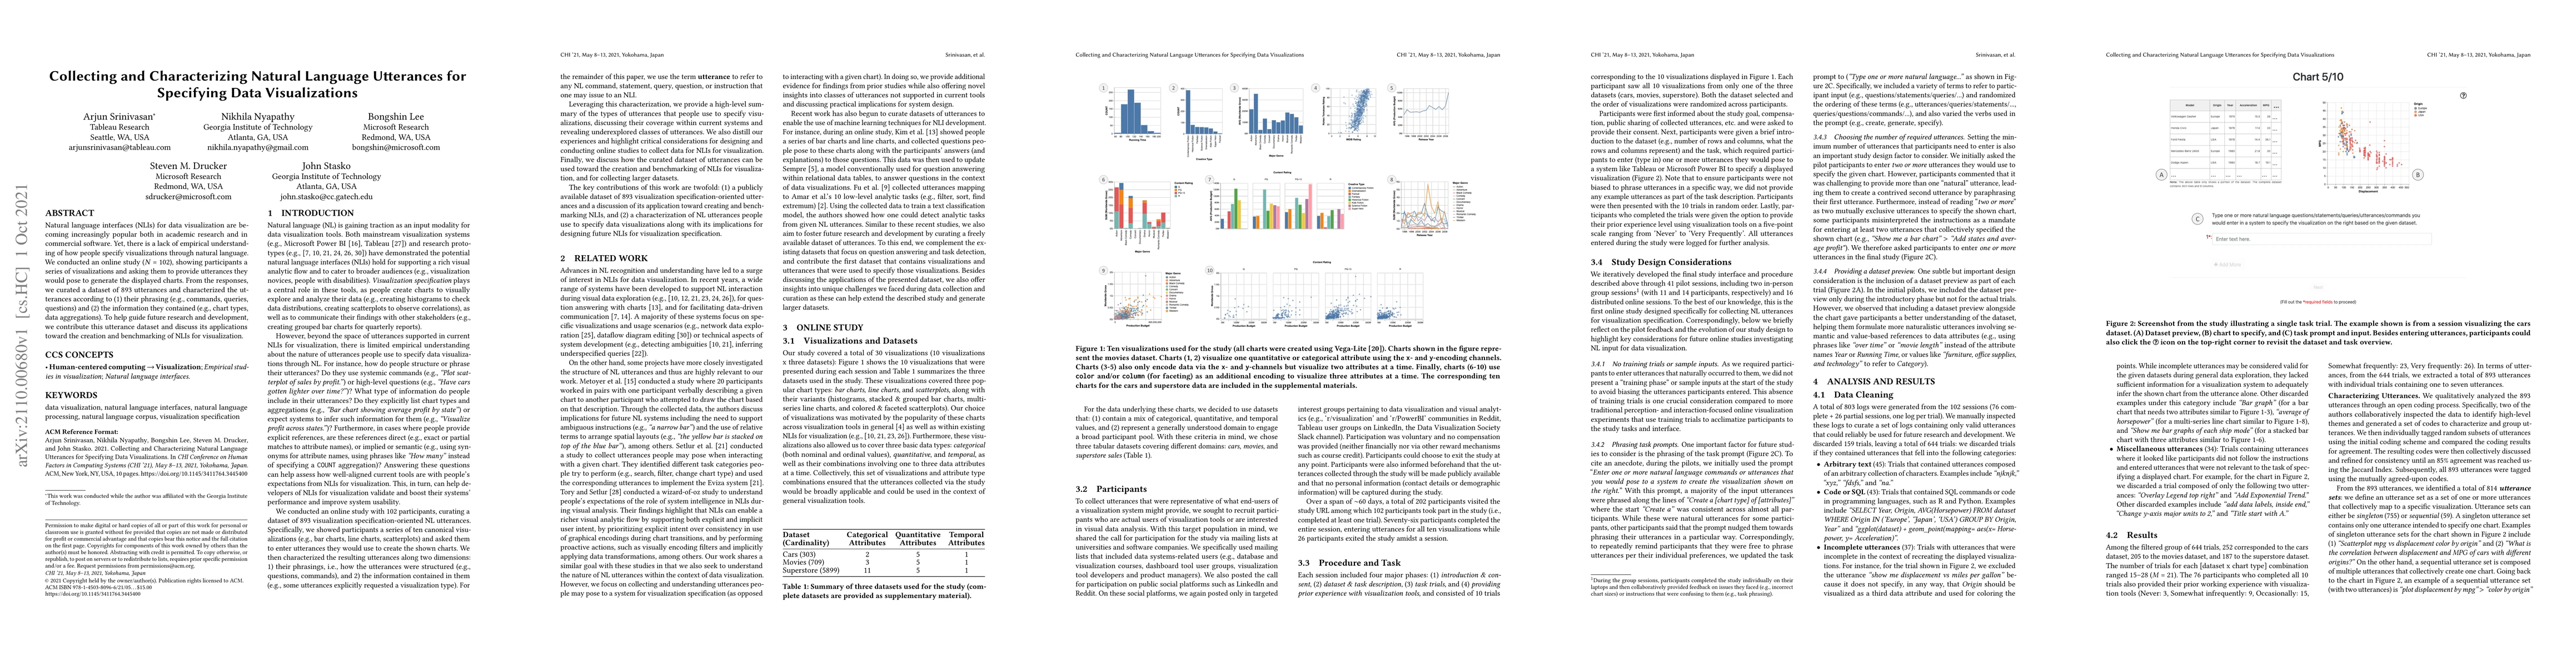
Natural language interfaces (NLIs) for data visualization are becoming increasingly popular both in academic research and in commercial software. Yet, there is a lack of empirical understanding of h...
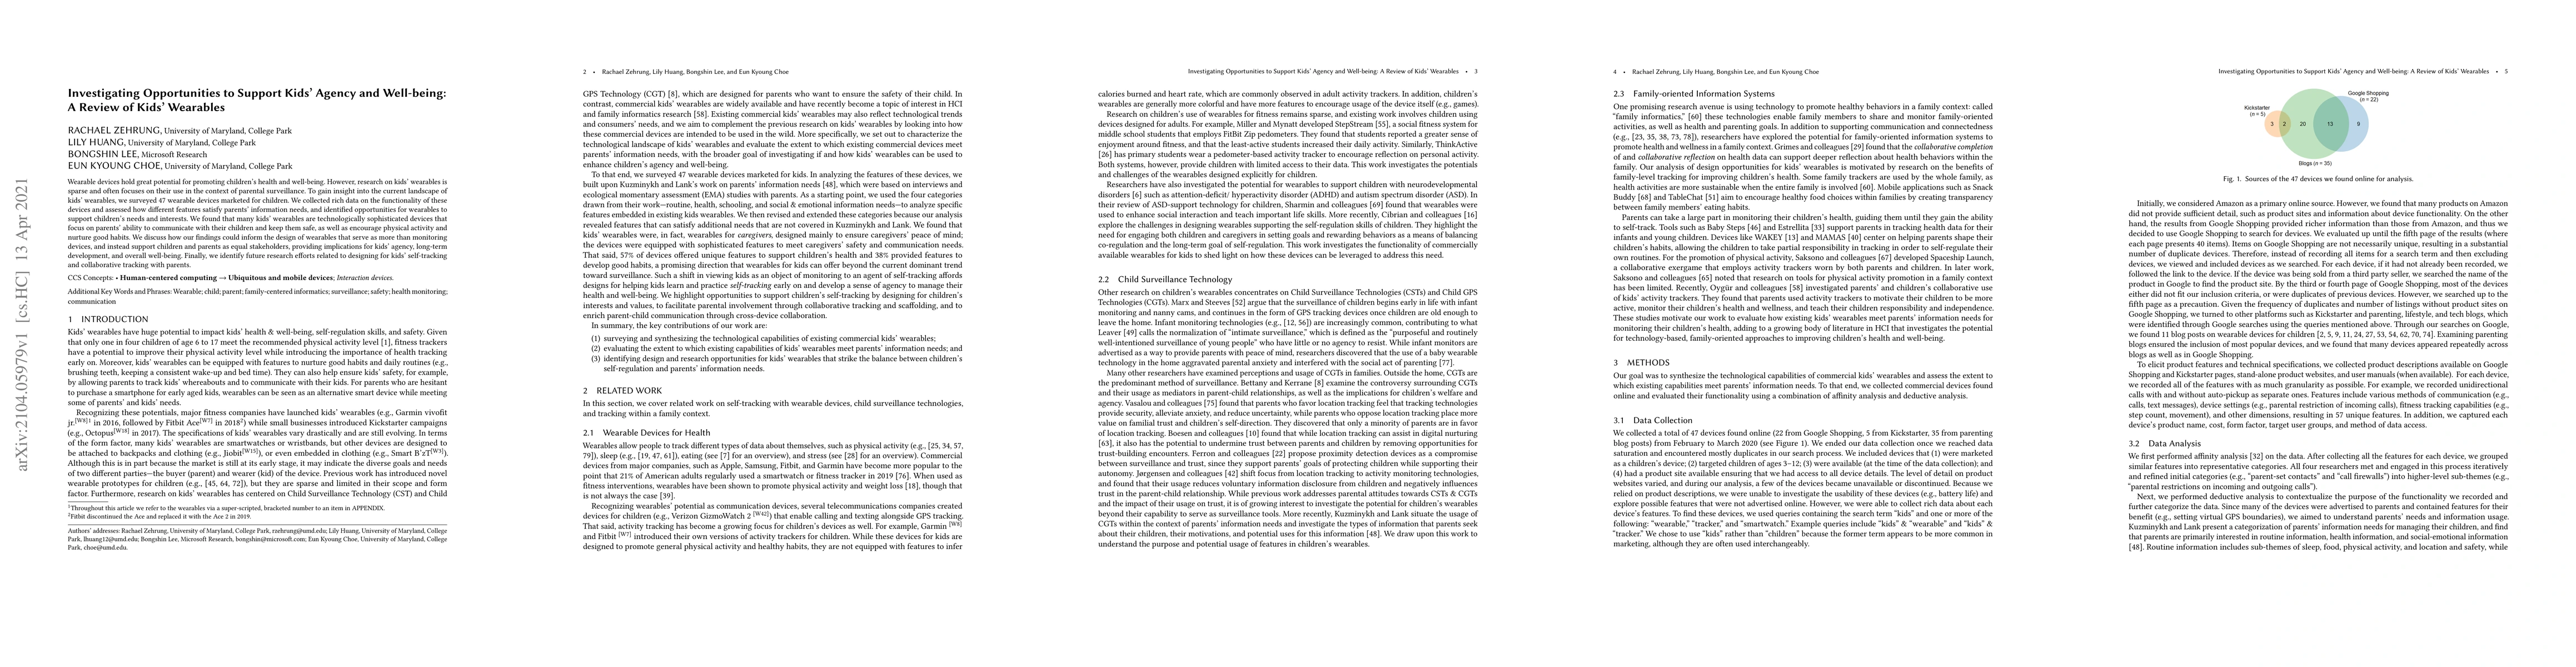
Wearable devices hold great potential for promoting children's health and well-being. However, research on kids' wearables is sparse and often focuses on their use in the context of parental surveil...
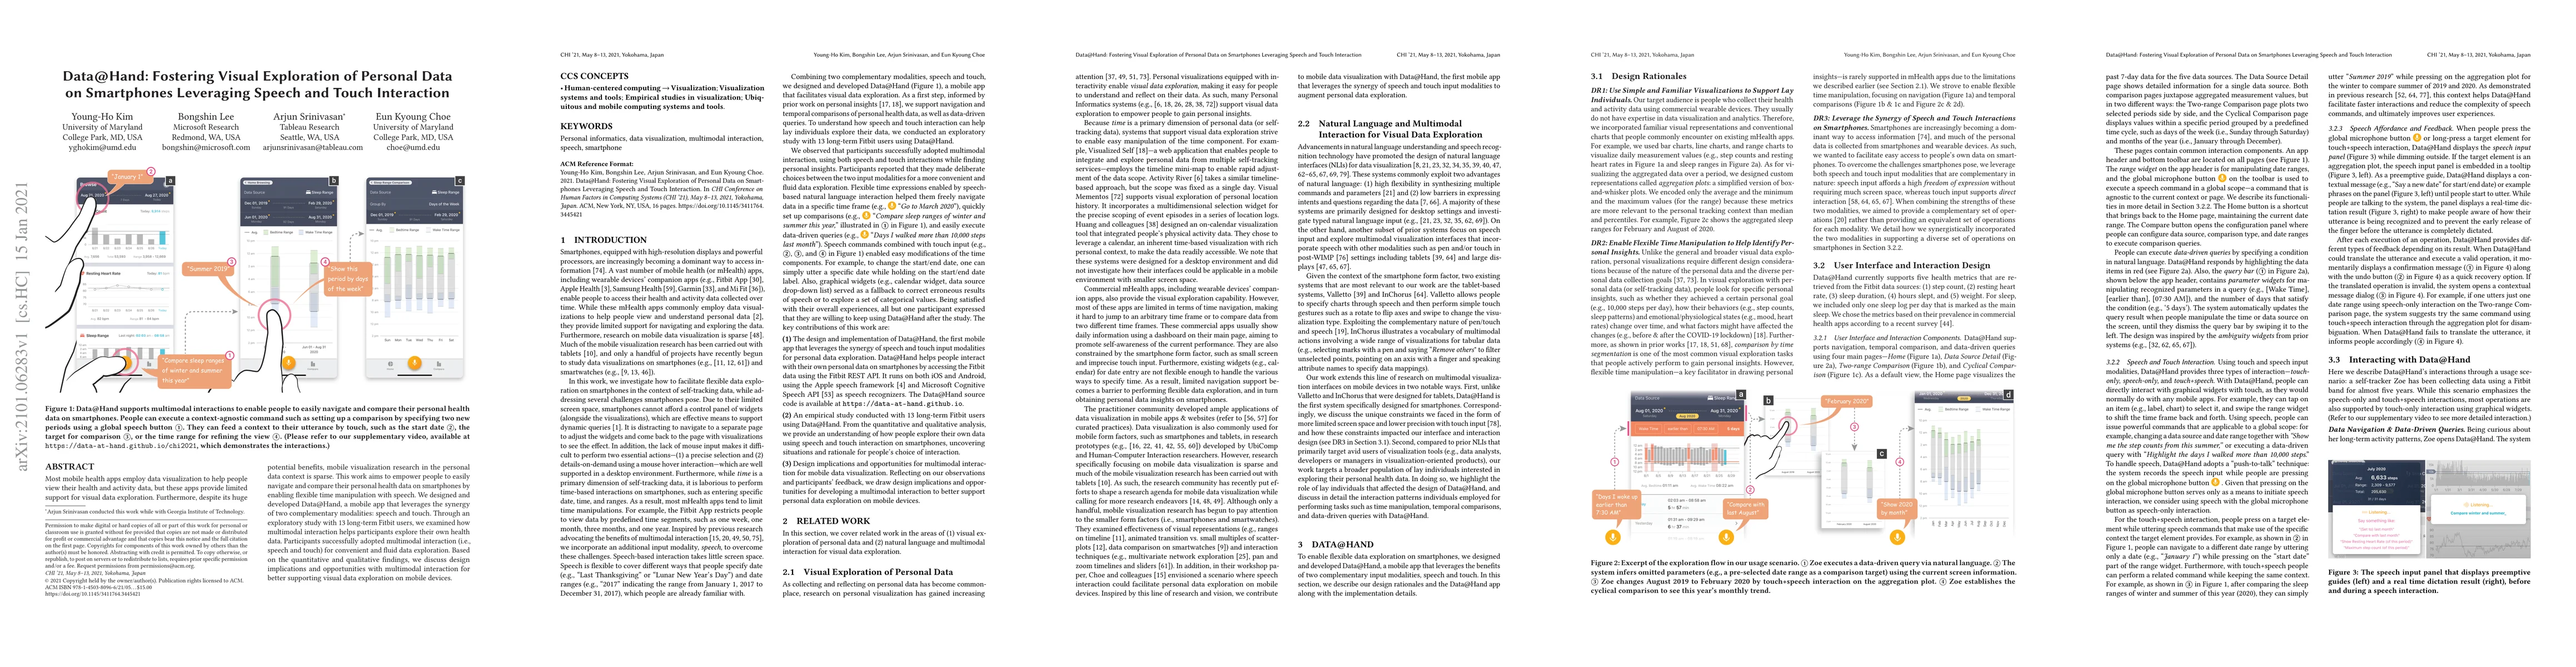
Most mobile health apps employ data visualization to help people view their health and activity data, but these apps provide limited support for visual data exploration. Furthermore, despite its hug...
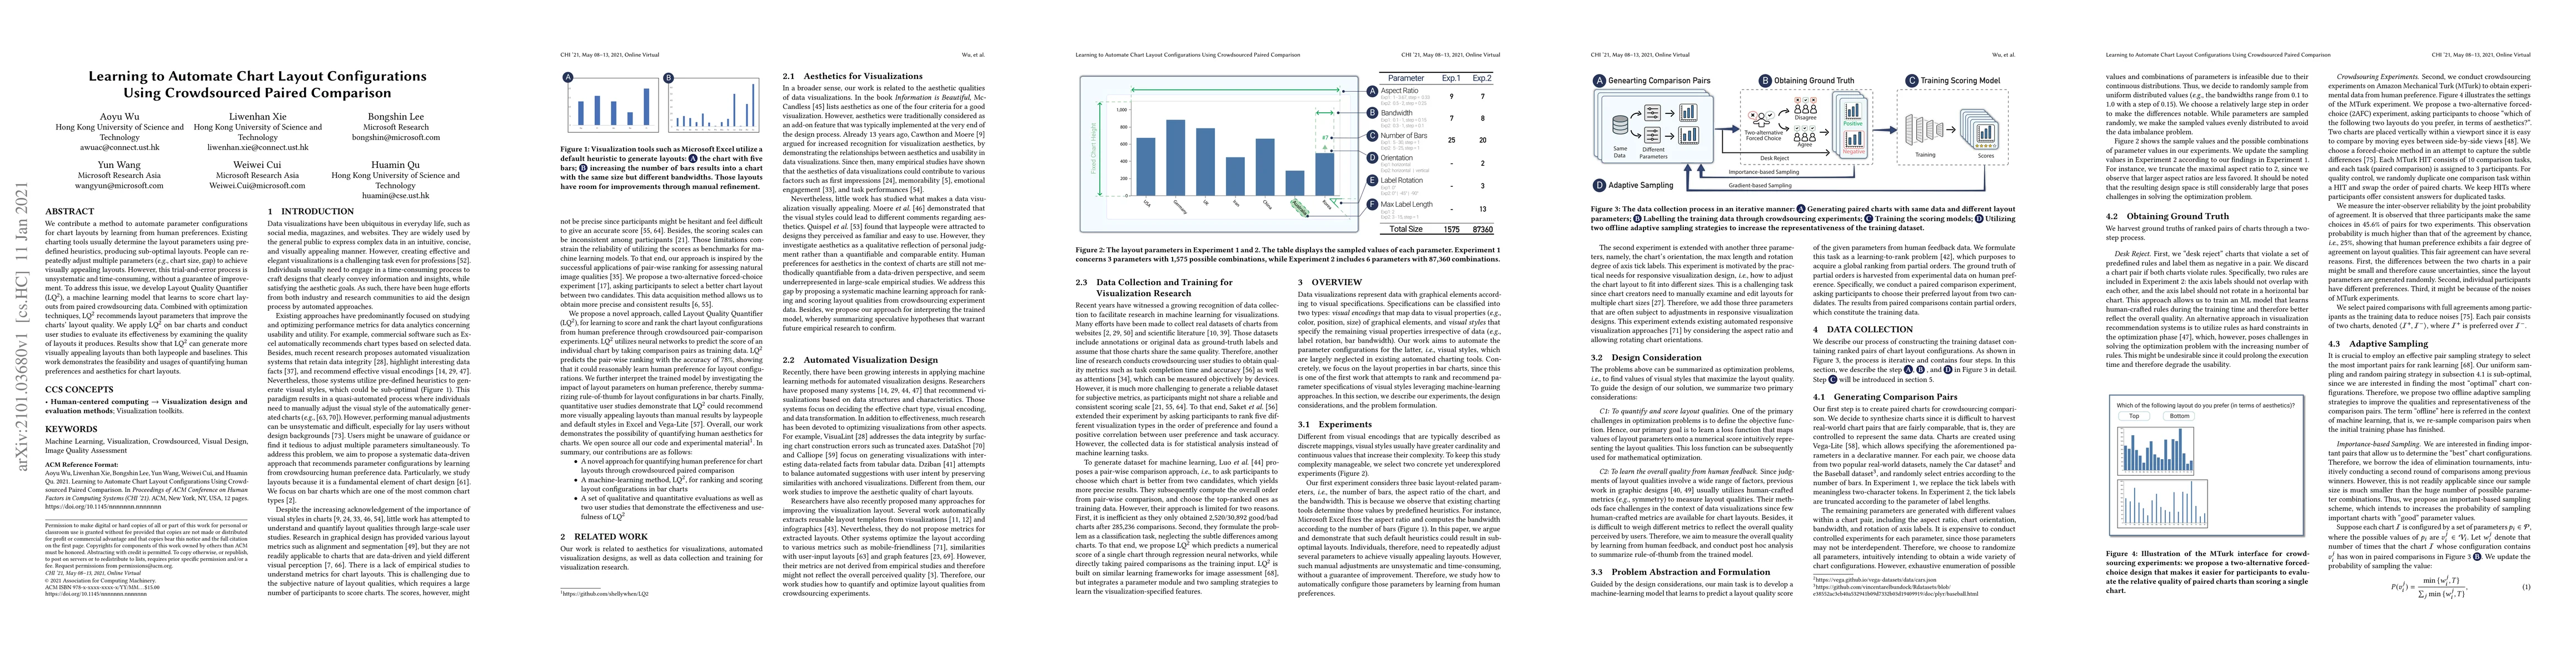
We contribute a method to automate parameter configurations for chart layouts by learning from human preferences. Existing charting tools usually determine the layout parameters using predefined heu...
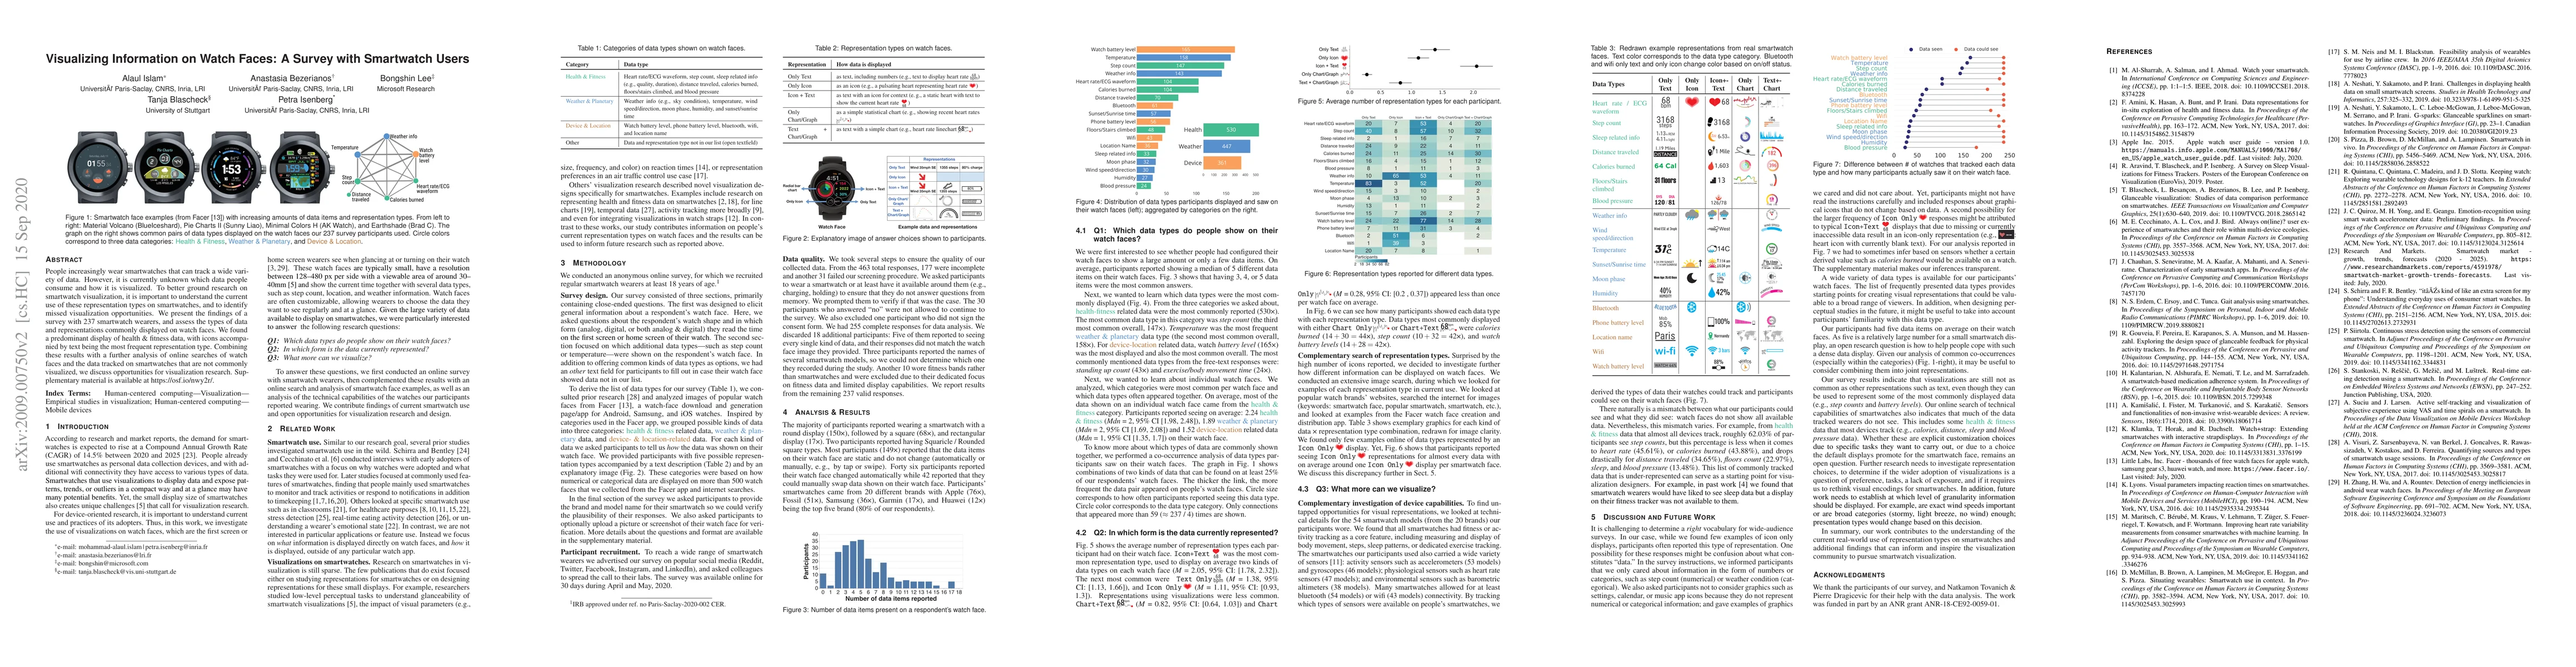
People increasingly wear smartwatches that can track a wide variety of data. However, it is currently unknown which data people consume and how it is visualized. To better ground research on smartwa...
We contribute MobileVisFixer, a new method to make visualizations more mobile-friendly. Although mobile devices have become the primary means of accessing information on the web, many existing visua...
Multimodal interfaces that combine direct manipulation and natural language have shown great promise for data visualization. Such multimodal interfaces allow people to stay in the flow of their visu...
While tablet devices are a promising platform for data visualization, supporting consistent interactions across different types of visualizations on tablets remains an open challenge. In this paper,...
An emerging generation of visualization authoring systems support expressive information visualization without textual programming. As they vary in their visualization models, system architectures, ...
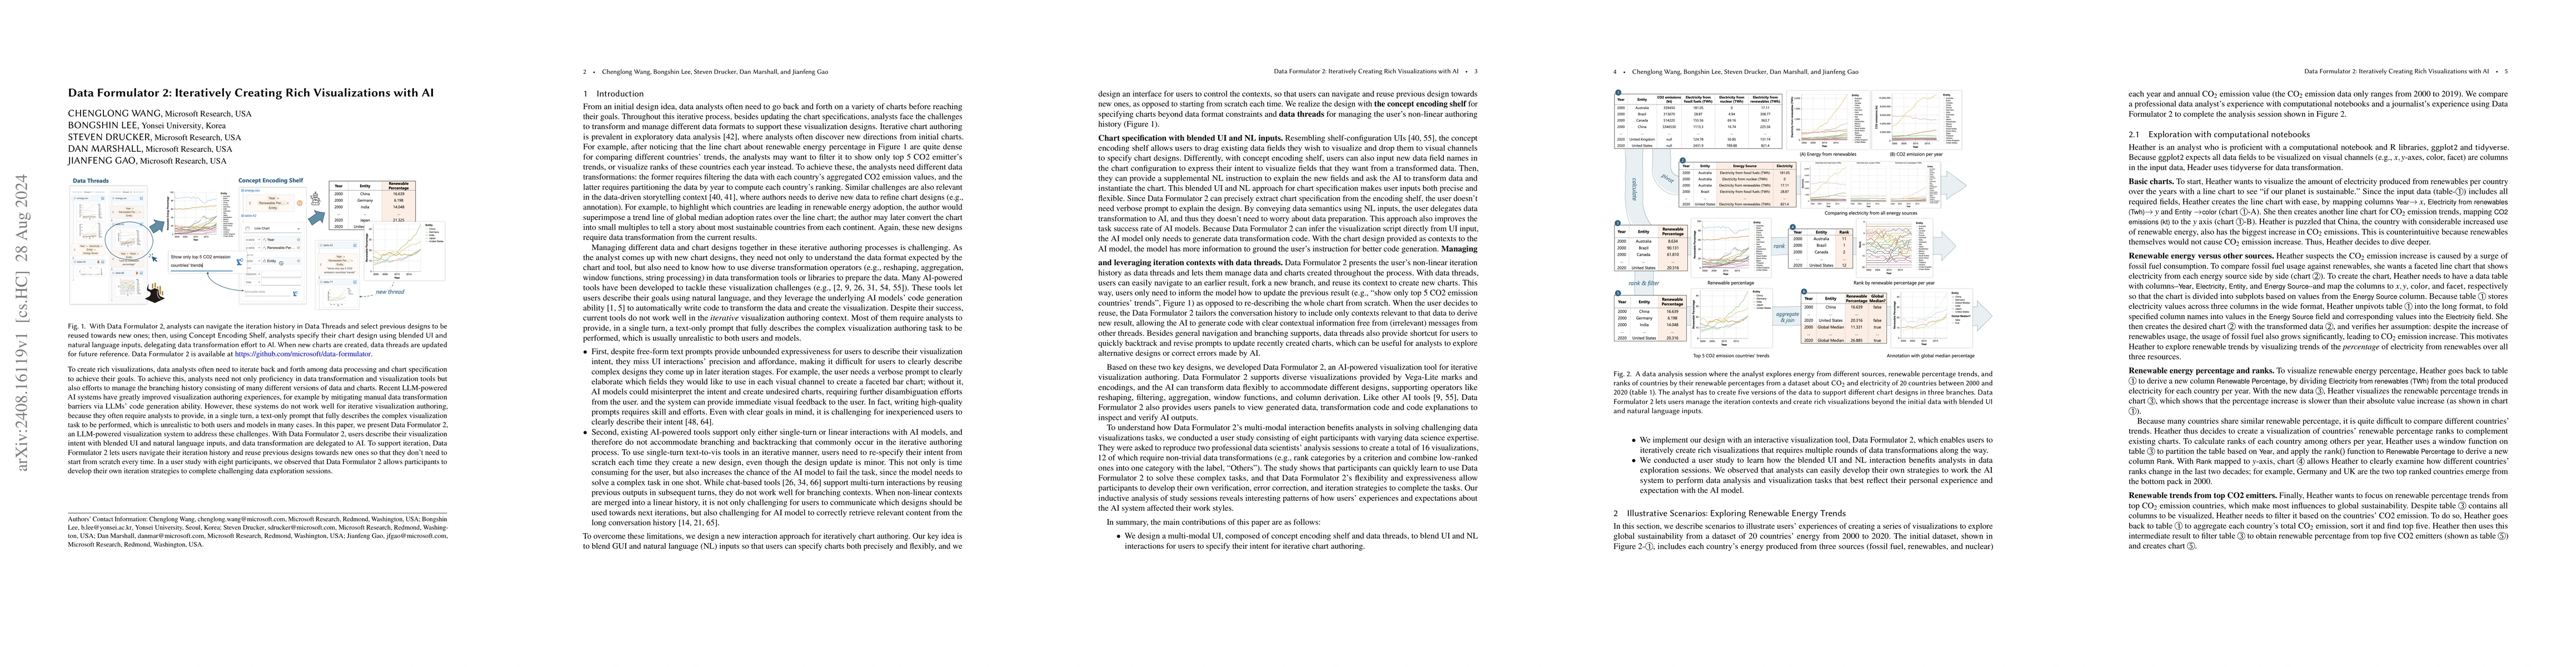
To create rich visualizations, data analysts often need to iterate back and forth among data processing and chart specification to achieve their goals. To achieve this, analysts need not only proficie...
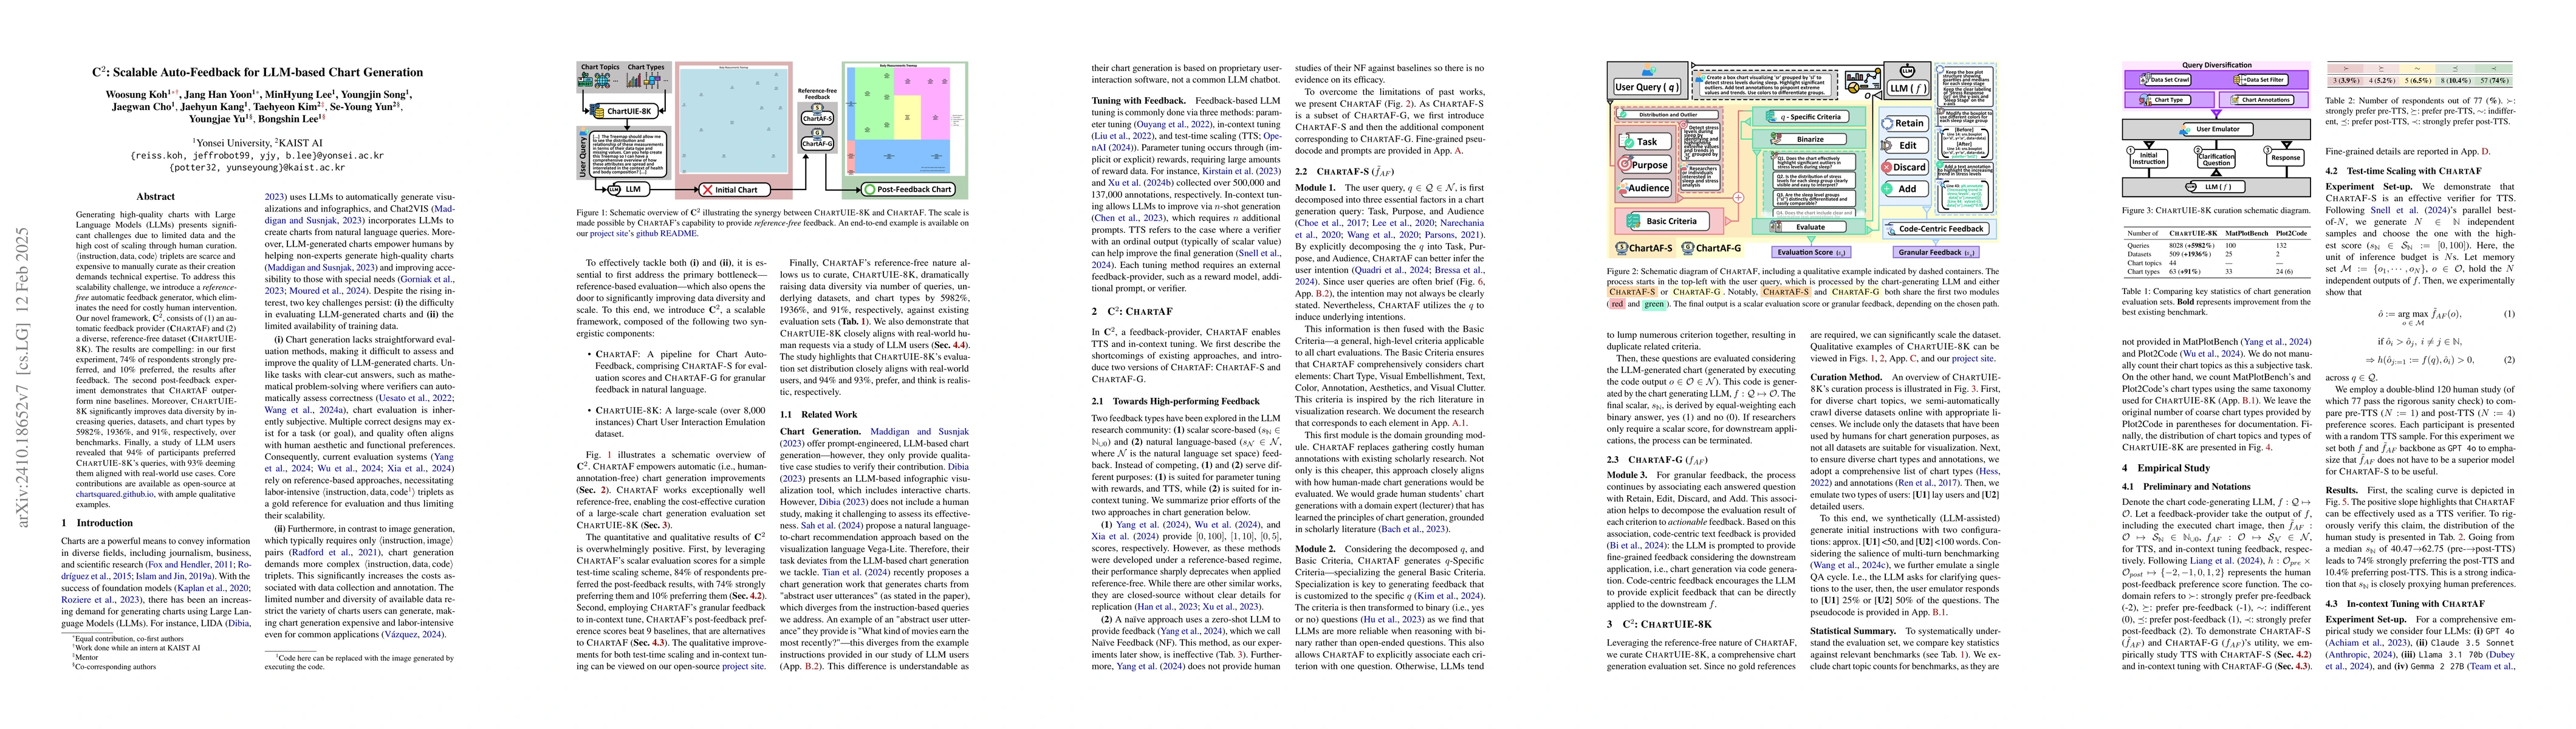
Generating high-quality charts with Large Language Models presents significant challenges due to limited data and the high cost of scaling through human curation. Instruction, data, and code triplets ...
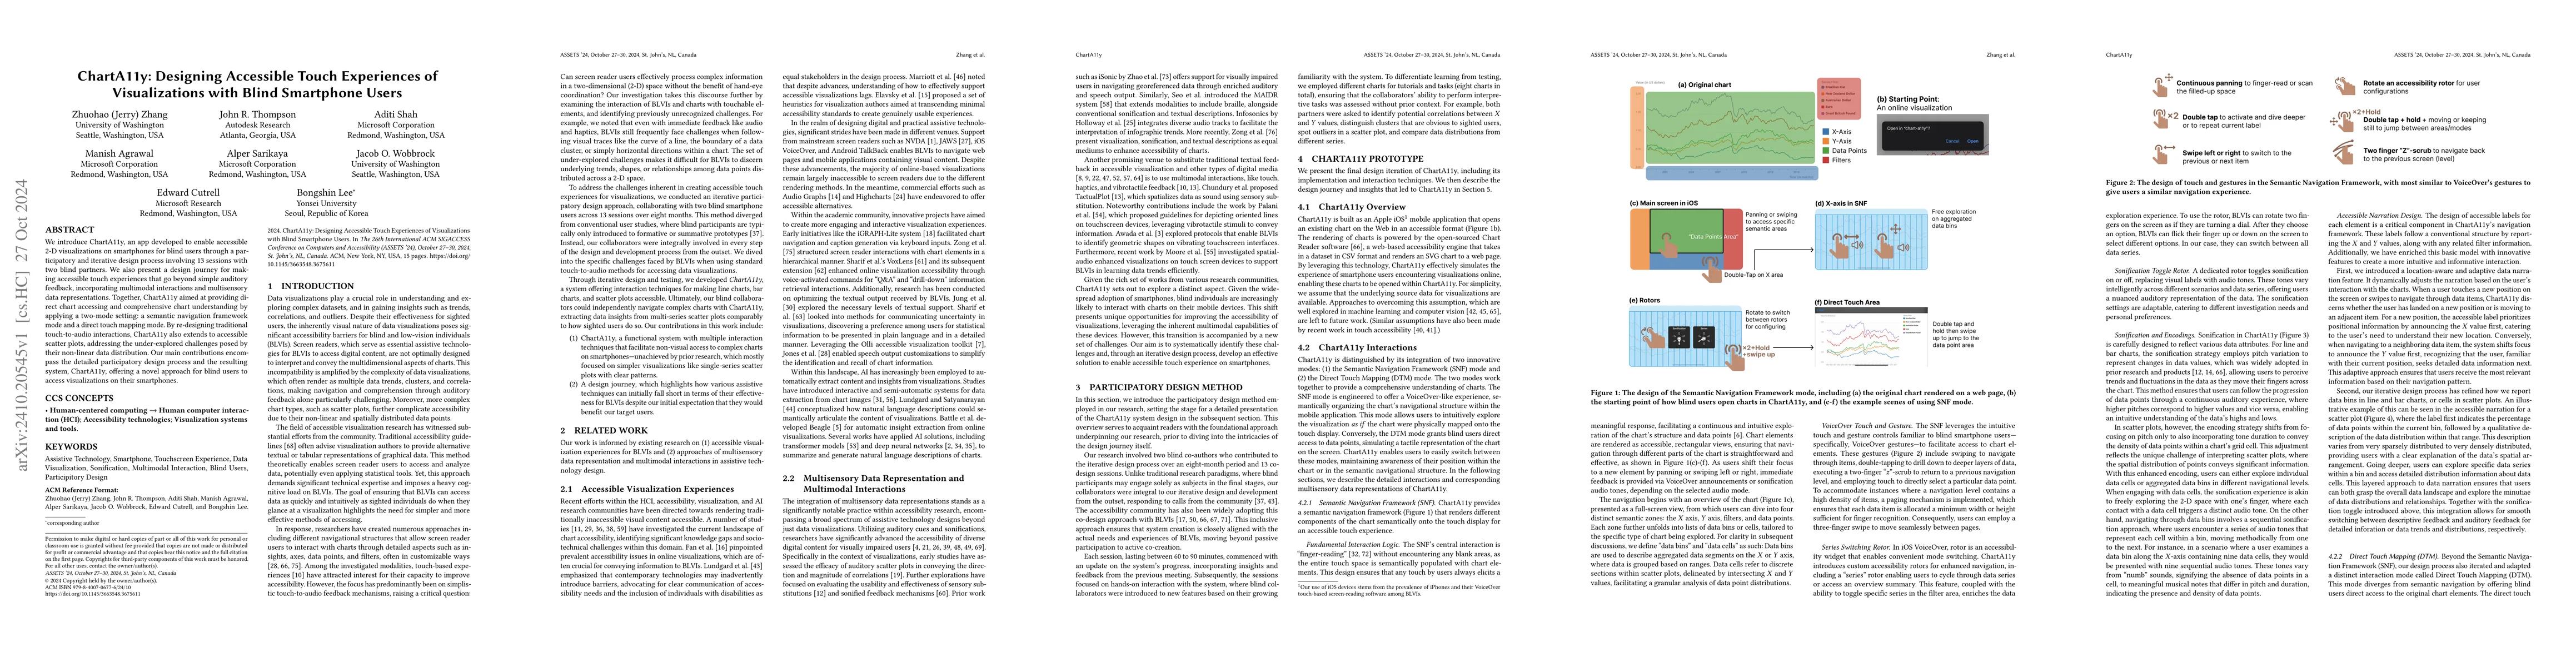
We introduce ChartA11y, an app developed to enable accessible 2-D visualizations on smartphones for blind users through a participatory and iterative design process involving 13 sessions with two blin...
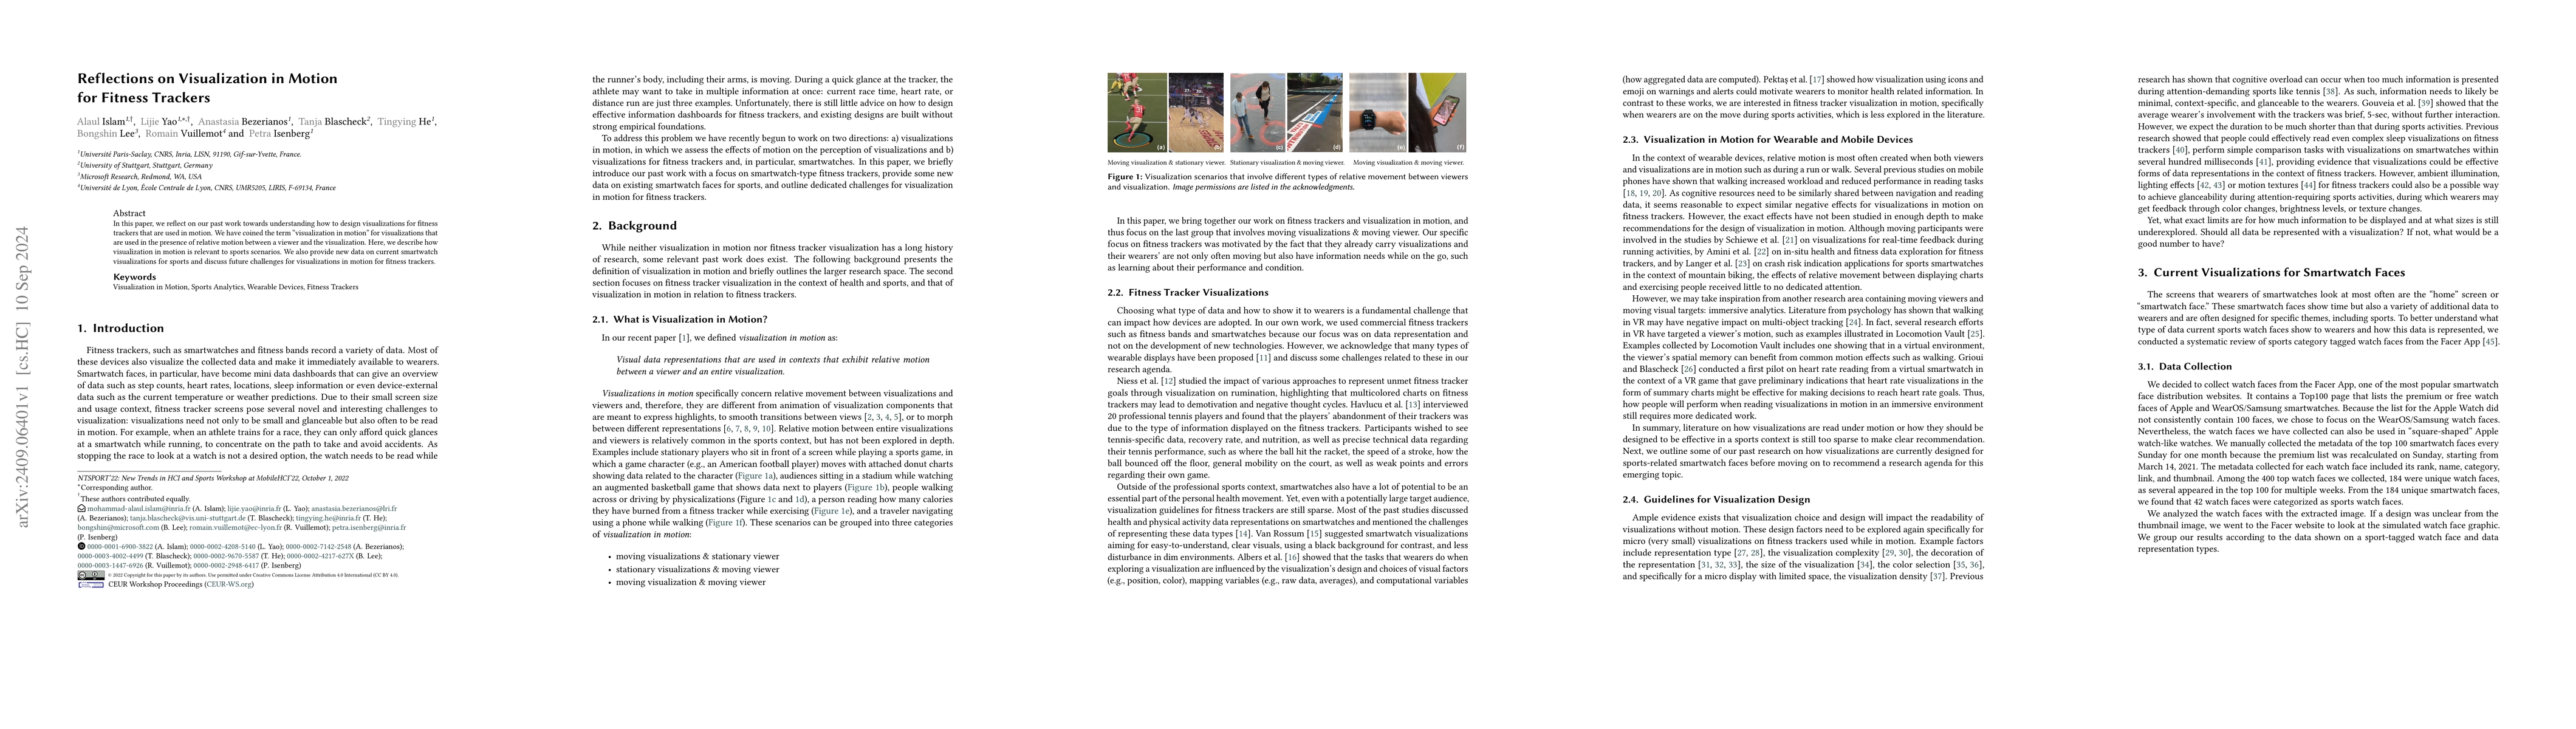
In this paper, we reflect on our past work towards understanding how to design visualizations for fitness trackers that are used in motion. We have coined the term "visualization in motion" for visual...
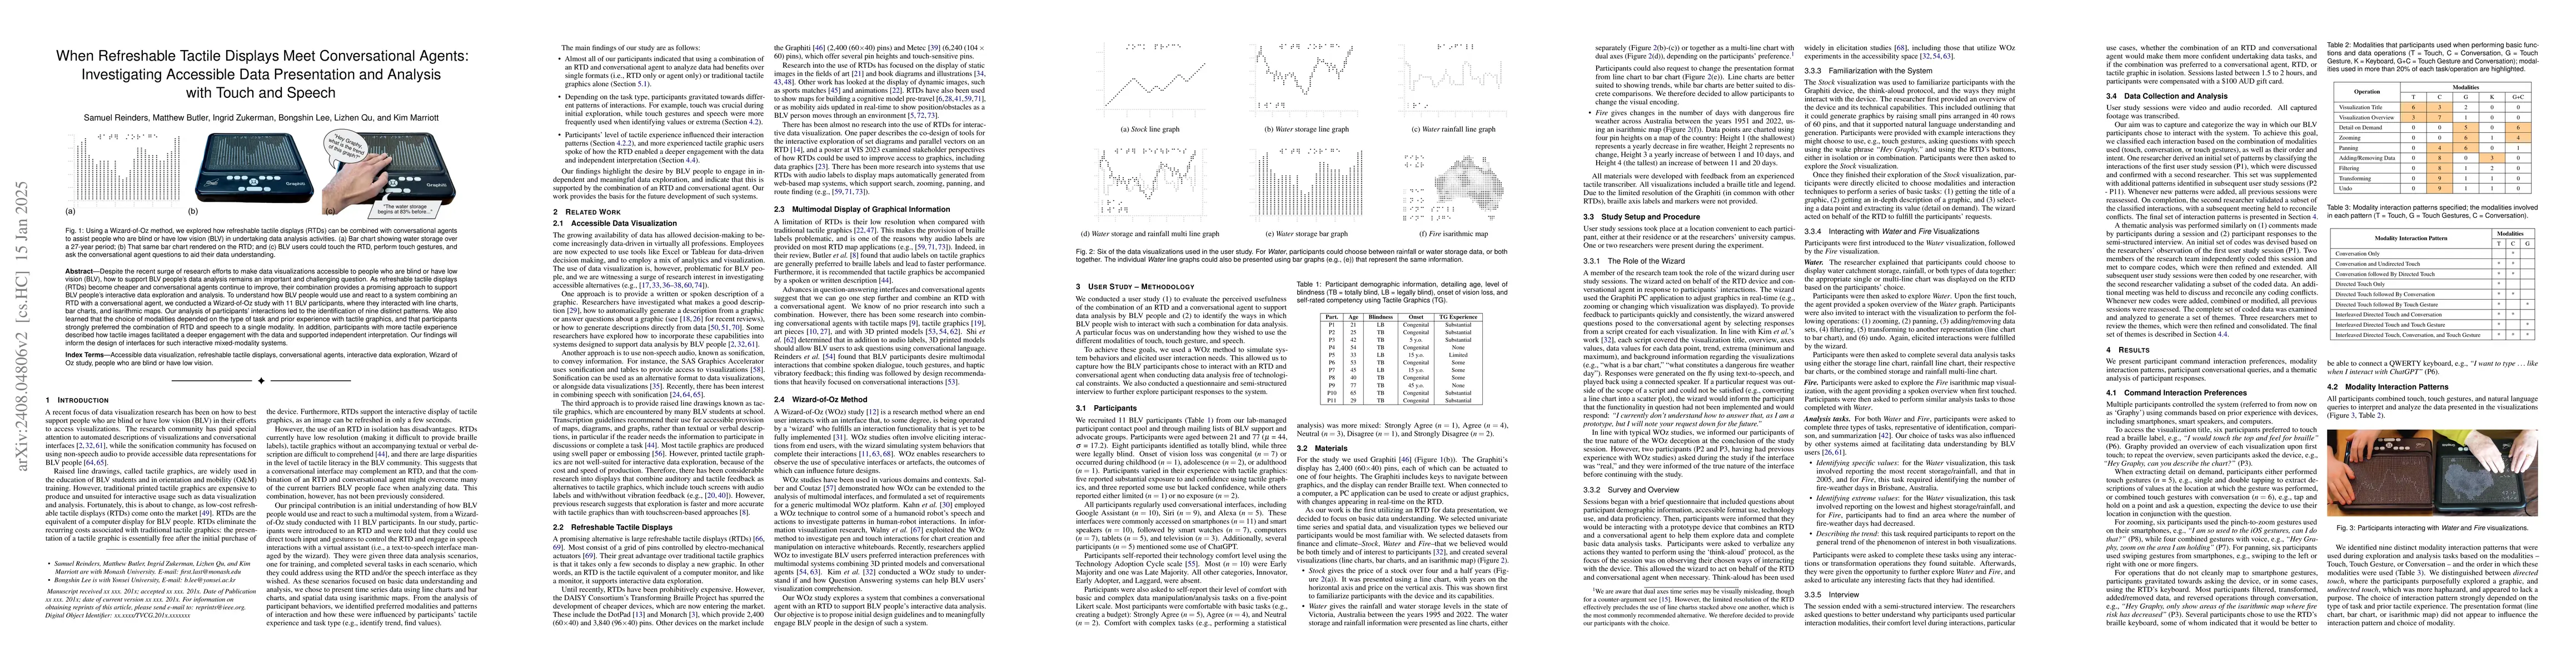
Despite the recent surge of research efforts to make data visualizations accessible to people who are blind or have low vision (BLV), how to support BLV people's data analysis remains an important and...
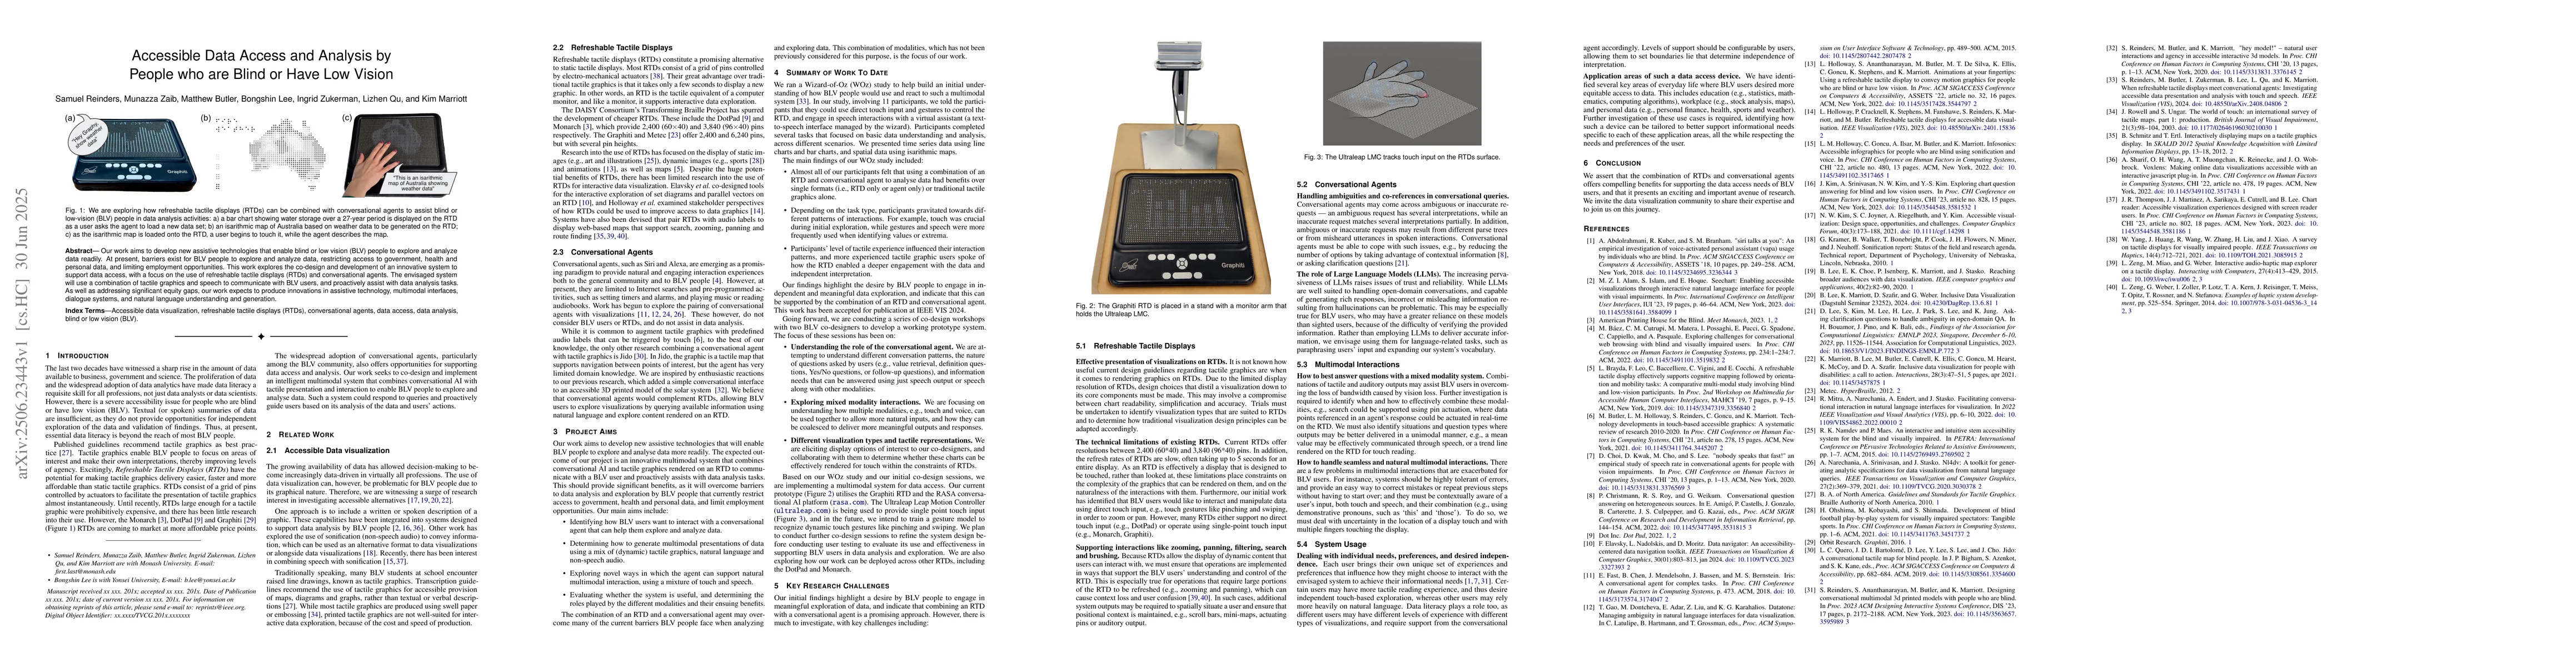
Our work aims to develop new assistive technologies that enable blind or low vision (BLV) people to explore and analyze data readily. At present, barriers exist for BLV people to explore and analyze d...
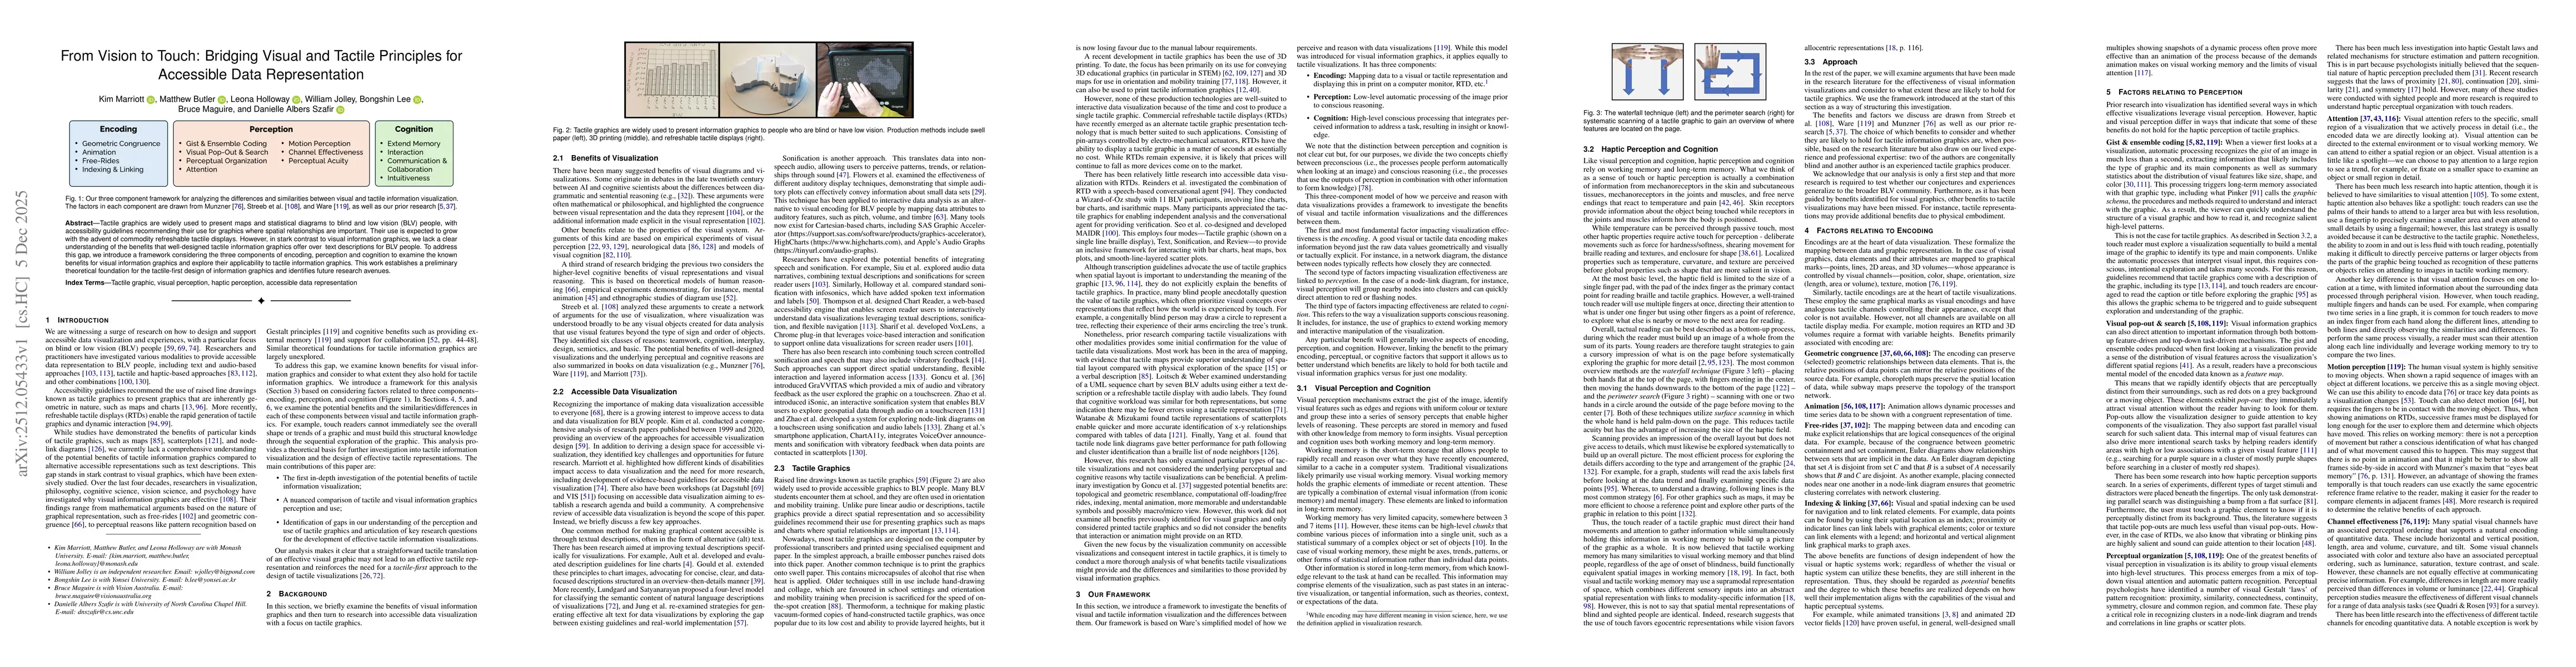
Tactile graphics are widely used to present maps and statistical diagrams to blind and low vision (BLV) people, with accessibility guidelines recommending their use for graphics where spatial relation...
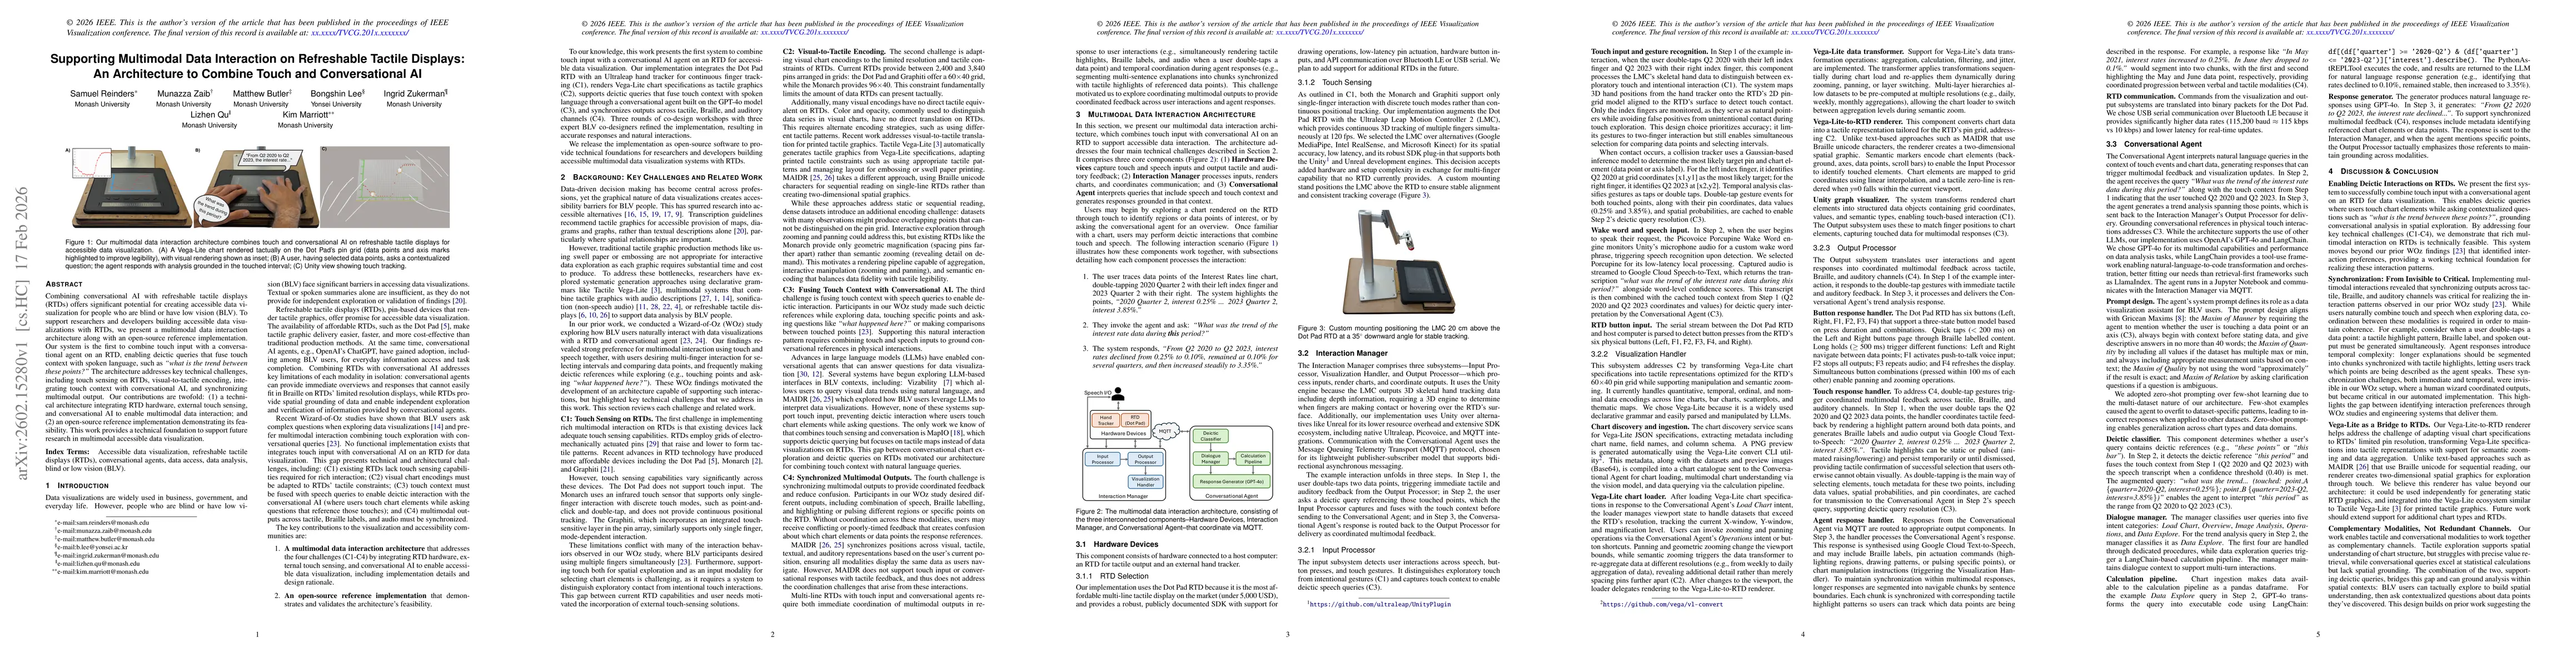
Combining conversational AI with refreshable tactile displays (RTDs) offers significant potential for creating accessible data visualization for people who are blind or have low vision (BLV). To suppo...
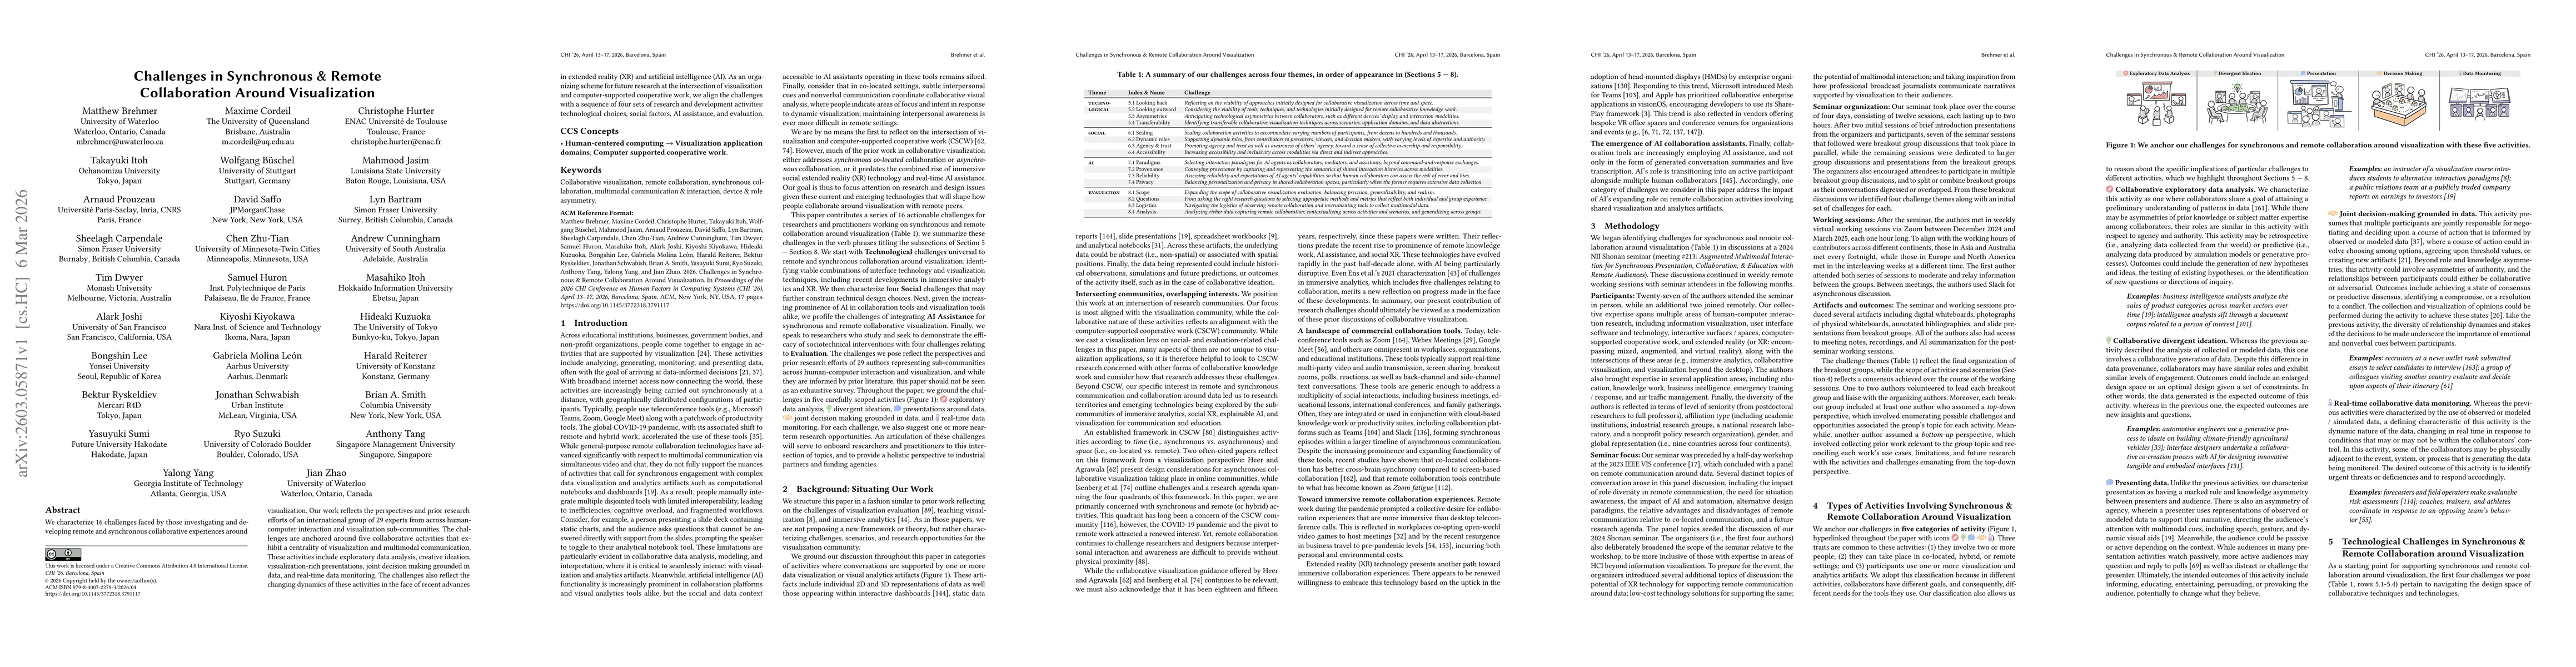
We characterize 16 challenges faced by those investigating and developing remote and synchronous collaborative experiences around visualization. Our work reflects the perspectives and prior research e...
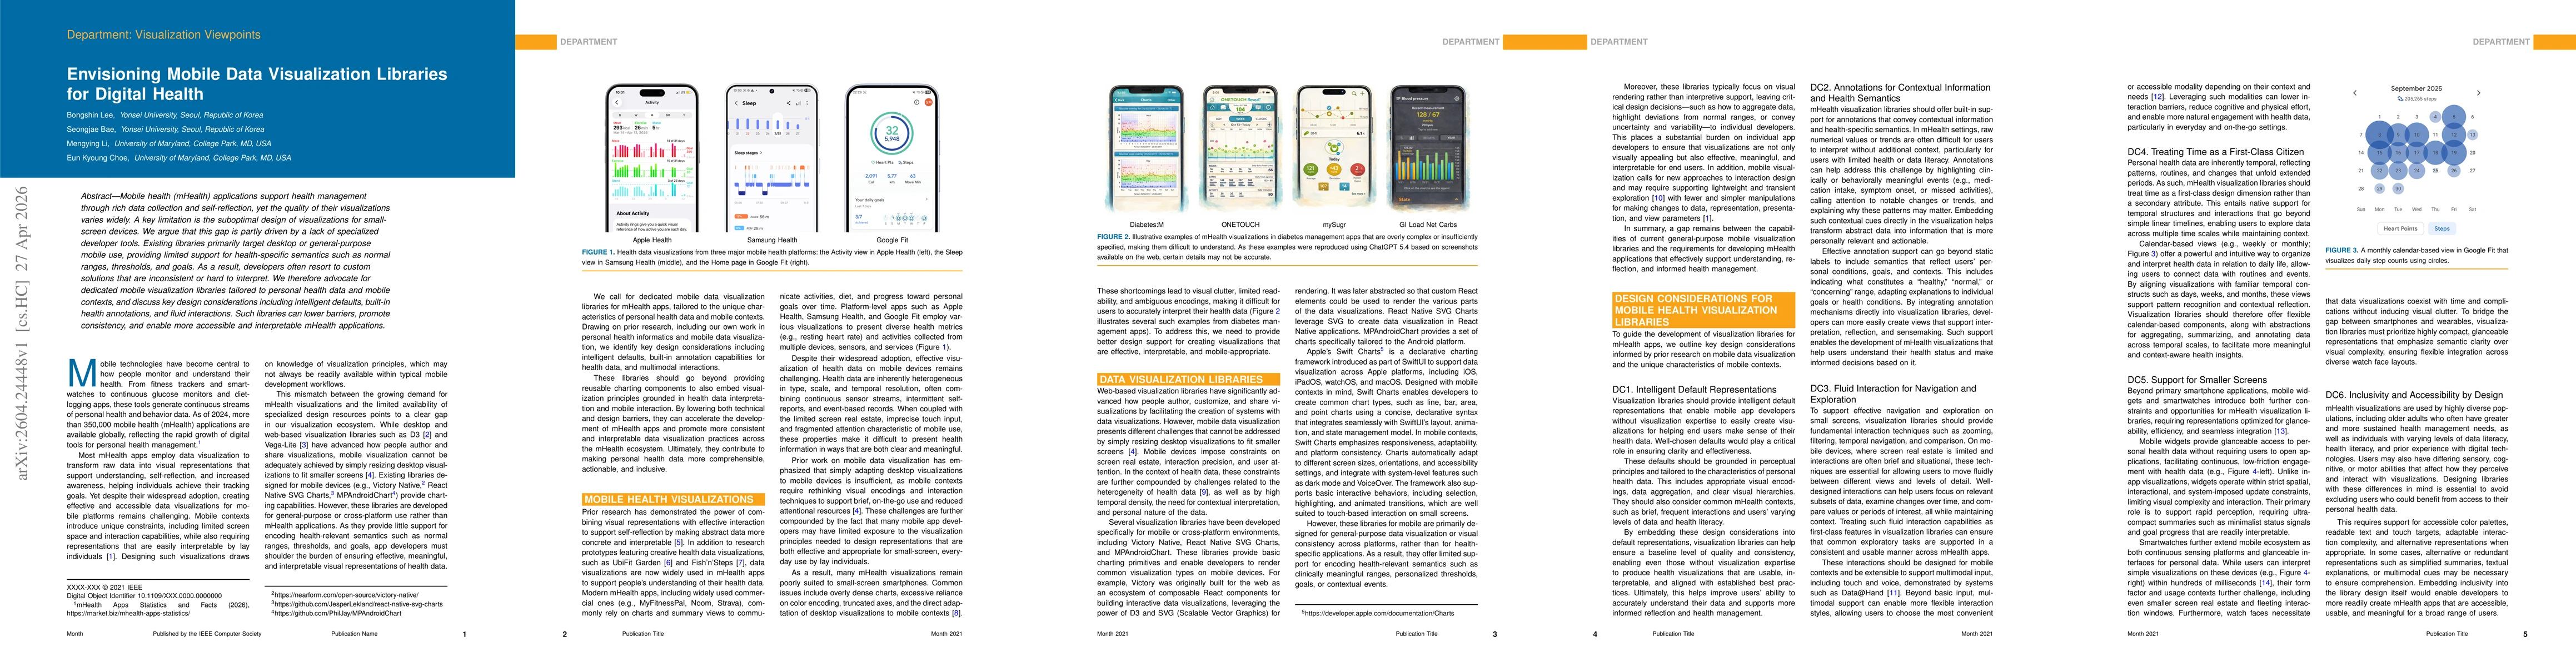
Mobile health (mHealth) applications support health management through rich data collection and self-reflection, yet the quality of their visualizations varies widely. A key limitation is the suboptim...
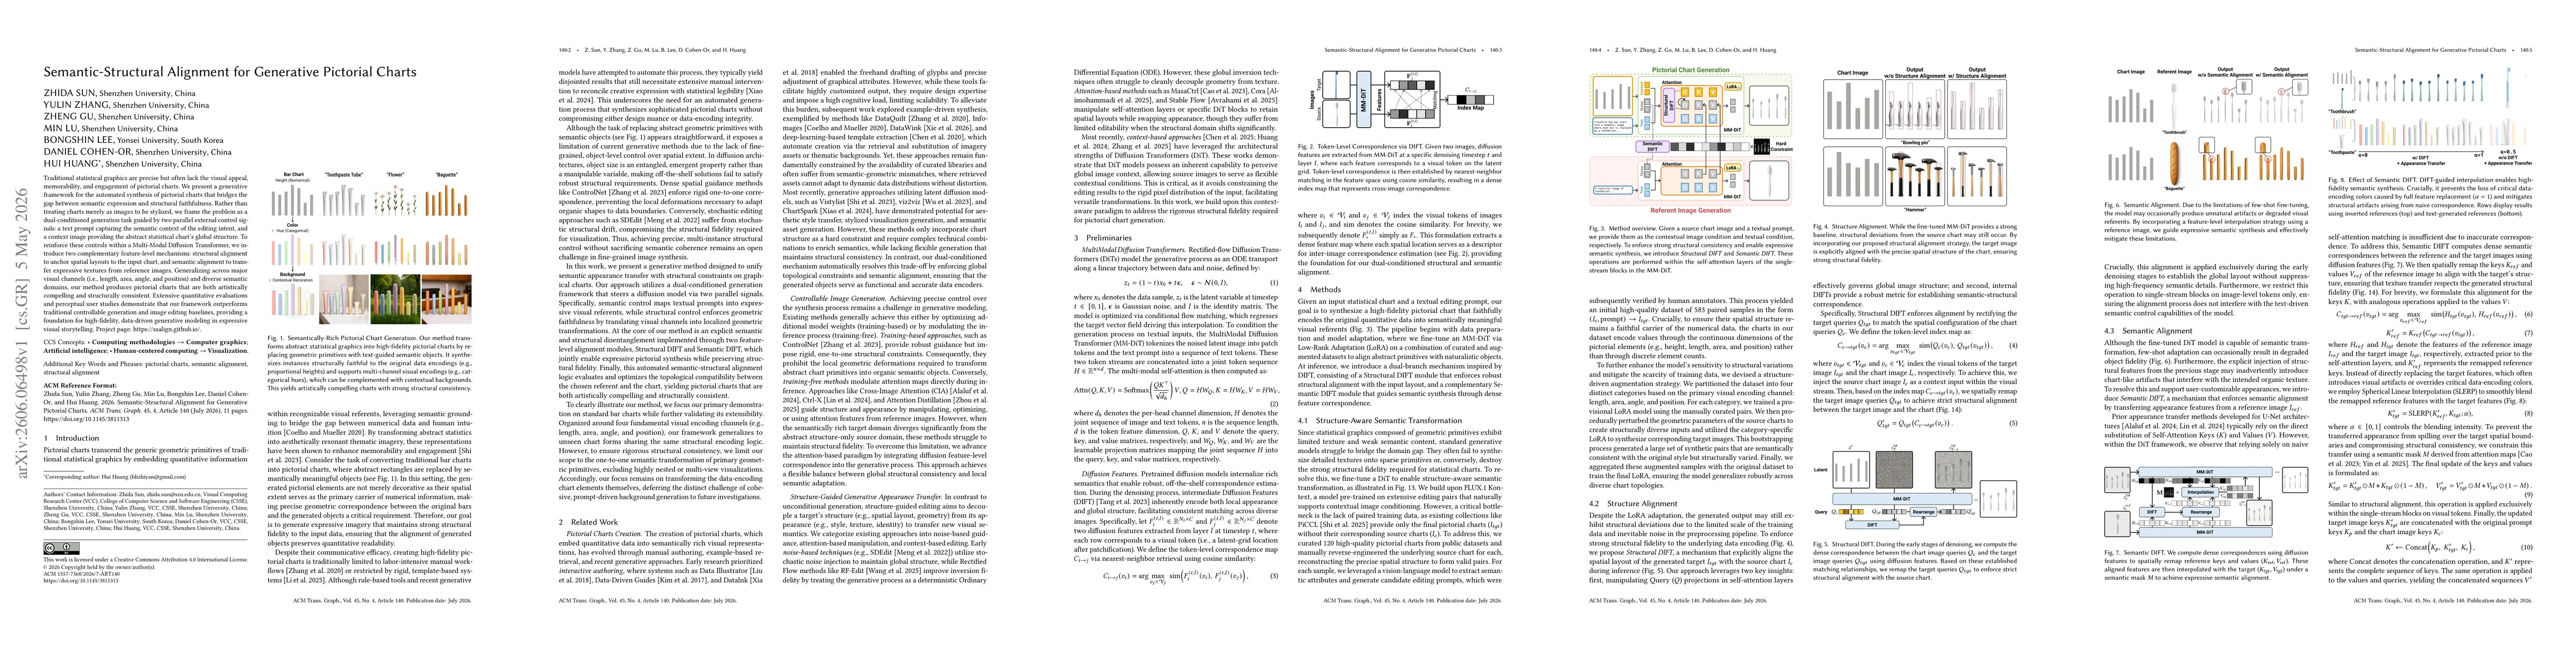
Traditional statistical graphics are precise but often lack the visual appeal, memorability, and engagement of pictorial charts. We present a generative framework for the automated synthesis of pictor...