Data Formulator 2: Iteratively Creating Rich Visualizations with AI
Publication
Metrics
AI Quick Summary
Data Formulator 2 is an AI-powered system that enhances iterative visualization creation by combining UI and natural language inputs to simplify data transformation, and it supports iteration through history navigation and design reuse. User study results indicate it enables analysts to effectively develop their own strategies for complex data exploration.
Paper Preview
Abstract
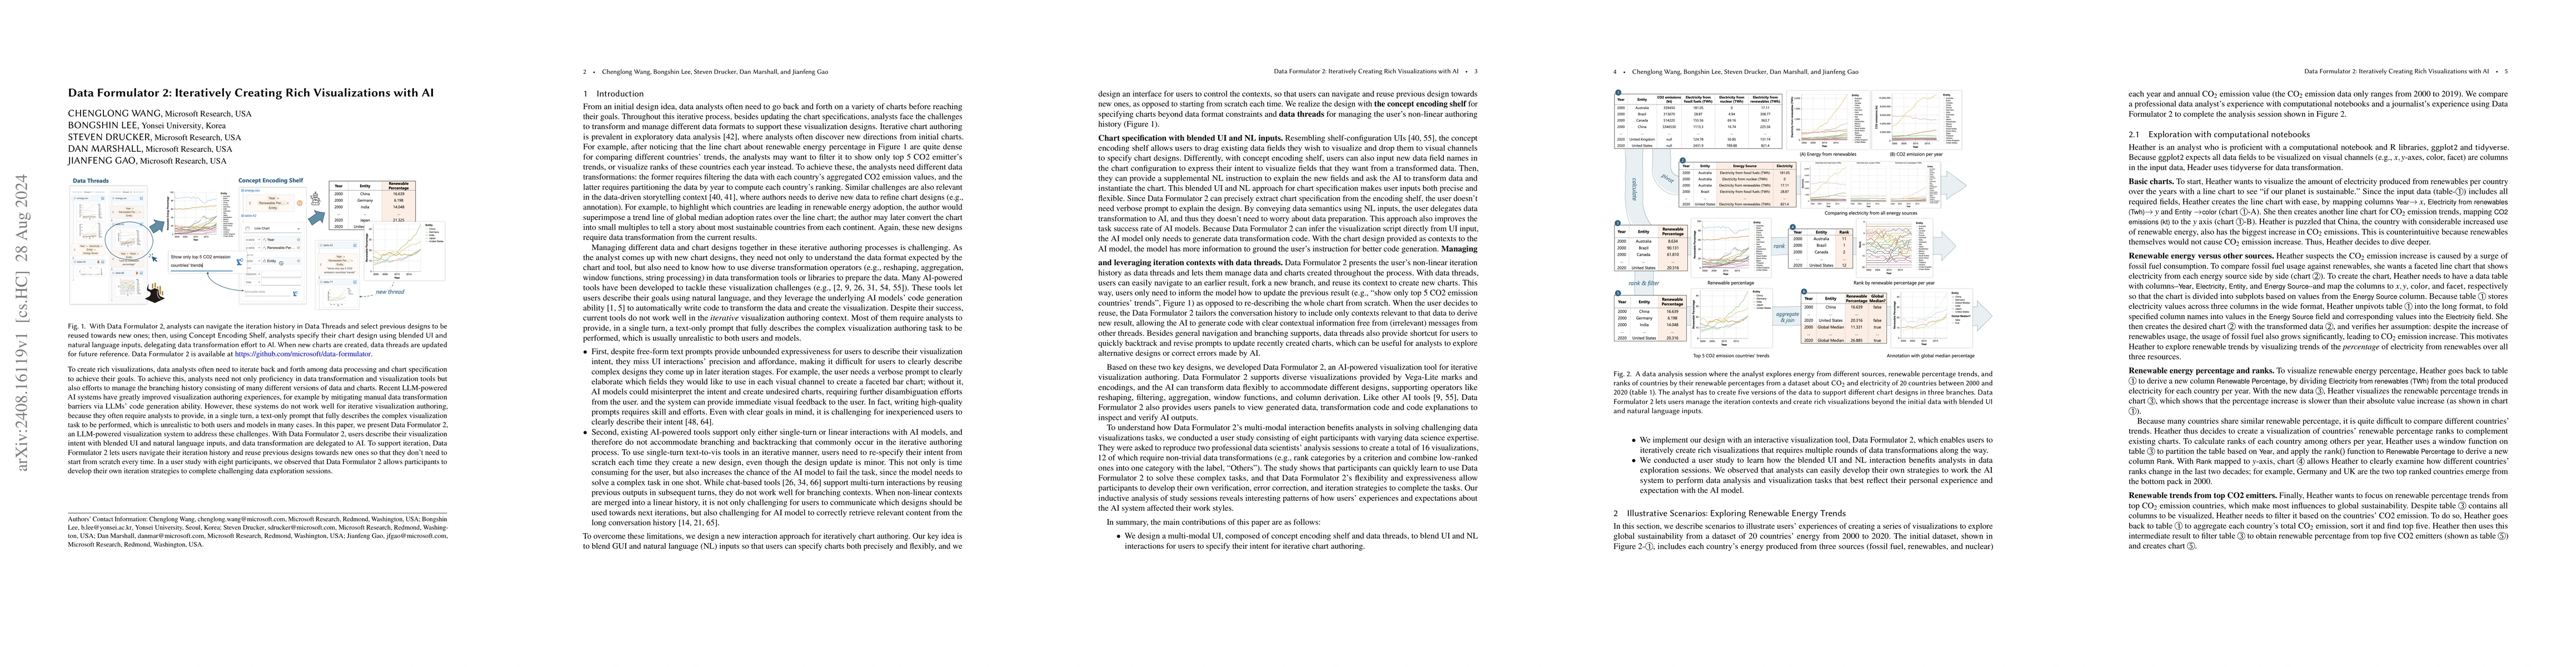
To create rich visualizations, data analysts often need to iterate back and forth among data processing and chart specification to achieve their goals. To achieve this, analysts need not only proficiency in data transformation and visualization tools but also efforts to manage the branching history consisting of many different versions of data and charts. Recent LLM-powered AI systems have greatly improved visualization authoring experiences, for example by mitigating manual data transformation barriers via LLMs' code generation ability. However, these systems do not work well for iterative visualization authoring, because they often require analysts to provide, in a single turn, a text-only prompt that fully describes the complex visualization task to be performed, which is unrealistic to both users and models in many cases. In this paper, we present Data Formulator 2, an LLM-powered visualization system to address these challenges. With Data Formulator 2, users describe their visualization intent with blended UI and natural language inputs, and data transformation are delegated to AI. To support iteration, Data Formulator 2 lets users navigate their iteration history and reuse previous designs towards new ones so that they don't need to start from scratch every time. In a user study with eight participants, we observed that Data Formulator 2 allows participants to develop their own iteration strategies to complete challenging data exploration sessions.
AI Key Findings
Get AI-generated insights about this paper's methodology, results, significance, and more — seven facets brought into focus.
Impact
Authors
PDF Preview
Citation Network
Current paper (gray), citations (green), references (blue)
Display is limited for performance on very large graphs.
Discussion 0