This study explores how combining refreshable tactile displays with conversational agents can improve data analysis for people who are blind or have low vision (BLV). Through a Wizard-of-Oz study, researchers found that participants preferred using both tactile graphics and speech, indicating deeper engagement with data for those with more tactile experience. The results suggest design improvements for mixed-modality interfaces.
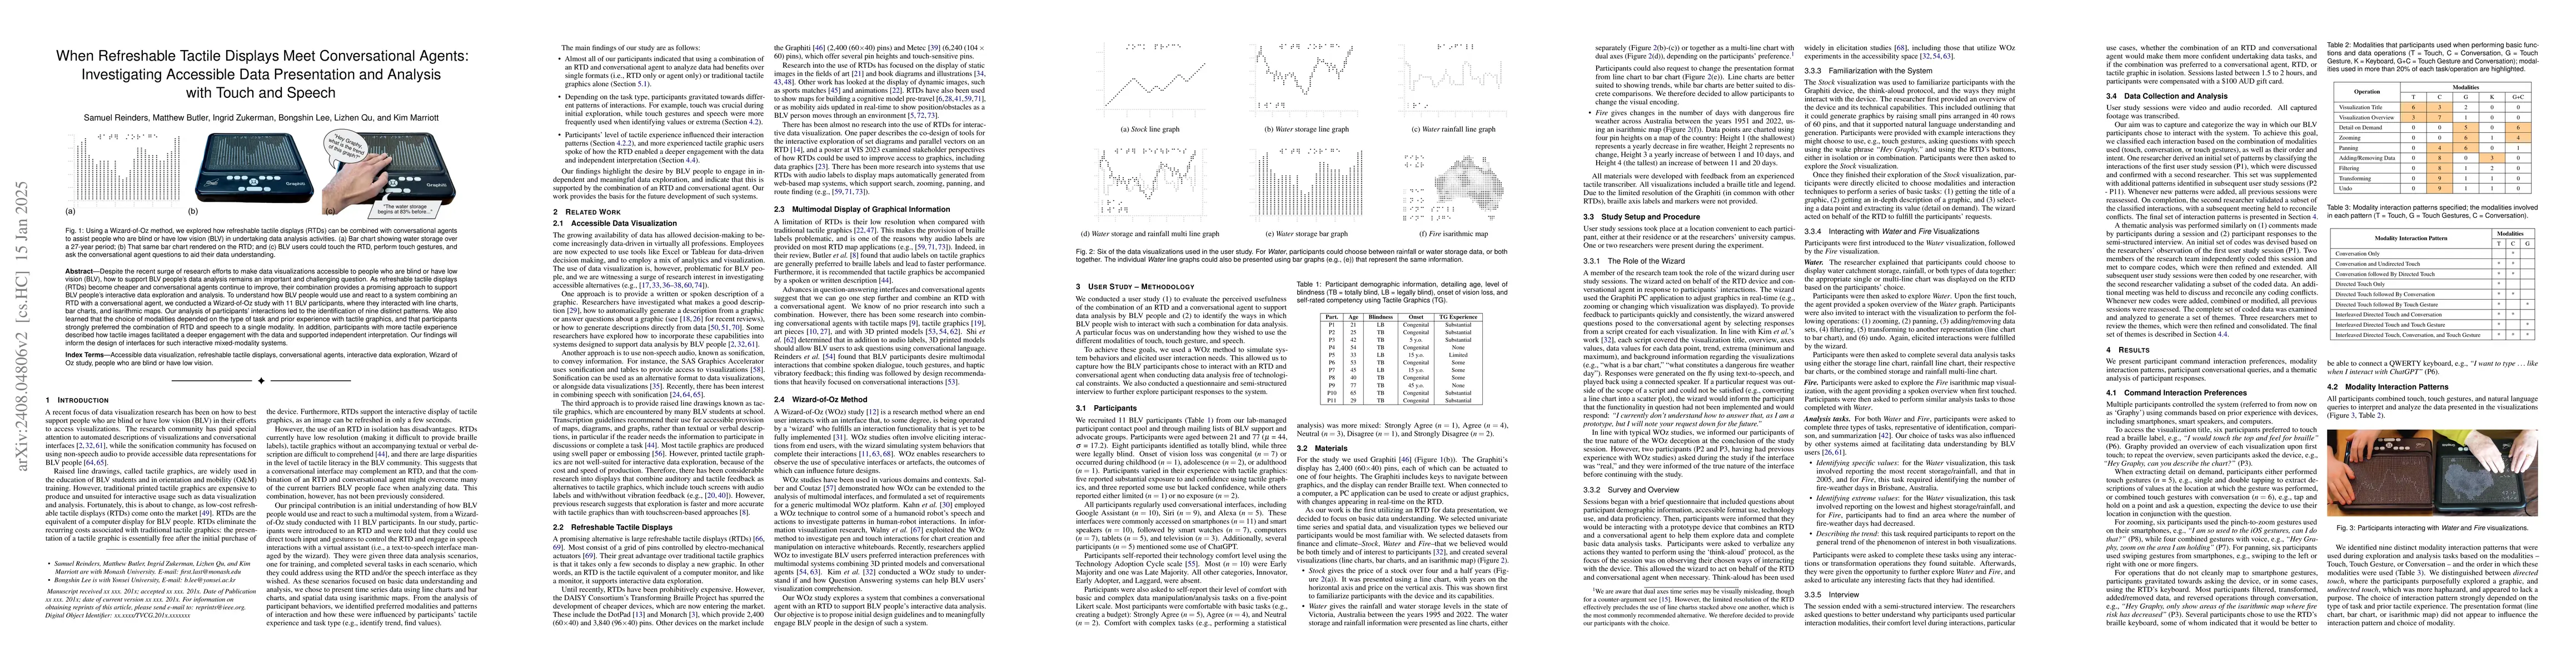
Despite the recent surge of research efforts to make data visualizations accessible to people who are blind or have low vision (BLV), how to support BLV people's data analysis remains an important and challenging question. As refreshable tactile displays (RTDs) become cheaper and conversational agents continue to improve, their combination provides a promising approach to support BLV people's interactive data exploration and analysis. To understand how BLV people would use and react to a system combining an RTD with a conversational agent, we conducted a Wizard-of-Oz study with 11 BLV participants, where they interacted with line charts, bar charts, and isarithmic maps. Our analysis of participants' interactions led to the identification of nine distinct patterns. We also learned that the choice of modalities depended on the type of task and prior experience with tactile graphics, and that participants strongly preferred the combination of RTD and speech to a single modality. In addition, participants with more tactile experience described how tactile images facilitated a deeper engagement with the data and supported independent interpretation. Our findings will inform the design of interfaces for such interactive mixed-modality systems.
Get AI-generated insights about this paper's methodology, results, and significance.
Current paper (gray), citations (green), references (blue)
Matthew Butler, Leona Holloway, Peter Cracknell et al.
Rainer Stiefelhagen, Omar Moured, Thorsten Schwarz et al.
Title | Authors | Year | Actions |
---|---|---|---|
"They Aren't Built For Me": A Replication Study of Visual Graphical Perception with Tactile Representations of Data for Visually Impaired Users
|
Areen Khalaila, Lane Harrison, Nam Wook Kim, Dylan Cashman
|
2024
|
View Paper |
Title | Authors | Year | Actions |
---|---|---|---|
ChartA11y: Designing Accessible Touch Experiences of Visualizations with Blind Smartphone Users
|
Zhuohao Zhang, John R. Thompson, Aditi Shah, Manish Agrawal, Alper Sarikaya, Jacob O. Wobbrock, Edward Cutrell, Bongshin Lee
|
2024
|
View Paper |
MAIDR: Making Statistical Visualizations Accessible with Multimodal Data Representation
|
JooYoung Seo, Yilin Xia, Bongshin Lee, Sean McCurry, Yu Jun Yam
|
2024
|
View Paper |
Refreshable Tactile Displays for Accessible Data Visualisation
|
Leona Holloway, Peter Cracknell, Kate Stephens, Melissa Fanshawe, Samuel Reinders, Kim Marriott, Matthew Butler
|
2024
|
View Paper |
Data Navigator: An Accessibility-Centered Data Navigation Toolkit
|
Frank Elavsky, Lucas Nadolskis, Dominik Moritz
|
2023
|
View Paper |
Designing Conversational Multimodal 3D Printed Models with People who are Blind
|
Samuel Reinders, S. Ananthanarayan, M. Butler, K. Marriott
|
2023
|
View Paper |
Exploring Chart Question Answering for Blind and Low Vision Users
|
Jiho Kim, Arjun Srinivasan, N. Kim, Yea-Seul Kim
|
2023
|
View Paper |
Chart Reader: Accessible Visualization Experiences Designed with Screen Reader Users
|
John Thompson, Jesse J Martinez, Alper Sarıkaya, Edward Cutrell, Bongshin Lee
|
2023
|
View Paper |
Accessible graphics
|
2023
|
View Paper | |
SeeChart: Enabling Accessible Visualizations Through Interactive Natural Language Interface For People with Visual Impairments
|
Md. Zubair Ibne Alam, Shehnaz Islam, Enamul Hoque
|
2023
|
View Paper |
Animations at Your Fingertips: Using a Refreshable Tactile Display to Convey Motion Graphics for People who are Blind or have Low Vision
|
Leona Holloway, S. Ananthanarayan, M. Butler, Madhuka De Silva, K. Ellis, Cagatay Goncu, Kate Stephens, K. Marriott
|
2022
|
View Paper |
The Accessibility of Data Visualizations on the Web for Screen Reader Users: Practices and Experiences During COVID-19
|
Danyang Fan, Alexa Fay Siu, Hrishikesh V. Rao, Gene S.-H. Kim, Xavier Vazquez, Lucy Greco, Sile O'Modhrain, Sean Follmer
|
2022
|
View Paper |
Chart Question Answering: State of the Art and Future Directions
|
Enamul Hoque, P. Kavehzadeh, Ahmed Masry
|
2022
|
View Paper |
Slide-Tone and Tilt-Tone: 1-DOF Haptic Techniques for Conveying Shape Characteristics of Graphs to Blind Users
|
Danyang Fan, A. Siu, W. Law, R. Zhen, Sile O'Modhrain, Sean Follmer
|
2022
|
View Paper |
Infosonics: Accessible Infographics for People who are Blind using Sonification and Voice
|
Leona Holloway, Cagatay Goncu, Alon Ilsar, M. Butler, K. Marriott
|
2022
|
View Paper |
Supporting Accessible Data Visualization Through Audio Data Narratives
|
A. Siu, Gene S-H Kim, Sile O'Modhrain, Sean Follmer
|
2022
|
View Paper |
VoxLens: Making Online Data Visualizations Accessible with an Interactive JavaScript Plug-In
|
Ather Sharif, Olivia H. Wang, Alida T. Muongchan, Katharina Reinecke, J. Wobbrock, Jacob O. obbrock
|
2022
|
View Paper |
Communicating Visualizations without Visuals: Investigation of Visualization Alternative Text for People with Visual Impairments
|
C. Jung, Shubham Mehta, Atharva Kulkarni, Yuhang Zhao, Yea-Seul Kim
|
2021
|
View Paper |
A Survey on Tactile Displays For Visually Impaired People
|
Wenzhen Yang, Jinpeng Huang, Ruirui Wang, Wen Zhang, Haitao Liu, Jianliang Xiao
|
2021
|
View Paper |
Accessible Visualization: Design Space, Opportunities, and Challenges
|
N. Kim, Shakila Cherise S. Joyner, A. Riegelhuth, Yea-Seul Kim
|
2021
|
View Paper |
Development of Blind Football Play-by-play System for Visually Impaired Spectators: Tangible Sports
|
H. Ohshima, M. Kobayashi, S. Shimada
|
2021
|
View Paper |
Inclusive data visualization for people with disabilities
|
K. Marriott, Bongshin Lee, M. Butler, Edward Cutrell, K. Ellis, Cagatay Goncu, Marti A. Hearst, Kathleen F. McCoy, D. Szafir
|
2021
|
View Paper |
Technology Developments in Touch-Based Accessible Graphics: A Systematic Review of Research 2010-2020
|
M. Butler, Leona Holloway, Samuel Reinders, Cagatay Goncu, K. Marriott
|
2021
|
View Paper |
"Hey Model!" Natural User Interactions and Agency in Accessible Interactive 3D Models
|
Samuel Reinders, M. Butler, K. Marriott
|
2020
|
View Paper |
Reaching Broader Audiences With Data Visualization
|
Bongshin Lee, E. Choe, Petra Isenberg, K. Marriott, J. Stasko, T. Rhyne
|
2020
|
View Paper |
A Hierarchical Model for Data-to-Text Generation
|
Clément Rebuffel, L. Soulier, Geoffrey Scoutheeten, P. Gallinari
|
2019
|
View Paper |
Towards Tangible Vision for the Visually Impaired through 2D Multiarray Braille Display
|
Seondae Kim, Yeongil Ryu, Jinsoo Cho, Eun‐Seok Ryu
|
2019
|
View Paper |
Jido: A Conversational Tactile Map for Blind People
|
Luis Cavazos Quero, Jorge David Iranzo Bartolomé, Dongmyeong Lee, Yerin Lee, Sangwon Lee, Jun-Dong Cho
|
2019
|
View Paper |
Reading Between the Guidelines: How Commercial Voice Assistant Guidelines Hinder Accessibility for Blind Users
|
S. Branham, Antony Rishin Mukkath Roy
|
2019
|
View Paper |
A Refreshable Tactile Display Effectively Supports Cognitive Mapping Followed by Orientation and Mobility Tasks: A Comparative Multi-modal Study Involving Blind and Low-vision Participants
|
L. Brayda, Fabrizio Leo, Caterina Baccelliere, Claudia Vigini, E. Cocchi
|
2019
|
View Paper |
Data-to-text Generation with Entity Modeling
|
Ratish Puduppully, Li Dong, Mirella Lapata
|
2019
|
View Paper |
Designing Interactive 3D Printed Models with Teachers of the Visually Impaired
|
Lei Shi, Holly Lawson, Zhuohao Zhang, Shiri Azenkot
|
2019
|
View Paper |
Exploring Art with a Voice Controlled Multimodal Guide for Blind People
|
Jorge David Iranzo Bartolomé, Luis Cavazos Quero, Sunhee Kim, Myung-Yong Um, Jun-Dong Cho
|
2019
|
View Paper |
An Interactive Multimodal Guide to Improve Art Accessibility for Blind People
|
Luis Cavazos Quero, Jorge David Iranzo Bartolomé, Seonggu Lee, En Han, Sunhee Kim, Jun-Dong Cho
|
2018
|
View Paper |
"Siri Talks at You": An Empirical Investigation of Voice-Activated Personal Assistant (VAPA) Usage by Individuals Who Are Blind
|
A. Abdolrahmani, Ravi Kuber, S. Branham
|
2018
|
View Paper |
Prototype Development of a Shape Presentation System Using Linear Actuators
|
T. Motoyoshi, Sota Mizushima, K. Sawai, T. Tamamoto, H. Masuta, K. Koyanagi, T. Oshima
|
2018
|
View Paper |
Exploiting a Graphical Braille Display for Art Masterpieces
|
S. Gyoshev, D. Karastoyanov, N. Stoimenov, V. Cantoni, L. Lombardi, Alessandra Setti
|
2018
|
View Paper |
Updated Tactile Feedback with a Pin Array Matrix Helps Blind People to Reduce Self-Location Errors
|
L. Brayda, Fabrizio Leo, Caterina Baccelliere, E. Ferrari, Claudia Vigini
|
2018
|
View Paper |
Designing Interactions for 3D Printed Models with Blind People
|
Lei Shi, Yuhang Zhao, Shiri Azenkot
|
2017
|
View Paper |
Understanding the graphical challenges faced by vision-impaired students in Australian universities
|
M. Butler, Leona Holloway, K. Marriott, Cagatay Goncu
|
2017
|
View Paper |
A method for automatically translating print books into electronic Braille books
|
Taekeun Park, Jungil Jung, Jinsoo Cho
|
2016
|
View Paper |
The Tactile Graphics Helper: Providing Audio Clarification for Tactile Graphics Using Machine Vision
|
Giovanni Fusco, V. Morash
|
2015
|
View Paper |
Interactive Audio-haptic Map Explorer on a Tactile Display
|
Limin Zeng, Mei Miao, G. Weber
|
2015
|
View Paper |
An interactive and intuitive stem accessibility system for the blind and visually impaired
|
Rahul Kumar Namdev, P. Maes
|
2015
|
View Paper |
Designing Media for Visually-Impaired Users of Refreshable Touch Displays: Possibilities and Pitfalls
|
Sile O'Modhrain, N. Giudice, John A. Gardner, G. Legge
|
2015
|
View Paper |
CHI Conference on Human Factors in Computing Systems
|
Hannah Limerick
|
2015
|
View Paper |
Visualization Analysis and Design
|
T. Munzner
|
2014
|
View Paper |
Pre-journey Visualization of Travel Routes for the Blind on Refreshable Interactive Tactile Displays
|
M. Ivanchev, Francis Zinke, U. Lucke
|
2014
|
View Paper |
A Wizard-of-Oz elicitation study examining child-defined gestures with a whole-body interface
|
Sabrina Connell, P. Kuo, L. Liu, Anne Marie Piper
|
2013
|
View Paper |
Understanding Pen and Touch Interaction for Data Exploration on Interactive Whiteboards
|
Jagoda Walny, Bongshin Lee, Paul Johns, N. Riche, Sheelagh Carpendale
|
2012
|
View Paper |
Exploration and avoidance of surrounding obstacles for the visually impaired
|
Limin Zeng, Denise Prescher, G. Weber
|
2012
|
View Paper |
GraVVITAS: Generic Multi-touch Presentation of Accessible Graphics
|
Cagatay Goncu, K. Marriott
|
2011
|
View Paper |
User-defined gestures for surface computing
|
J. Wobbrock, M. Morris, Andrew D. Wilson
|
2009
|
View Paper |
Design patterns for sociality in human-robot interaction
|
P. Kahn, Nathan G. Freier, T. Kanda, H. Ishiguro, Jolina H. Ruckert, Rachel L. Severson, Shaun K. Kane
|
2008
|
View Paper |
Graphical Tactile Displays for Visually-Impaired People
|
F. Vidal-Verdú, M. Hafez
|
2007
|
View Paper |
Talking TMAP: Automated generation of audio-tactile maps using Smith-Kettlewell's TMAP software
|
Joshua A. Miele, Steven Landau, D. Gilden
|
2006
|
View Paper |
Choosing the content of textual summaries of large time-series data sets
|
Jin Yu, Ehud Reiter, J. Hunter, Chris Mellish
|
2006
|
View Paper |
The world of touch: an international survey of tactile maps. Part 1: production
|
J. Rowell, Simon Ungar
|
2003
|
View Paper |
Applying the Wizard of Oz Technique to the Study of Multimodal Systems
|
D. Salber, J. Coutaz
|
1993
|
View Paper |
Wizard of Oz studies: why and how
|
Nils Dahlbäck, Arne Jönsson, Lars Ahrenberg
|
1993
|
View Paper |
Diffusion of Innovations
|
E. Rogers
|
1964
|
View Paper |
Automatic Chart Understanding: A Review
|
Ali Mazraeh Farahani, Peyman Adibi, M. Ehsani, H. Hutter, Alireza Darvishy
|
2023
|
View Paper |
Computers & Accessibility , ASSETS ’18
|
2018
|
||
Orbit research - graphiti - a breakthrough in non-visual access to all forms of graphical information
|
2016
|
||
Dual axes time series plots may be ok sometimes after all
|
2016
|
||
Interactively Displaying Maps on a Tactile Graphics Display
|
Bernhard Schmitz, T. Ertl
|
2012
|
View Paper |
metec
|
2012
|
||
Guidelines and Standards for Tactile Graphics
|
2010
|
||
Guidelines for multimodal user interface design
|
L. Reeves, J. Lai, J. Larson, S. Oviatt, T. Balaji, S. Buisine, P. Collings, Philip R. Cohen, Ben Kraal, Jean-Claude Martin, M. McTear, T. V. Raman, K. Stanney, Hui Su, Qian Ying Wang
|
2004
|
View Paper |
Sonification Report: Status of the Field and Research Agenda
|
G. Kramer, Bruce Walker, Terri L. Bonebright, P. Cook, J. H. Flowers, N. Miner, John G. Neuhoff, R. Bargar, S. Barrass, J. Berger, G. Evreinov, W. Fitch, Matti T. Gröhn, Steve Handel, H. Kaper, H. Levkowitz, S. Lodha, B. Shinn-Cunningham, M. Simoni, Sever Tipei
|
2004
|
View Paper |
An iterative design methodology for user-friendly natural language office information applications
|
J., F. Kelley, T. J. Watson
|
1984
|
View Paper |
A Simple Sequentially Rejective Multiple Test Procedure
|
S. Holm
|
1979
|
View Paper |
dot pad - the frst tactile graphics display for the visually impaired
|
|||
for the blind - meet monarch
|
|||
Spotlighting breakthroughs in multi-line braille displays
|
|||
SAS graphics accelerator customer product page
|
Showing first page preview. Click "Open Full PDF" to view the complete paper.
Your comment contains inappropriate language and has been rejected.
Are you sure you want to remove this tag? This action cannot be undone.
Someone just favorited a paper!
Comments (0)