Academic Profile
Statistics
Similar Authors
Papers on arXiv
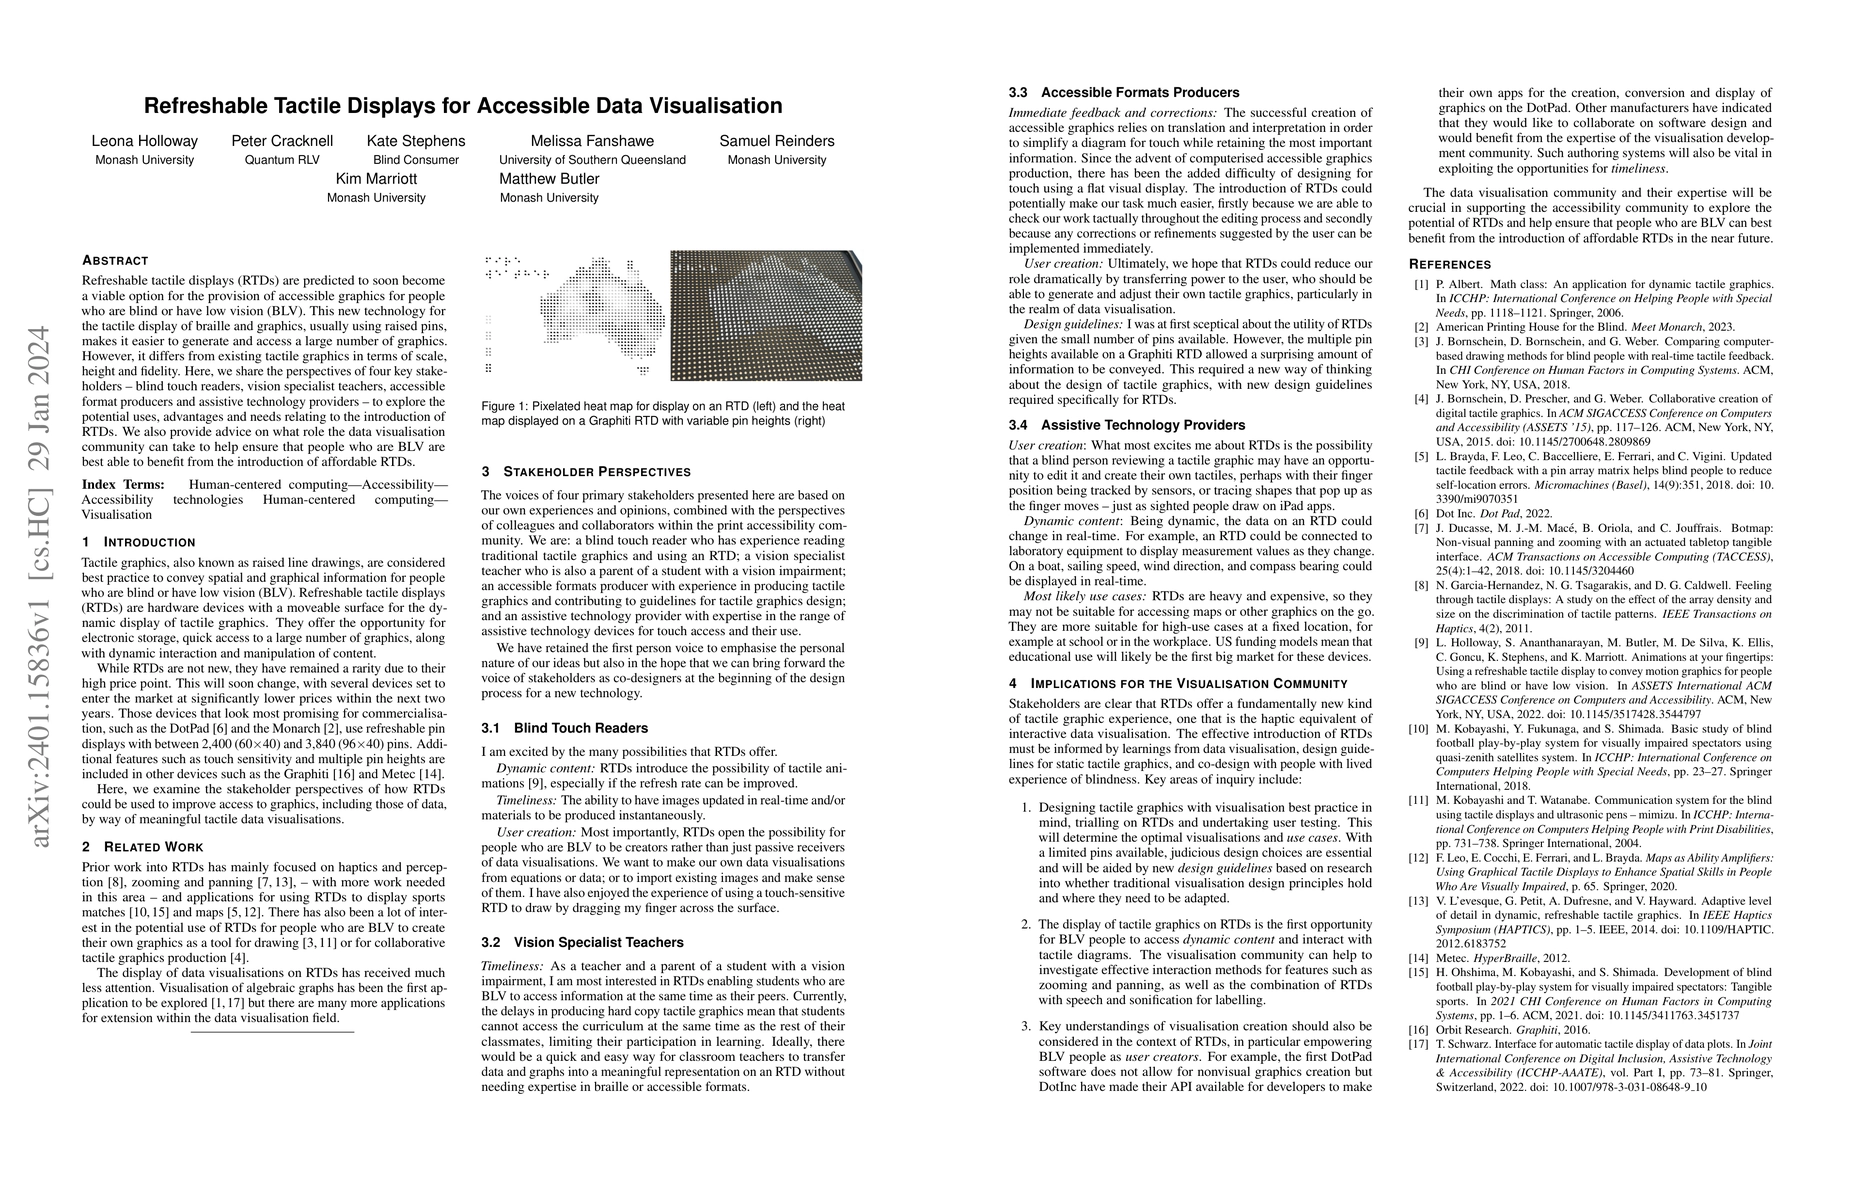
Refreshable tactile displays (RTDs) are predicted to soon become a viable option for the provision of accessible graphics for people who are blind or have low vision (BLV). This new technology for t...
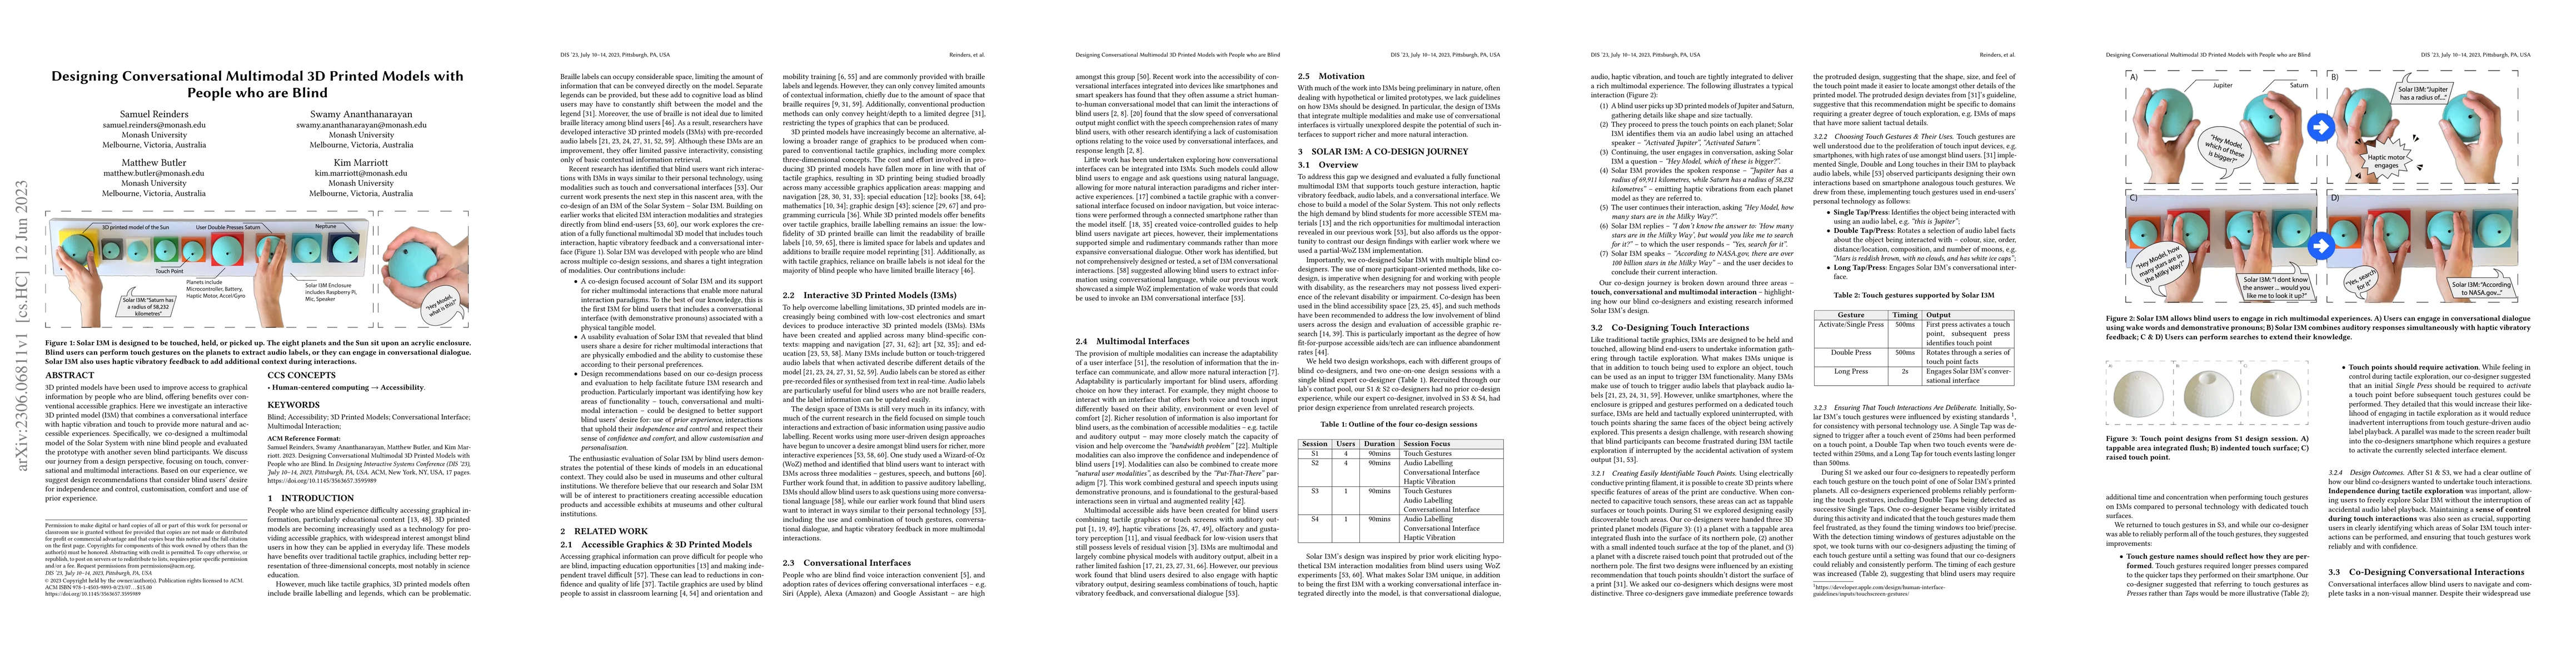
3D printed models have been used to improve access to graphical information by people who are blind, offering benefits over conventional accessible graphics. Here we investigate an interactive 3D pr...
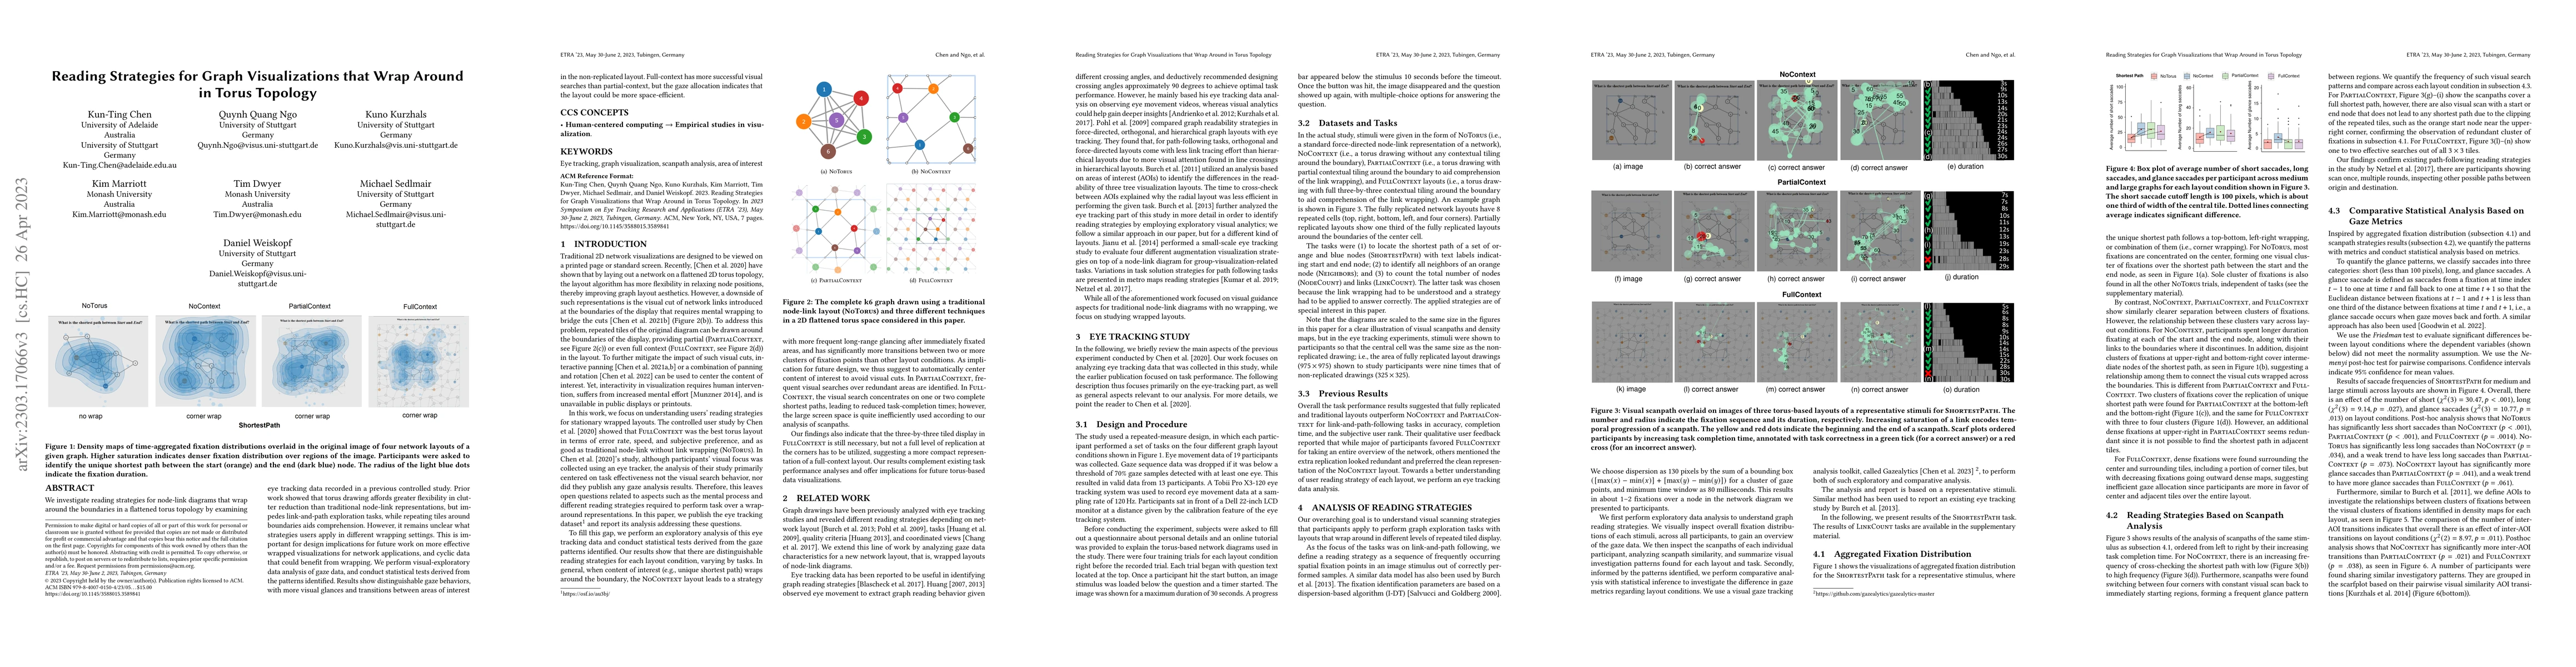
We investigate reading strategies for node-link diagrams that wrap around the boundaries in a flattened torus topology by examining eye tracking data recorded in a previous controlled study. Prior w...
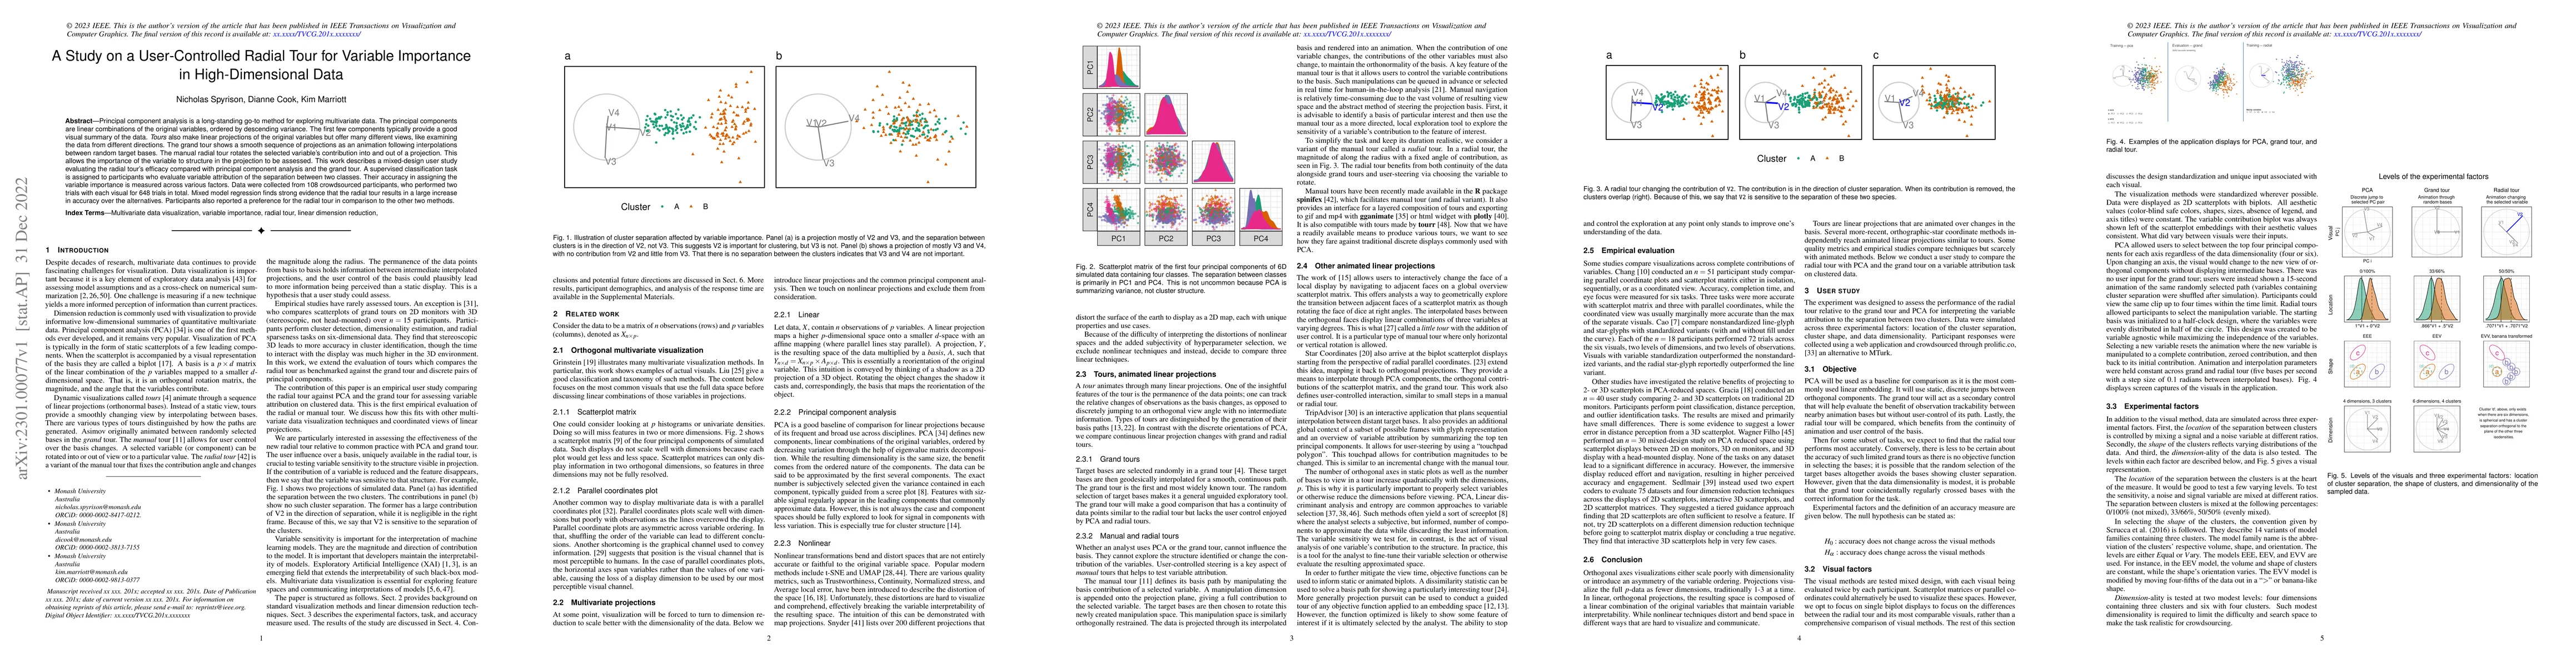
Principal component analysis is a long-standing go-to method for exploring multivariate data. The principal components are linear combinations of the original variables, ordered by descending varian...
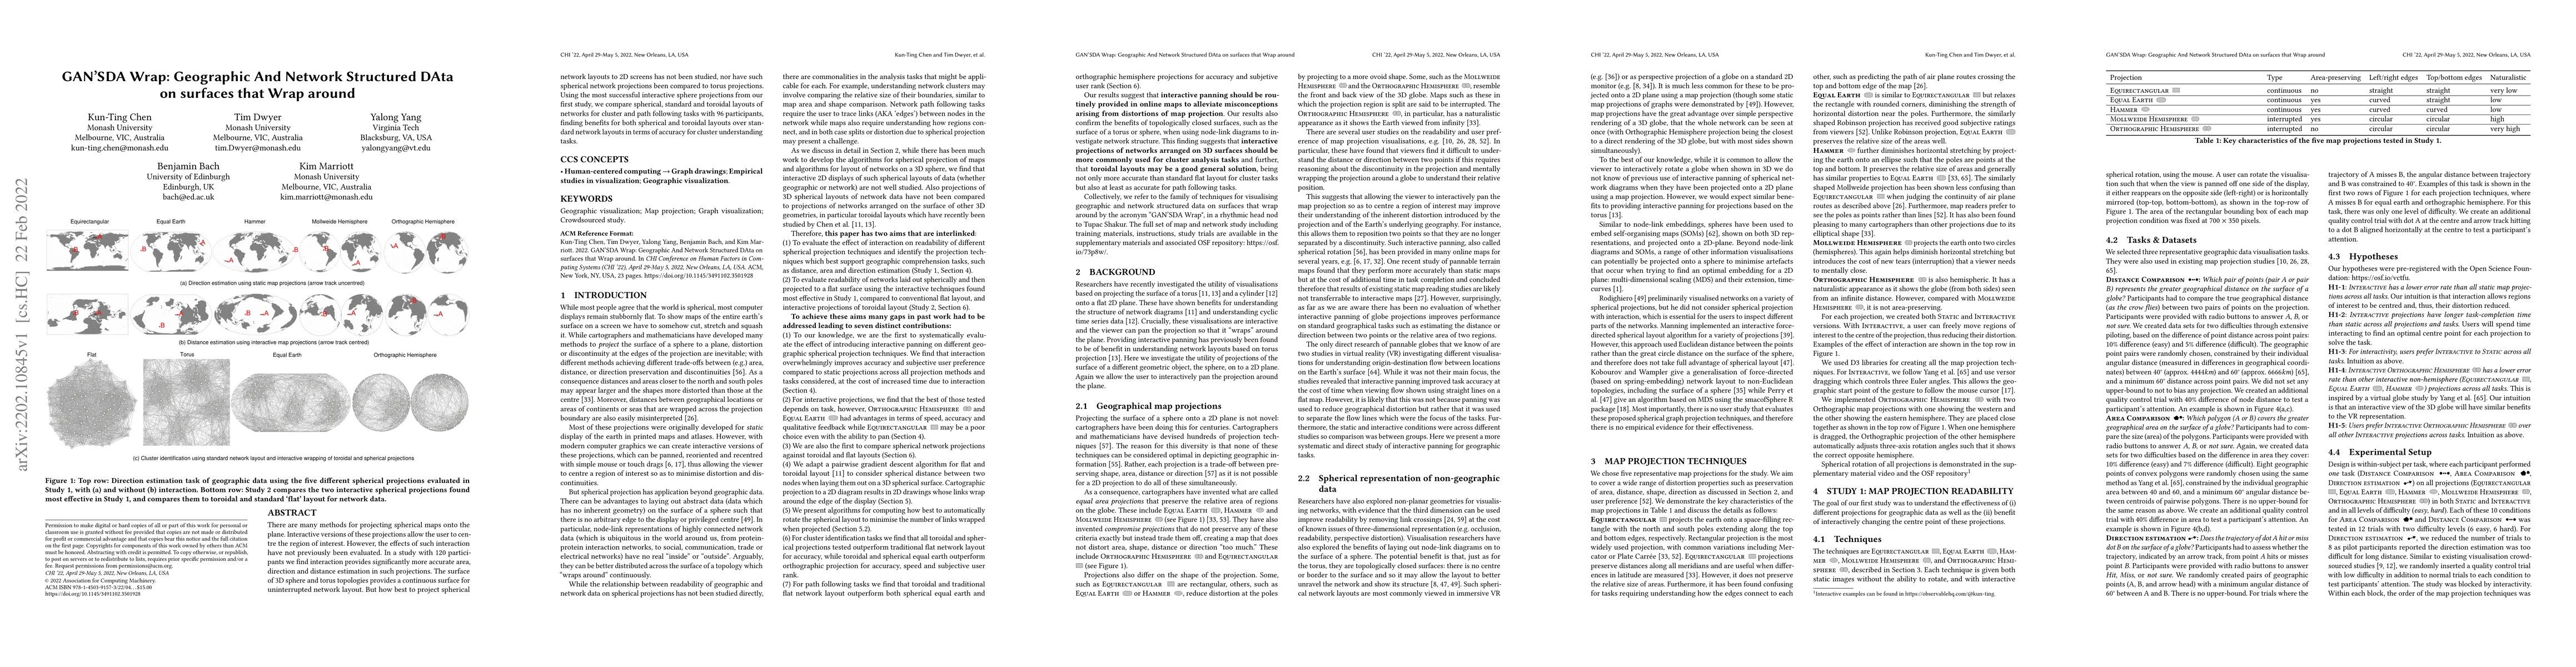
There are many methods for projecting spherical maps onto the plane. Interactive versions of these projections allow the user to centre the region of interest. However, the effects of such interacti...
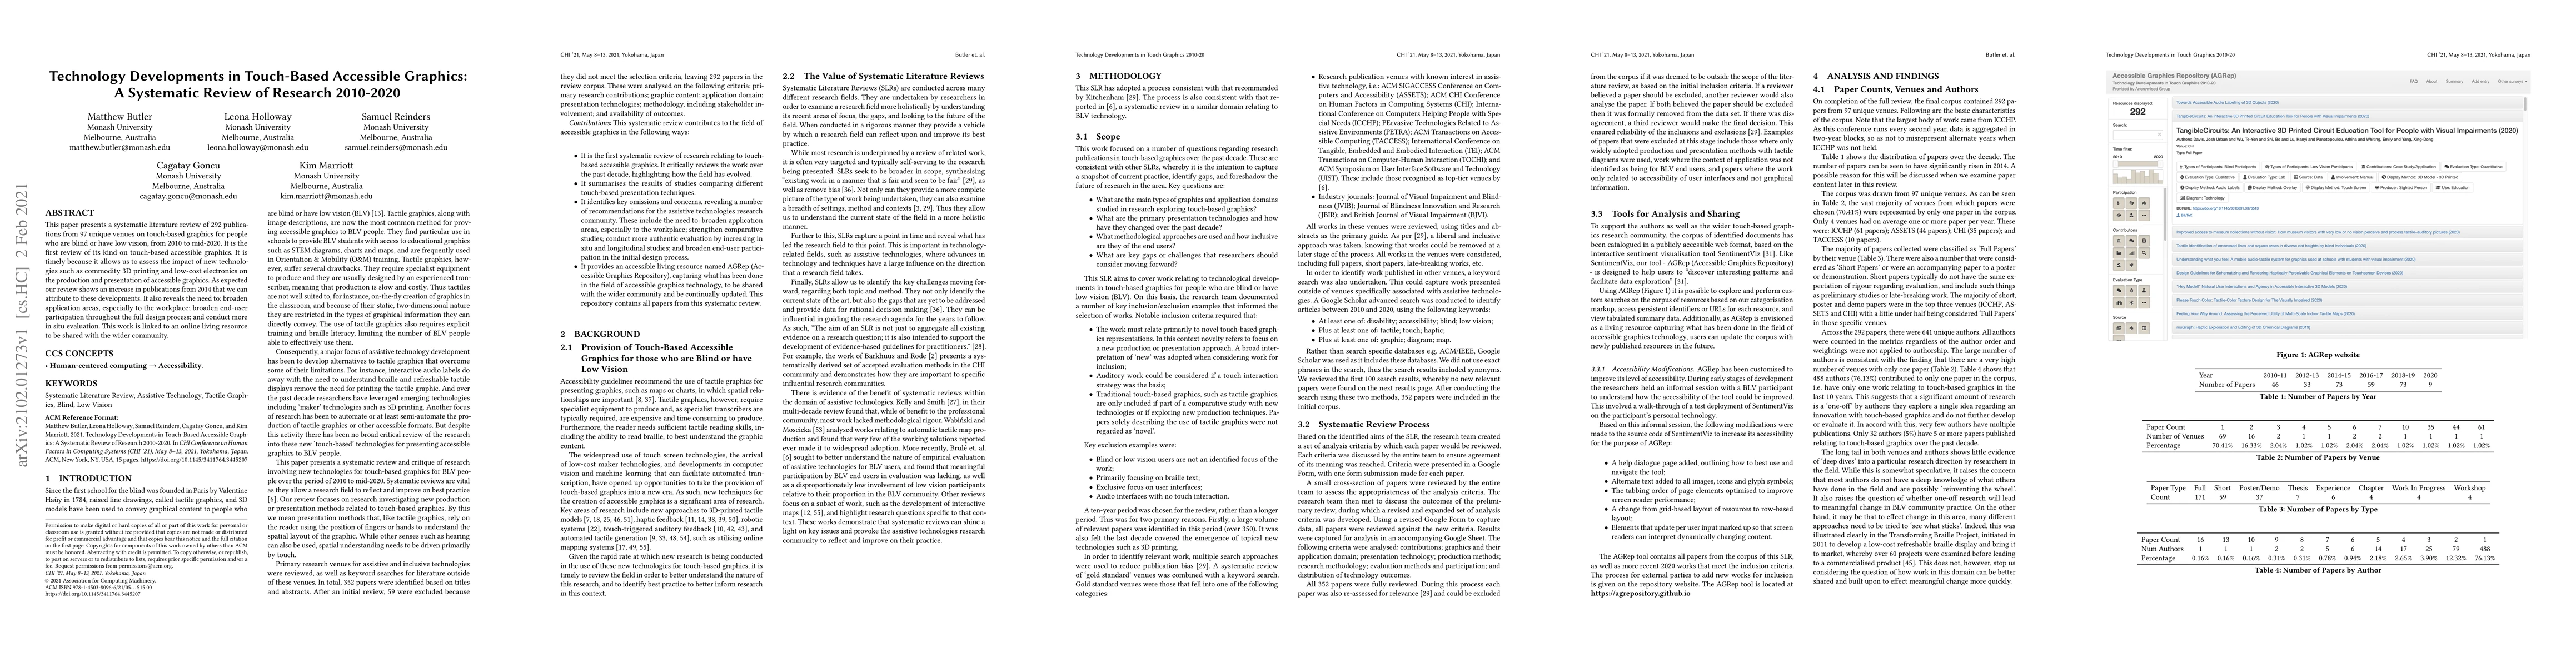
This paper presents a systematic literature review of 292 publications from 97 unique venues on touch-based graphics for people who are blind or have low vision, from 2010 to mid-2020. It is the fir...
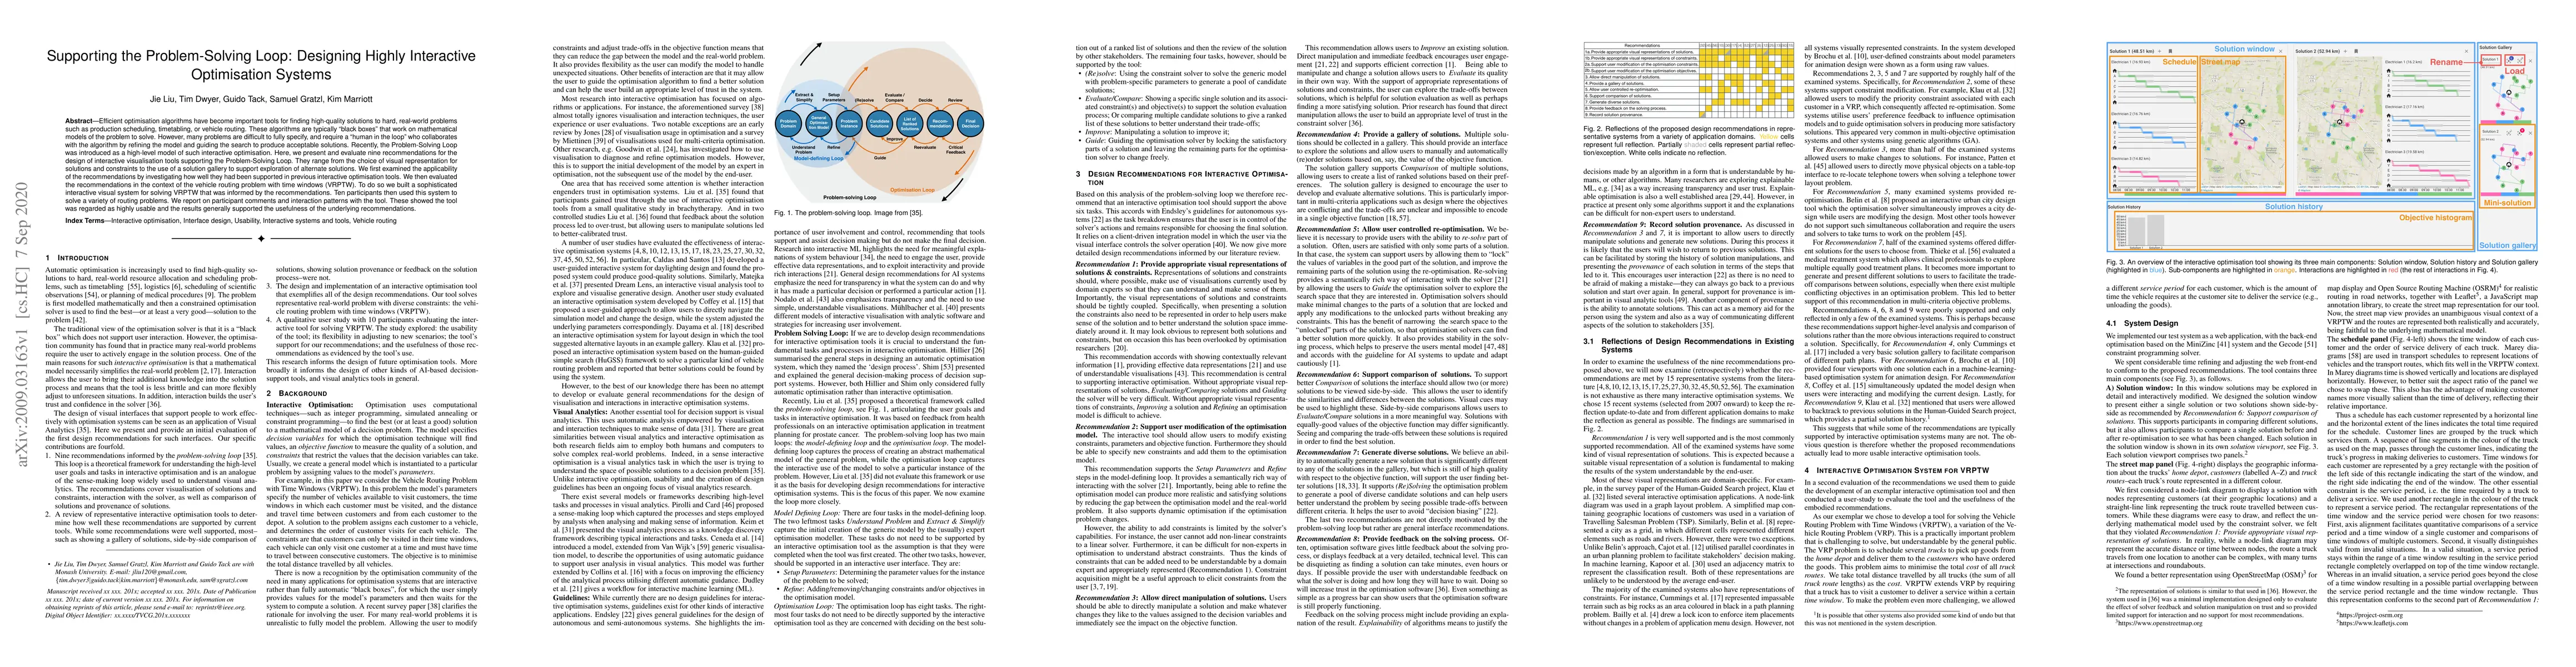
Efficient optimisation algorithms have become important tools for finding high-quality solutions to hard, real-world problems such as production scheduling, timetabling, or vehicle routing. These al...
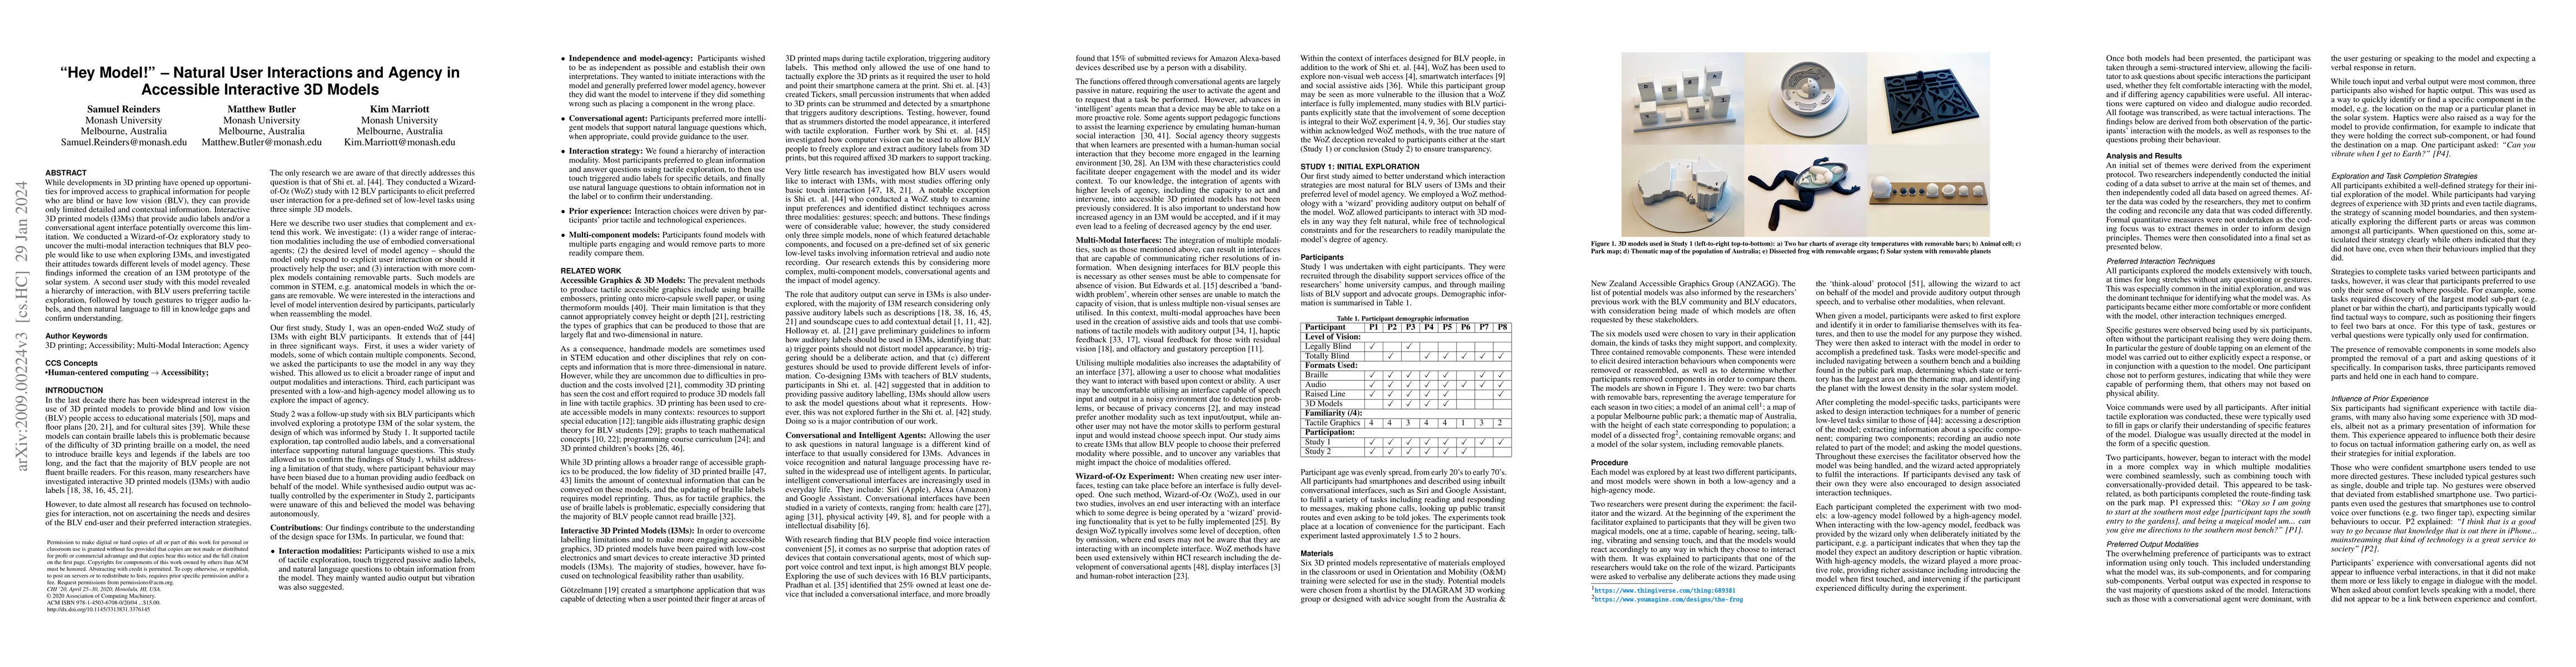
While developments in 3D printing have opened up opportunities for improved access to graphical information for people who are blind or have low vision (BLV), they can provide only limited detailed ...
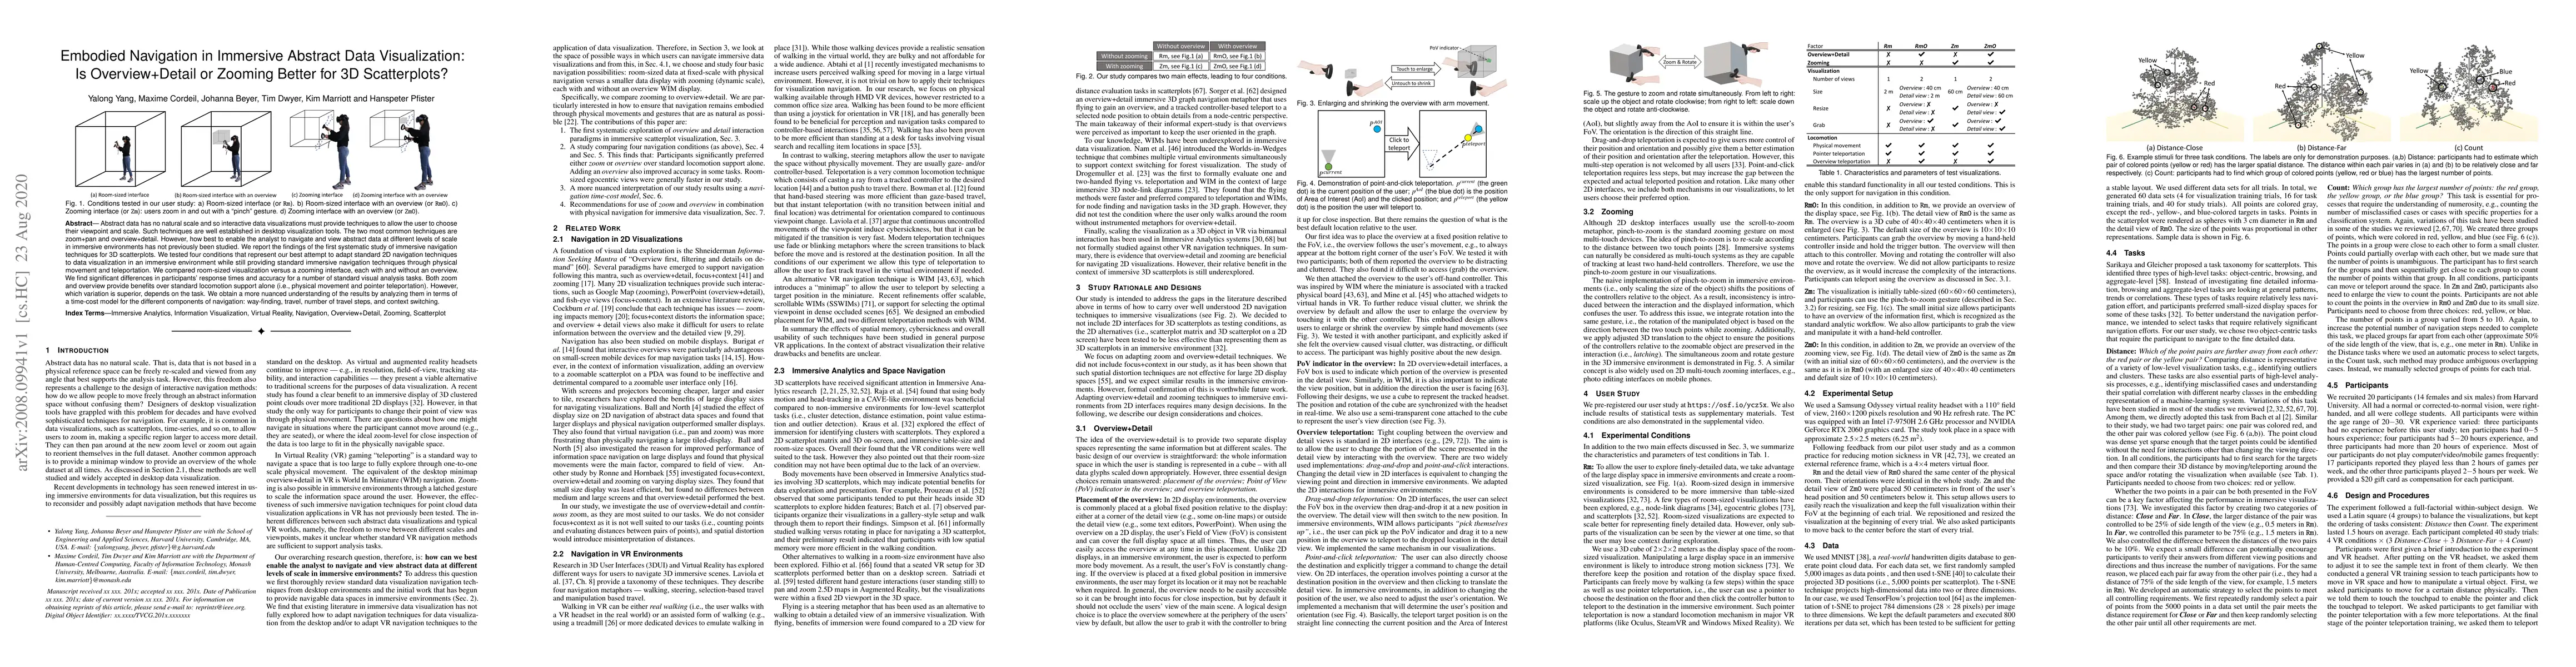
Abstract data has no natural scale and so interactive data visualizations must provide techniques to allow the user to choose their viewpoint and scale. Such techniques are well established in deskt...
Node-link diagrams are widely used to visualise networks. However, even the best network layout algorithms ultimately result in 'hairball' visualisations when the graph reaches a certain degree of c...
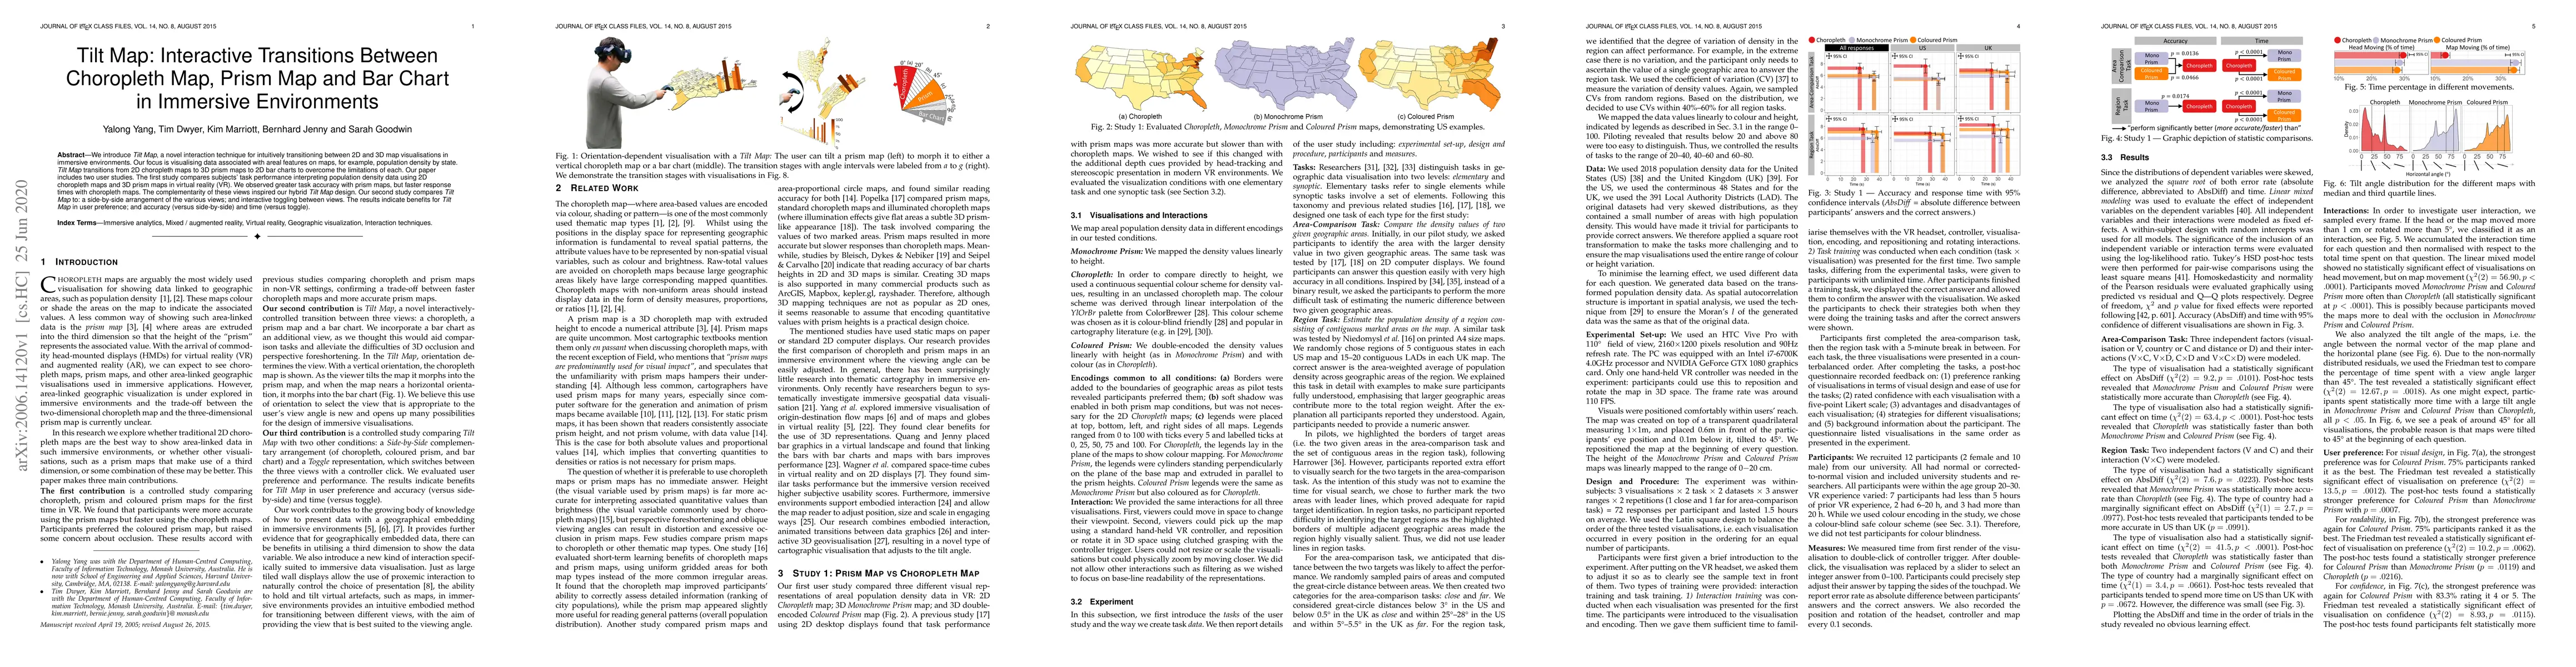
We introduce Tilt Map, a novel interaction technique for intuitively transitioning between 2D and 3D map visualisations in immersive environments. Our focus is visualising data associated with areal...
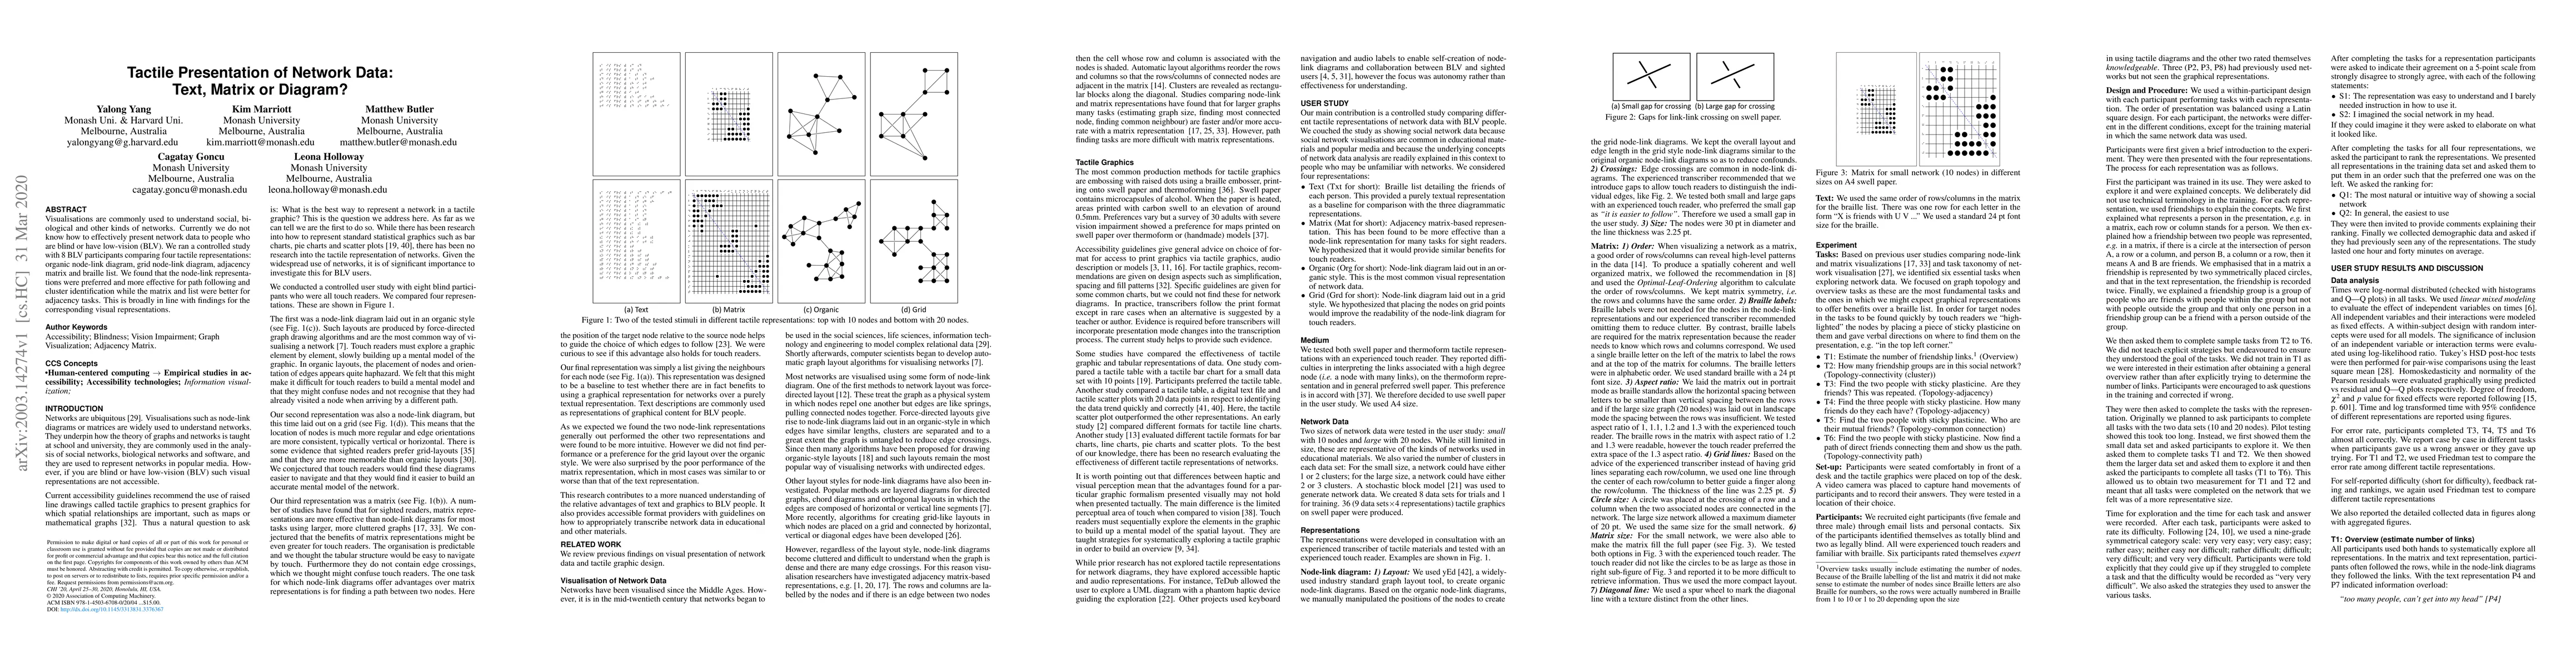
Visualisations are commonly used to understand social, biological and other kinds of networks. Currently, we do not know how to effectively present network data to people who are blind or have low-v...
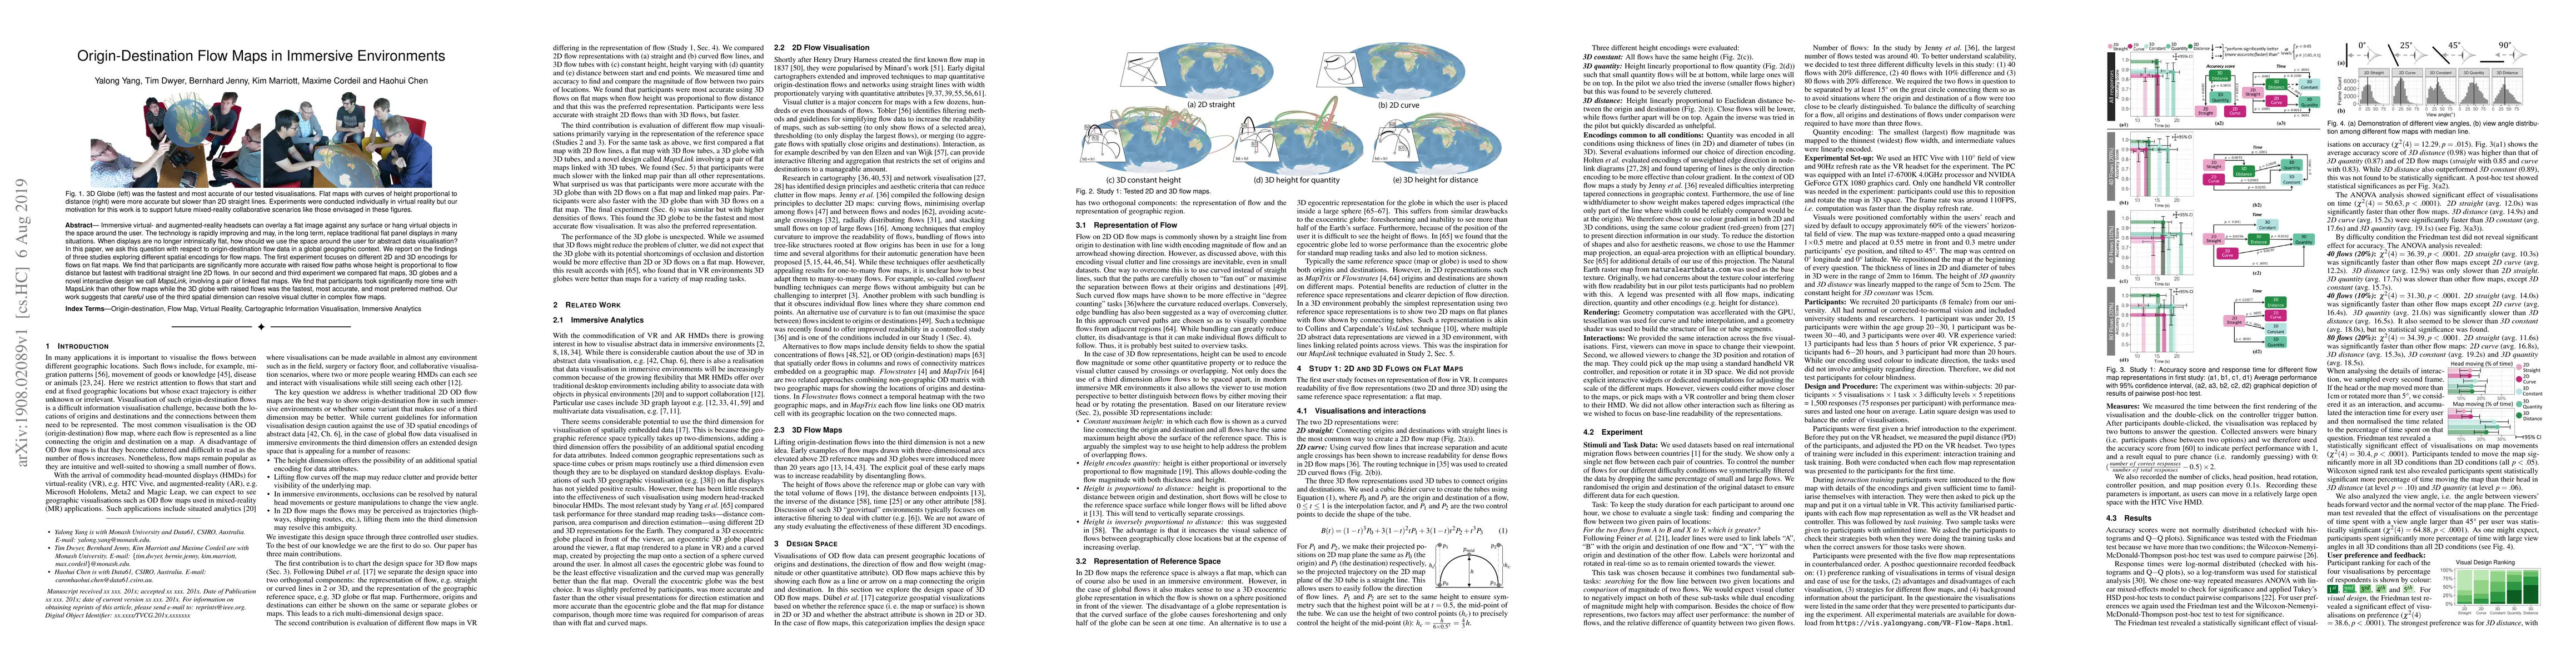
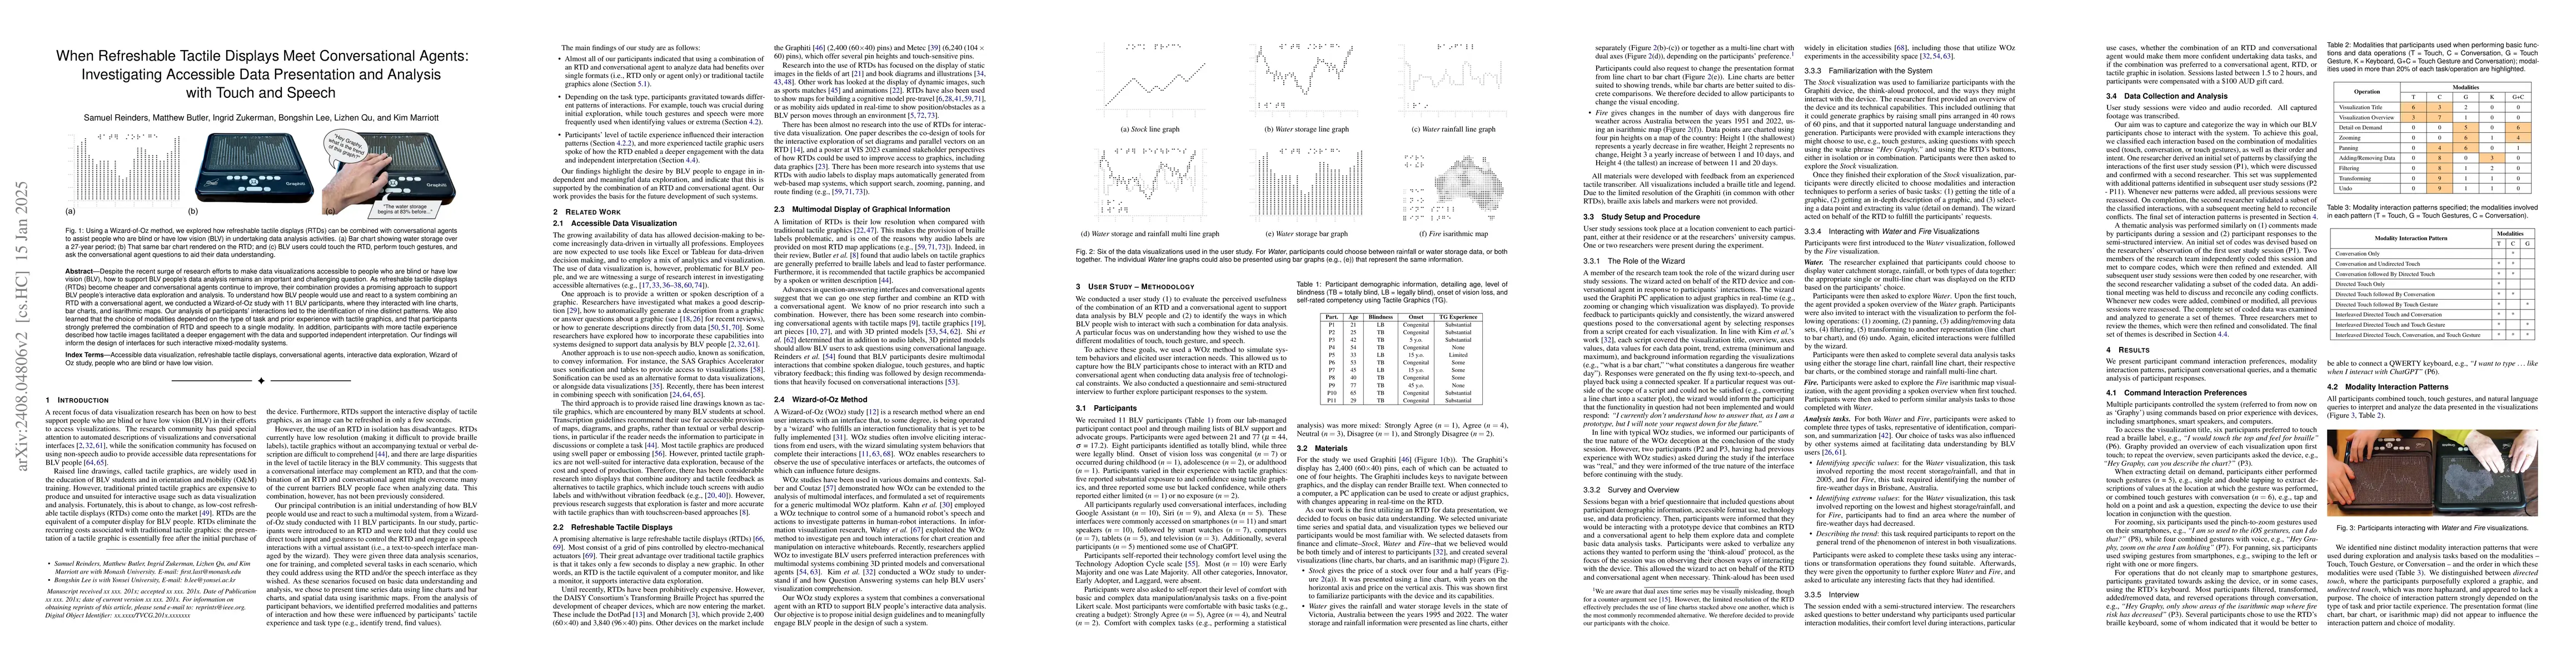
Immersive virtual- and augmented-reality headsets can overlay a flat image against any surface or hang virtual objects in the space around the user. The technology is rapidly improving and may, in t...
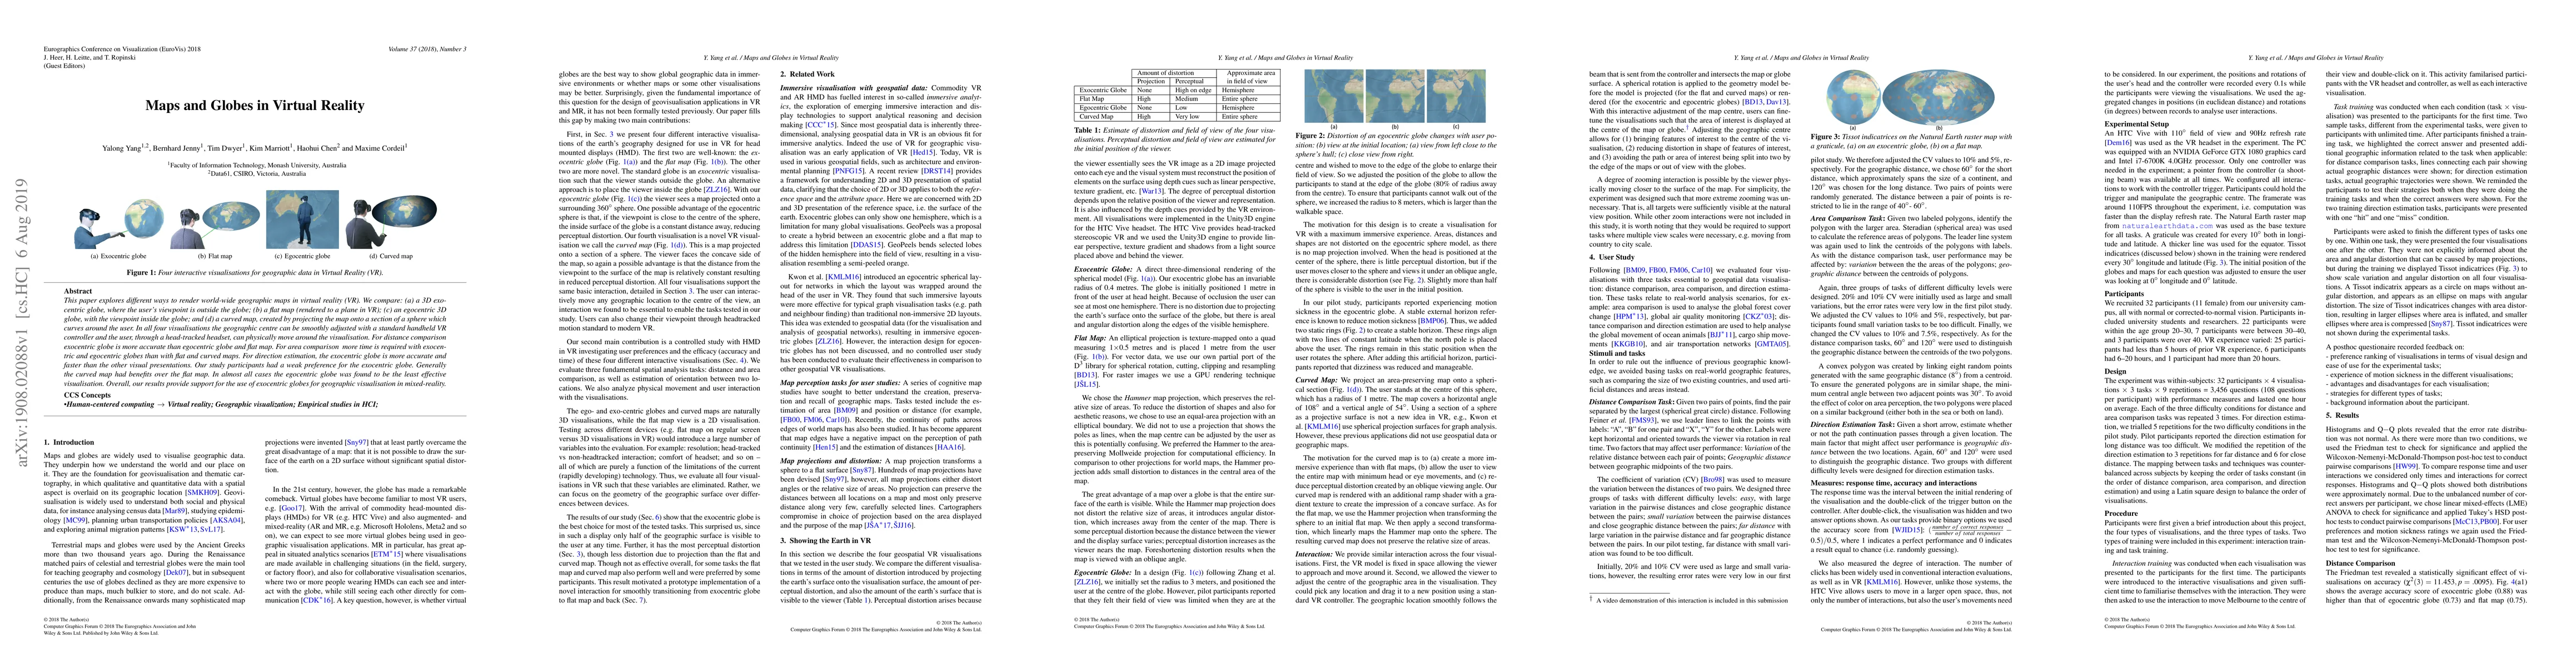
This paper explores different ways to render world-wide geographic maps in virtual reality (VR). We compare: (a) a 3D exocentric globe, where the user's viewpoint is outside the globe; (b) a flat ma...
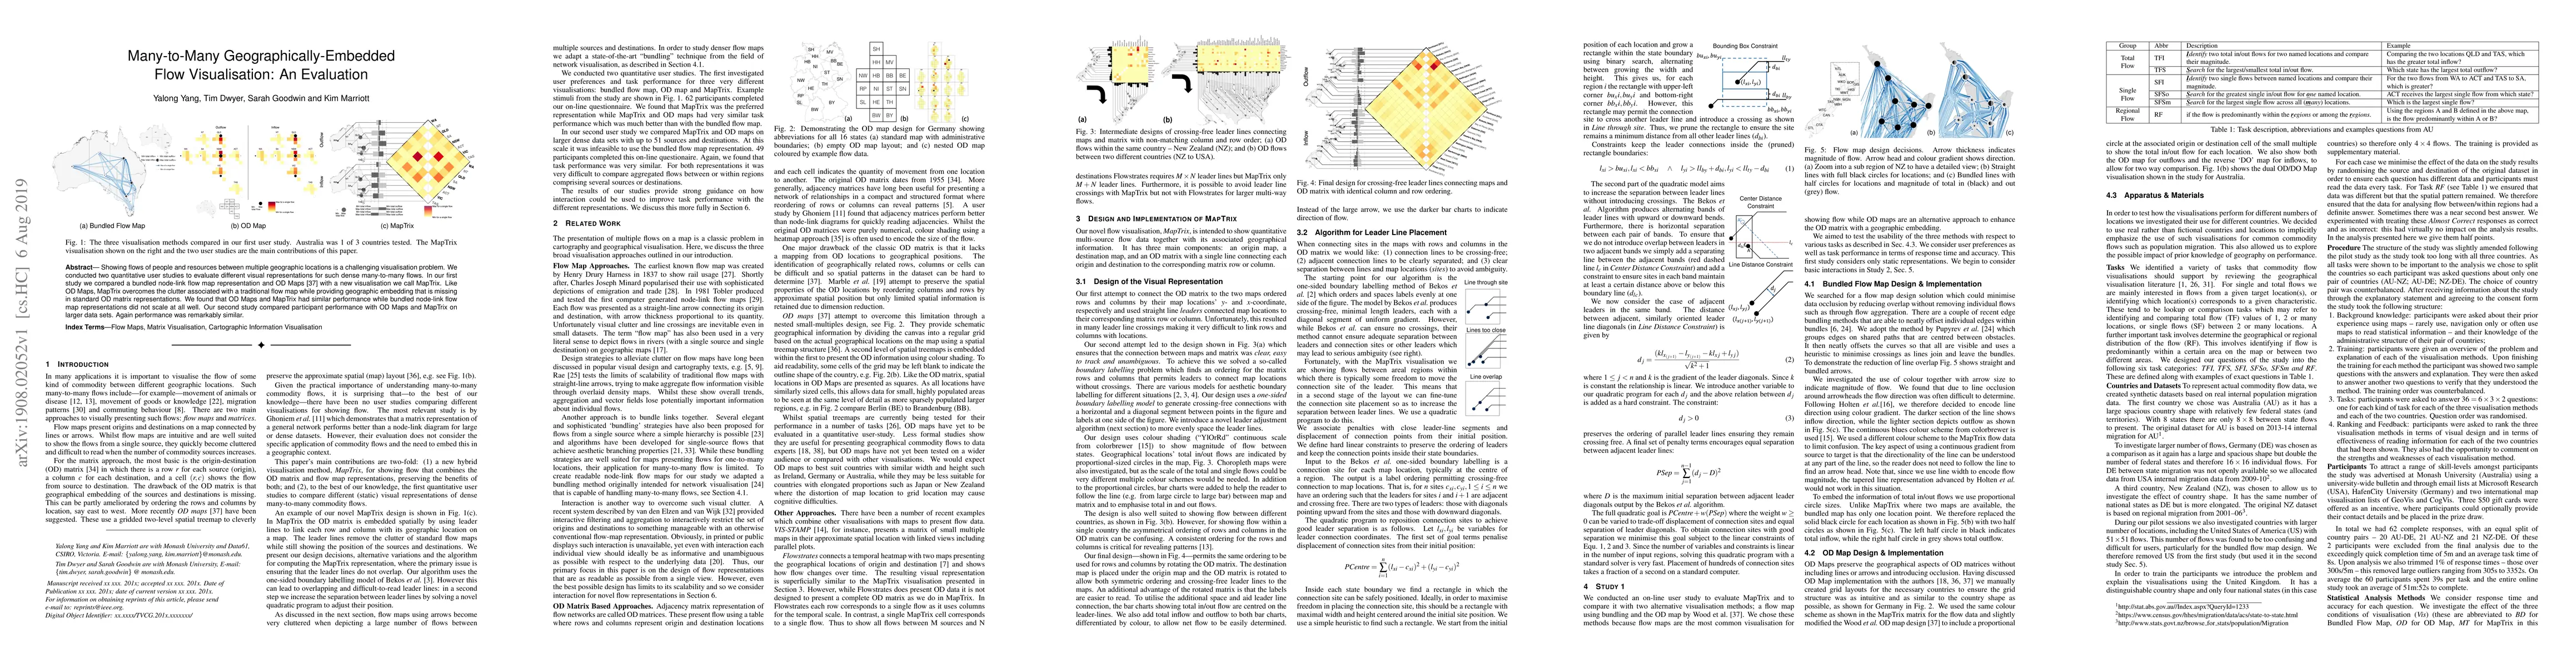
Showing flows of people and resources between multiple geographic locations is a challenging visualisation problem. We conducted two quantitative user studies to evaluate different visual representa...
Despite the recent surge of research efforts to make data visualizations accessible to people who are blind or have low vision (BLV), how to support BLV people's data analysis remains an important and...
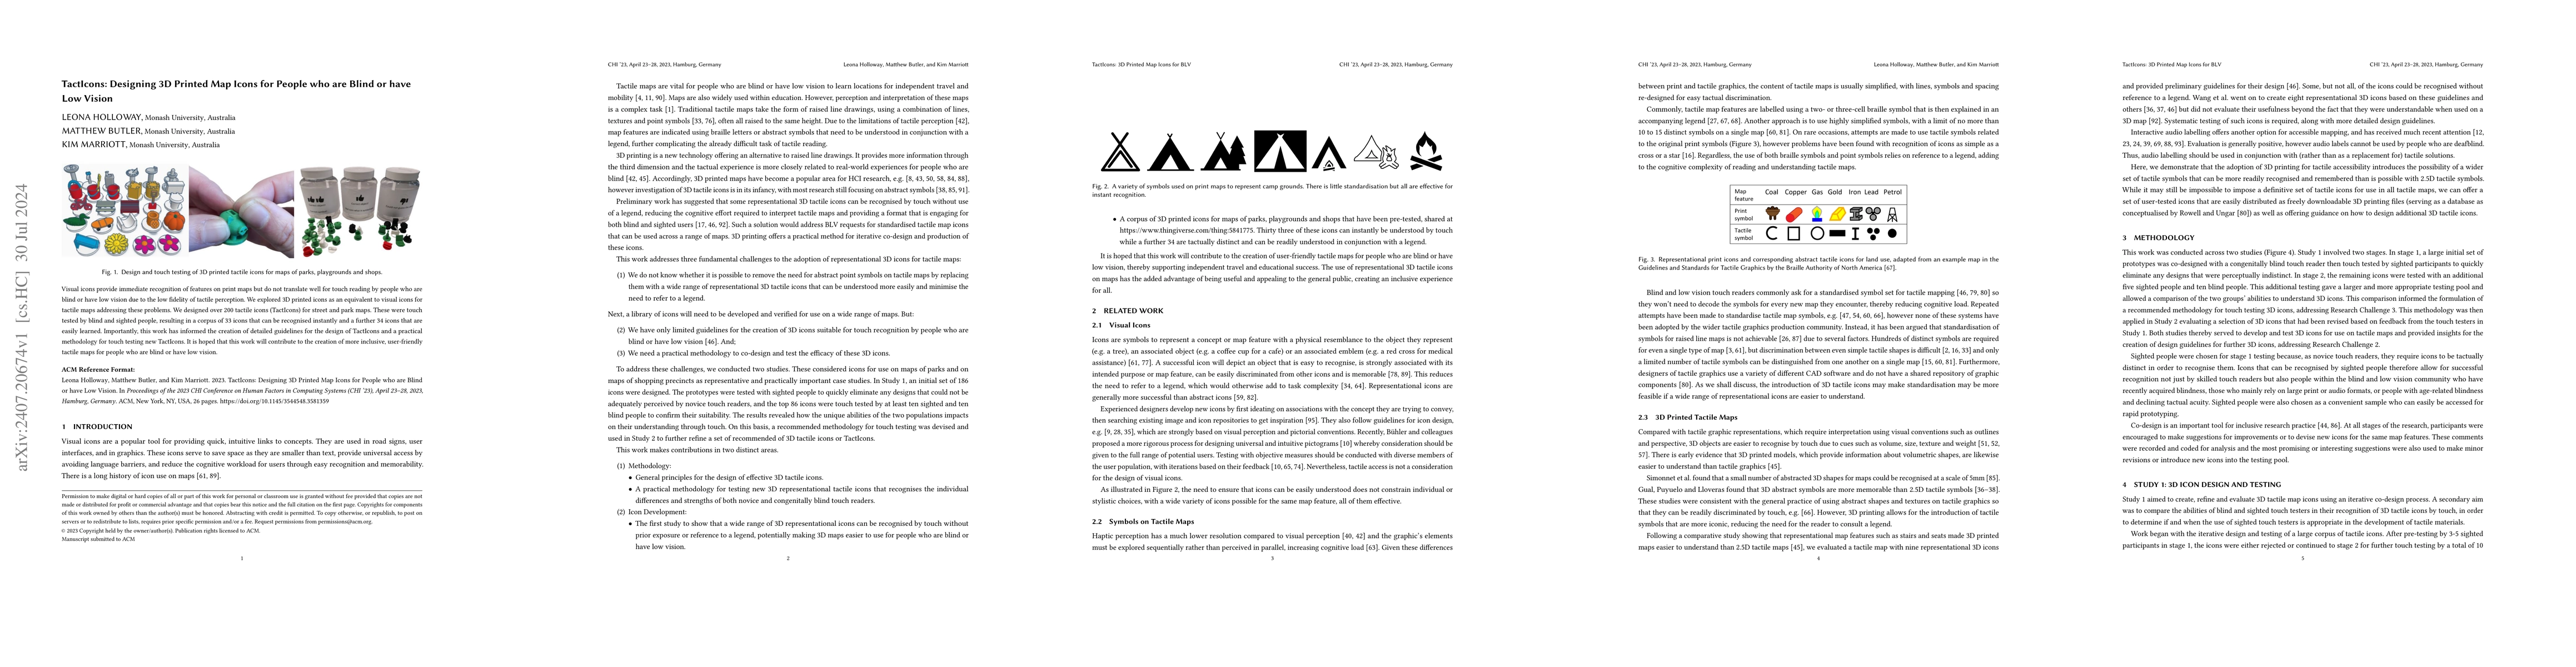
Visual icons provide immediate recognition of features on print maps but do not translate well for touch reading by people who are blind or have low vision due to the low fidelity of tactile perceptio...
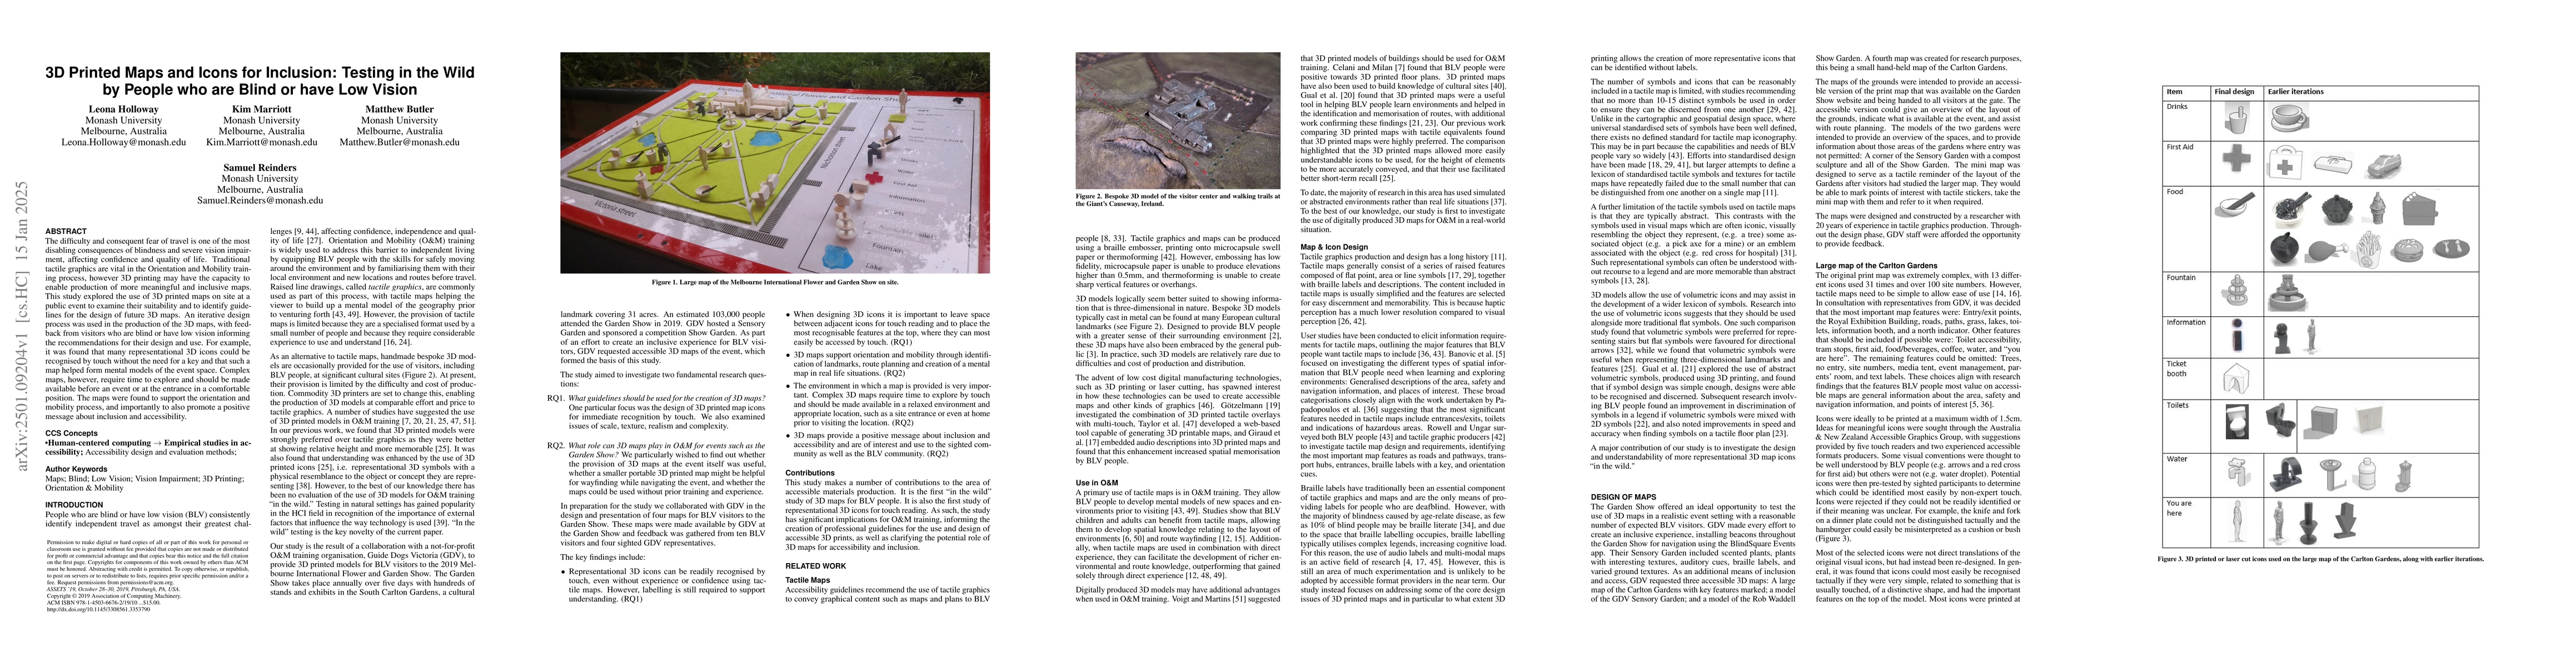
The difficulty and consequent fear of travel is one of the most disabling consequences of blindness and severe vision impairment, affecting confidence and quality of life. Traditional tactile graphics...
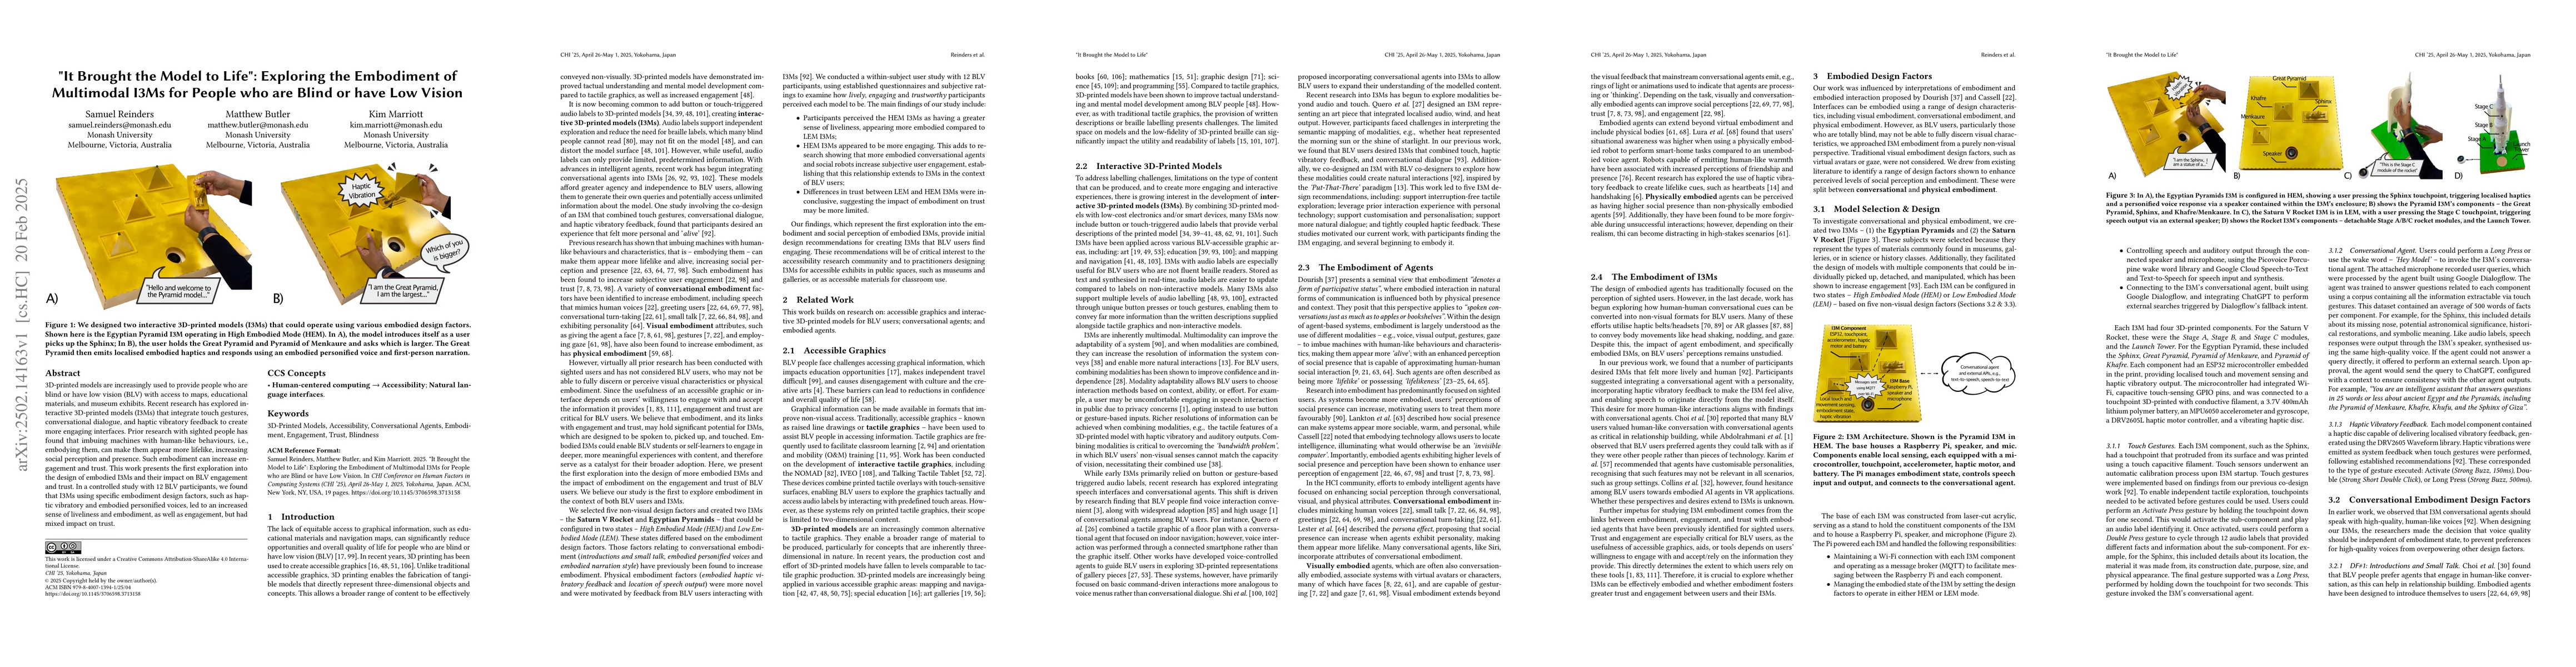
3D-printed models are increasingly used to provide people who are blind or have low vision (BLV) with access to maps, educational materials, and museum exhibits. Recent research has explored interacti...
Over the past decade, considerable research has investigated Vision-Based Assistive Technologies (VBAT) to support people with vision impairments to understand and interact with their immediate enviro...
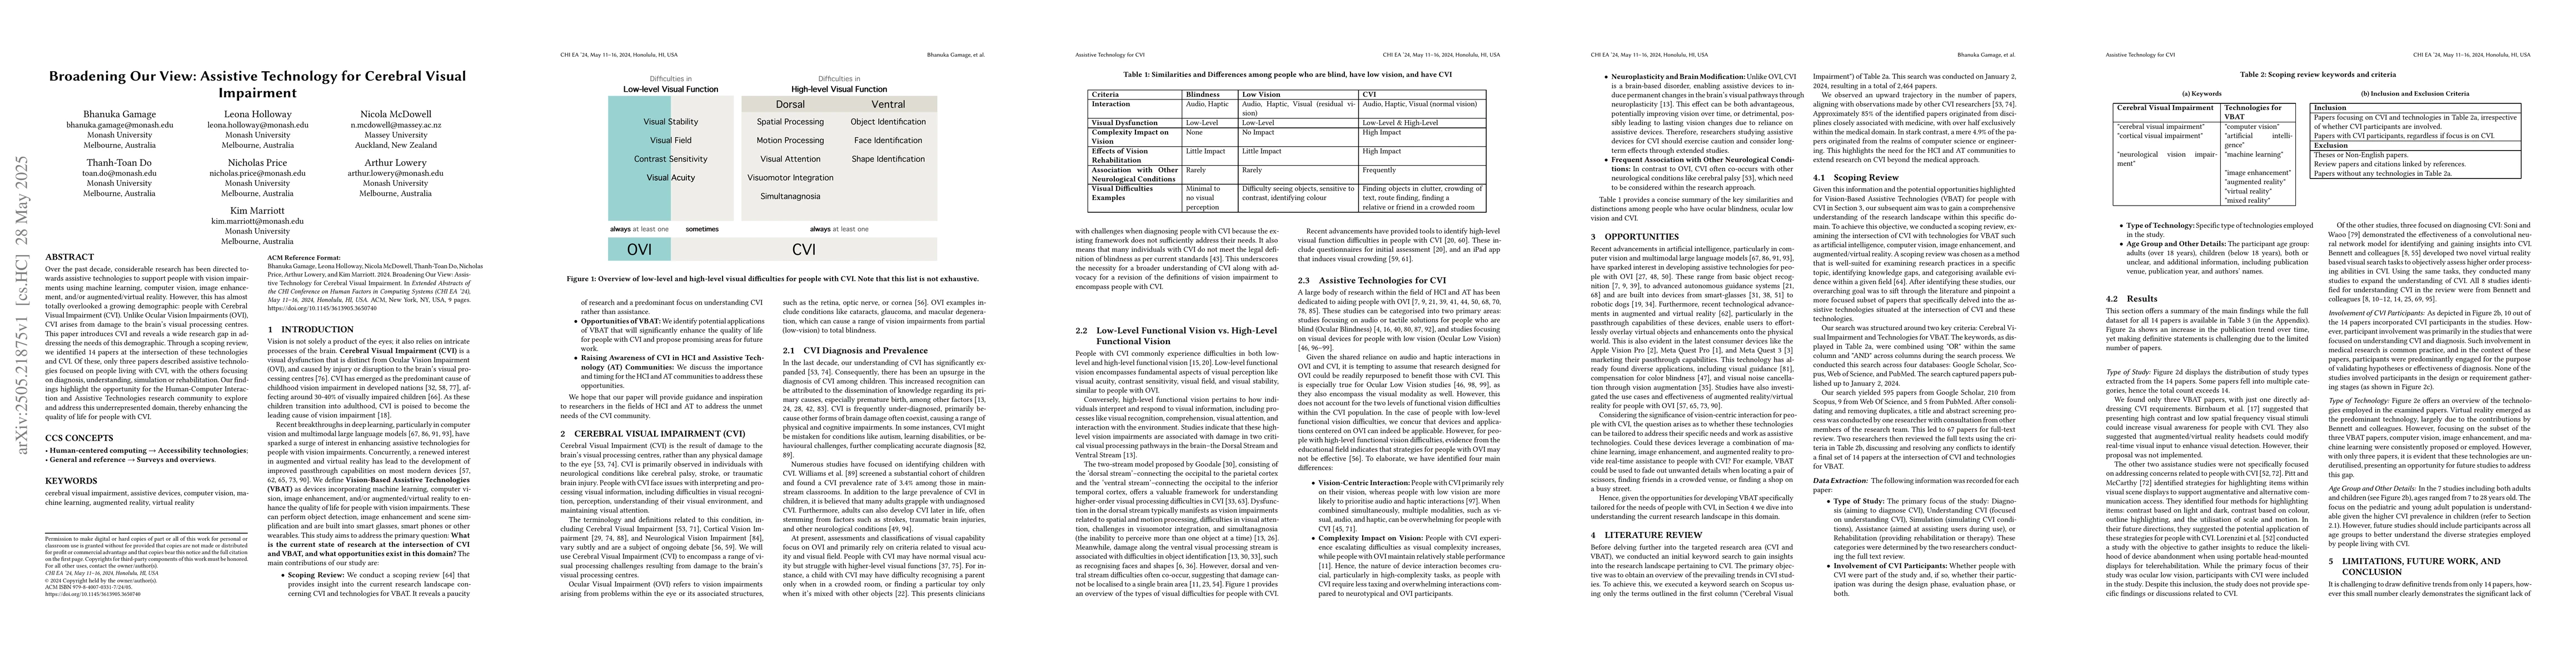
Over the past decade, considerable research has been directed towards assistive technologies to support people with vision impairments using machine learning, computer vision, image enhancement, and/o...
Over the last decade there has been considerable research into how artificial intelligence (AI), specifically computer vision, can assist people who are blind or have low-vision (BLV) to understand th...
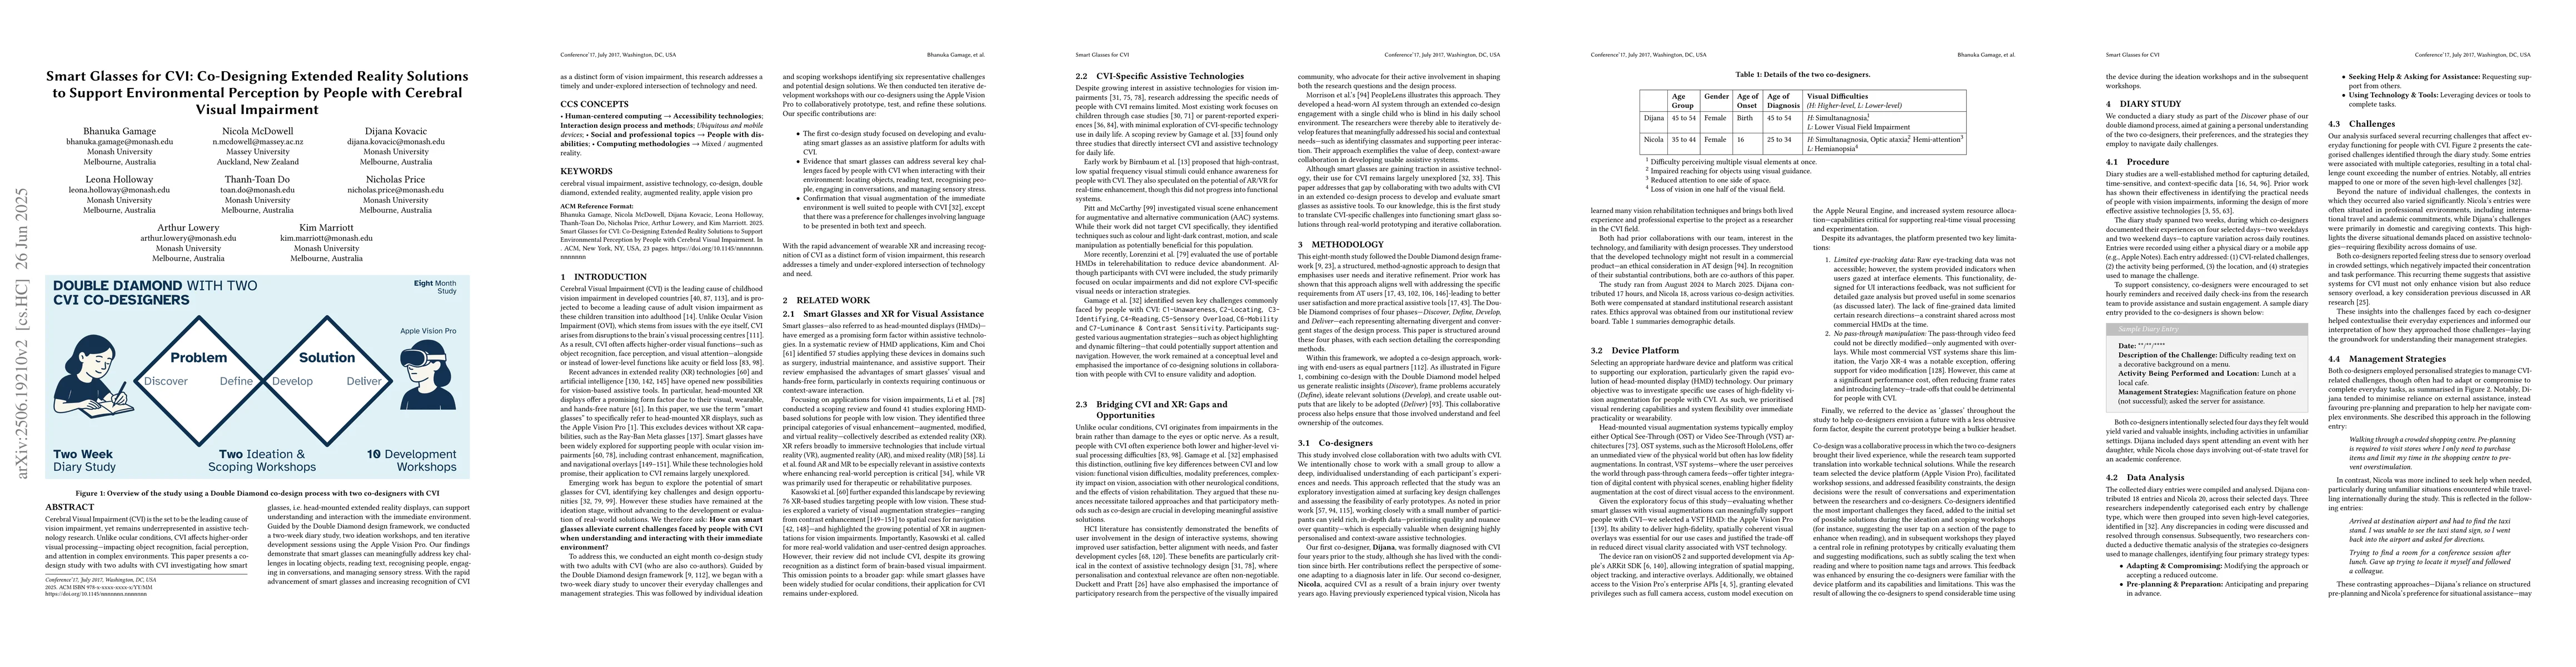
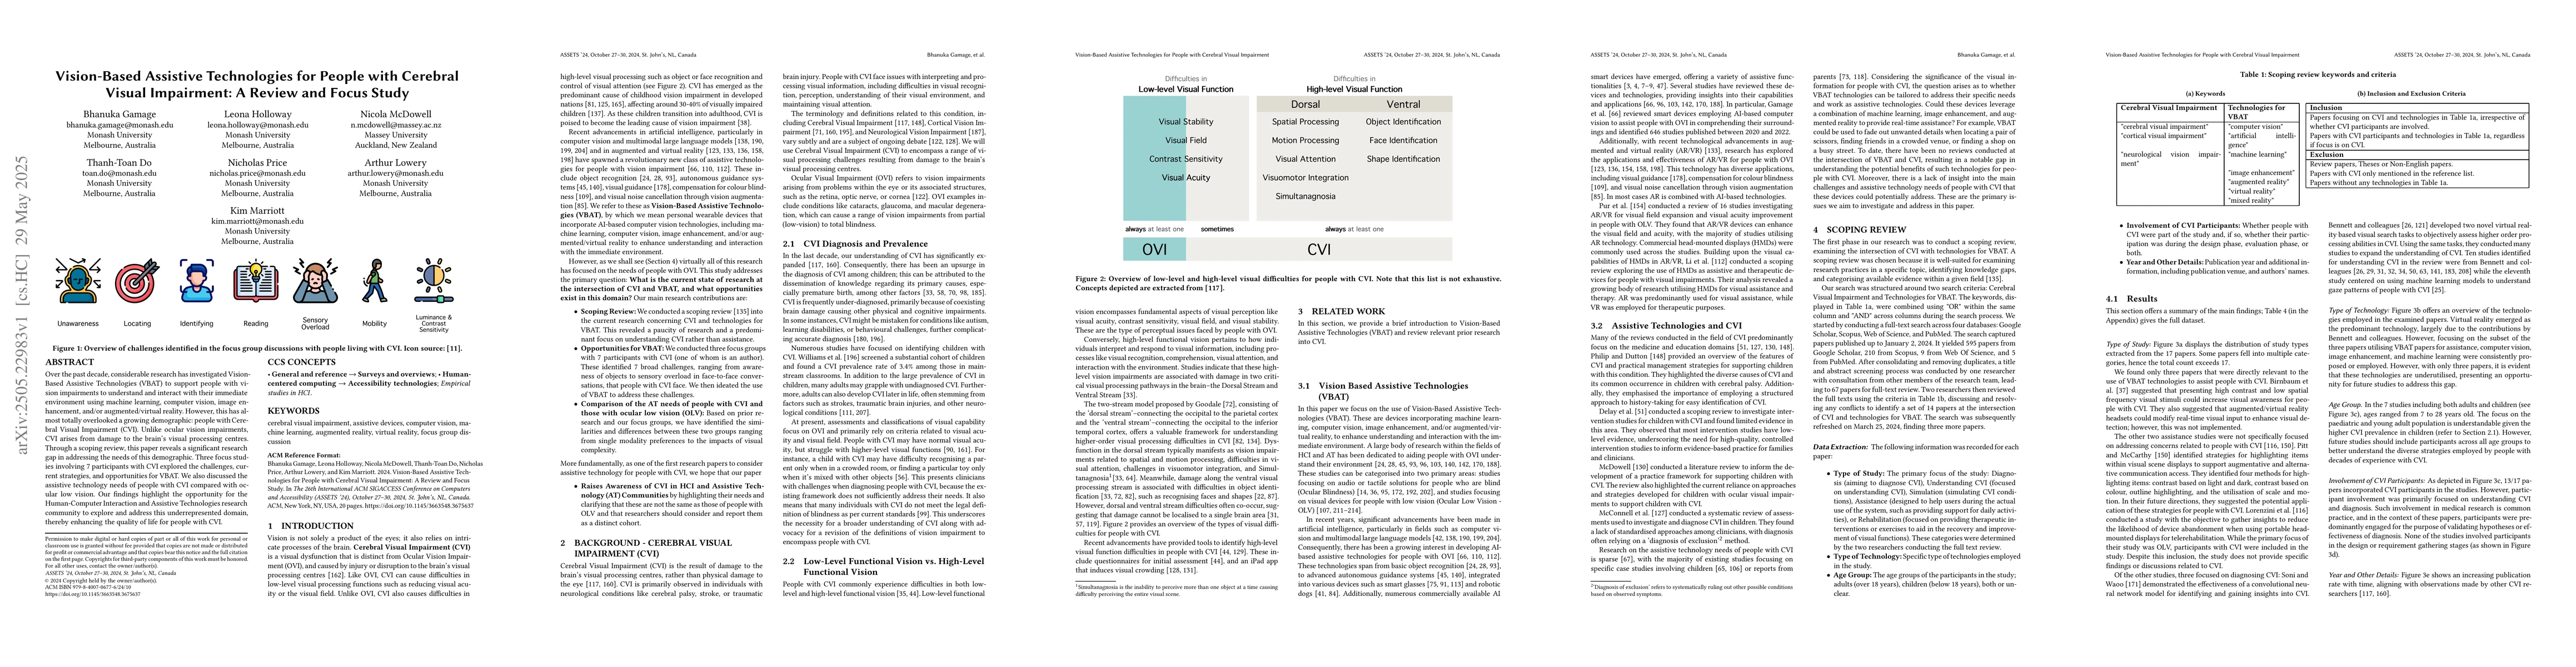
Cerebral Visual Impairment (CVI) is the set to be the leading cause of vision impairment, yet remains underrepresented in assistive technology research. Unlike ocular conditions, CVI affects higher-or...
Our work aims to develop new assistive technologies that enable blind or low vision (BLV) people to explore and analyze data readily. At present, barriers exist for BLV people to explore and analyze d...
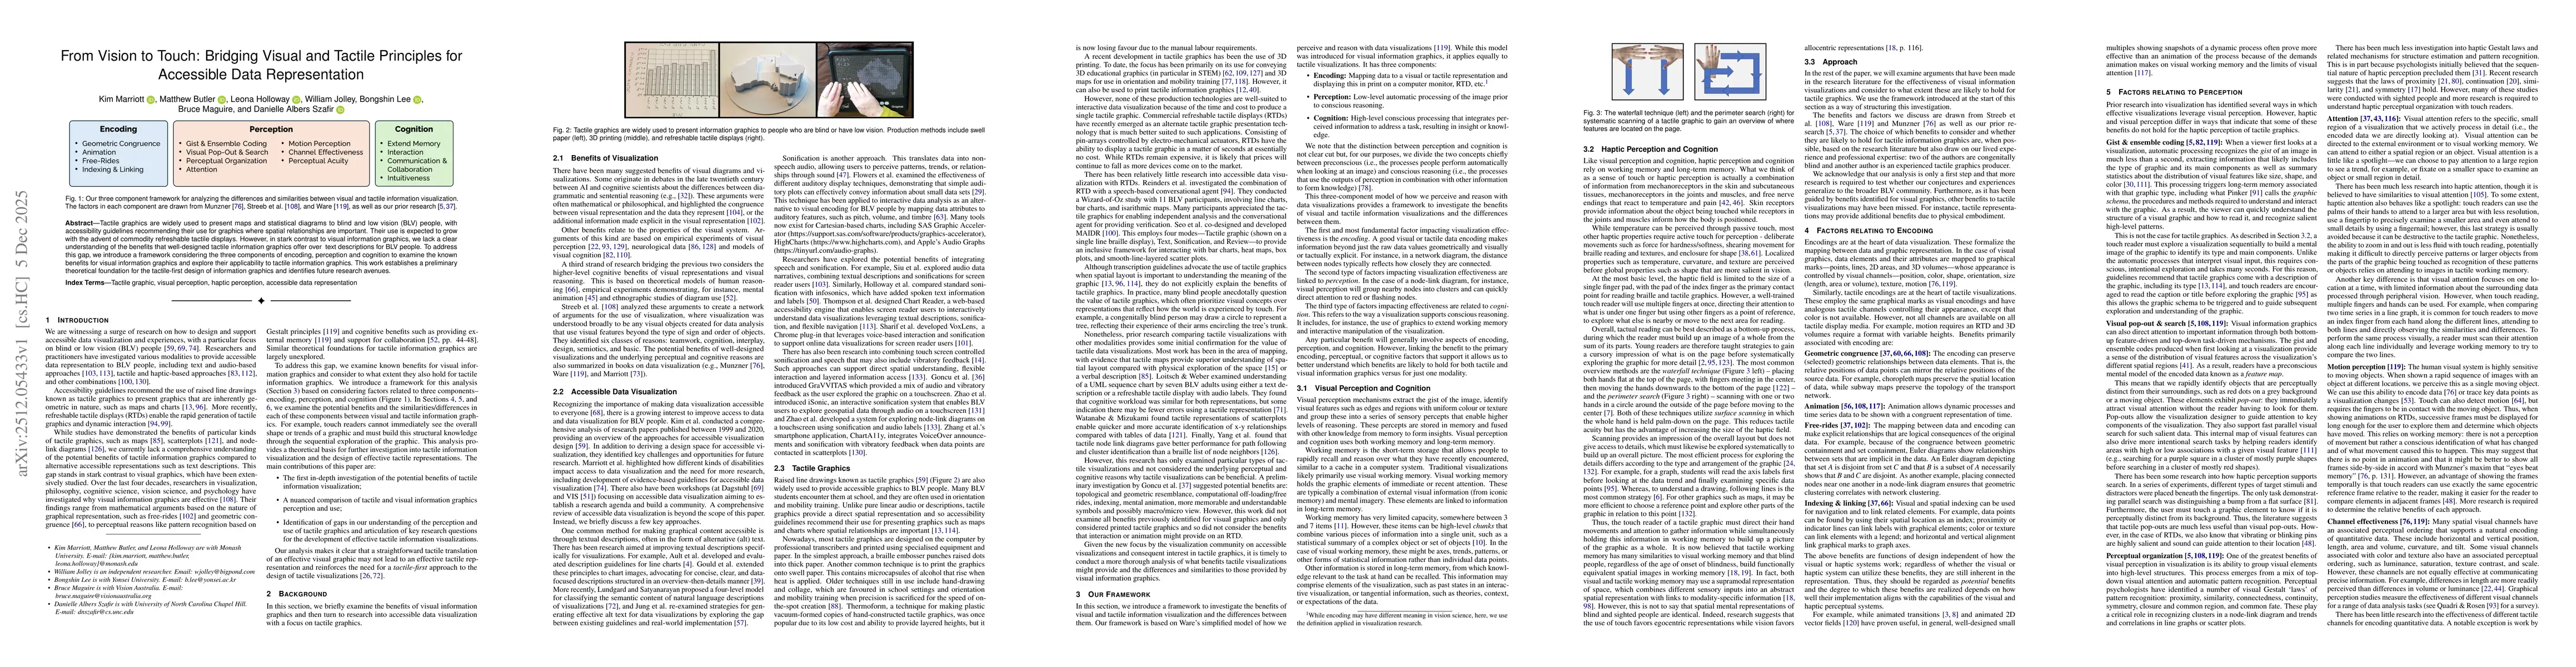
Tactile graphics are widely used to present maps and statistical diagrams to blind and low vision (BLV) people, with accessibility guidelines recommending their use for graphics where spatial relation...
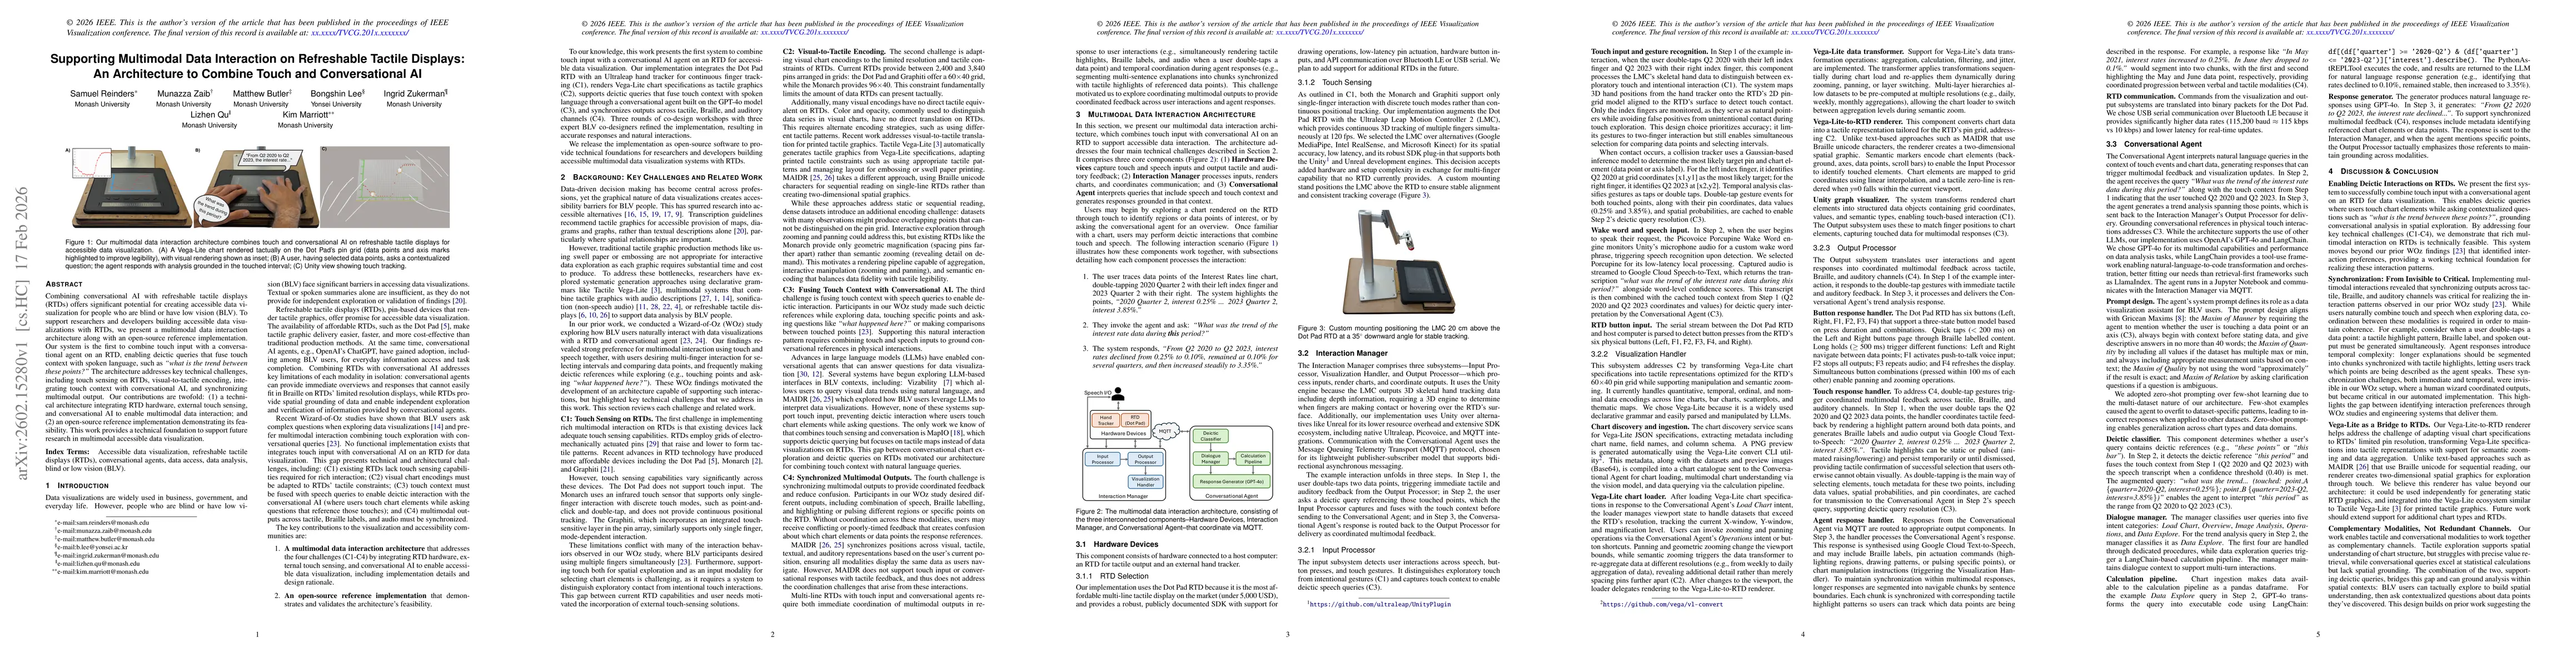
Combining conversational AI with refreshable tactile displays (RTDs) offers significant potential for creating accessible data visualization for people who are blind or have low vision (BLV). To suppo...
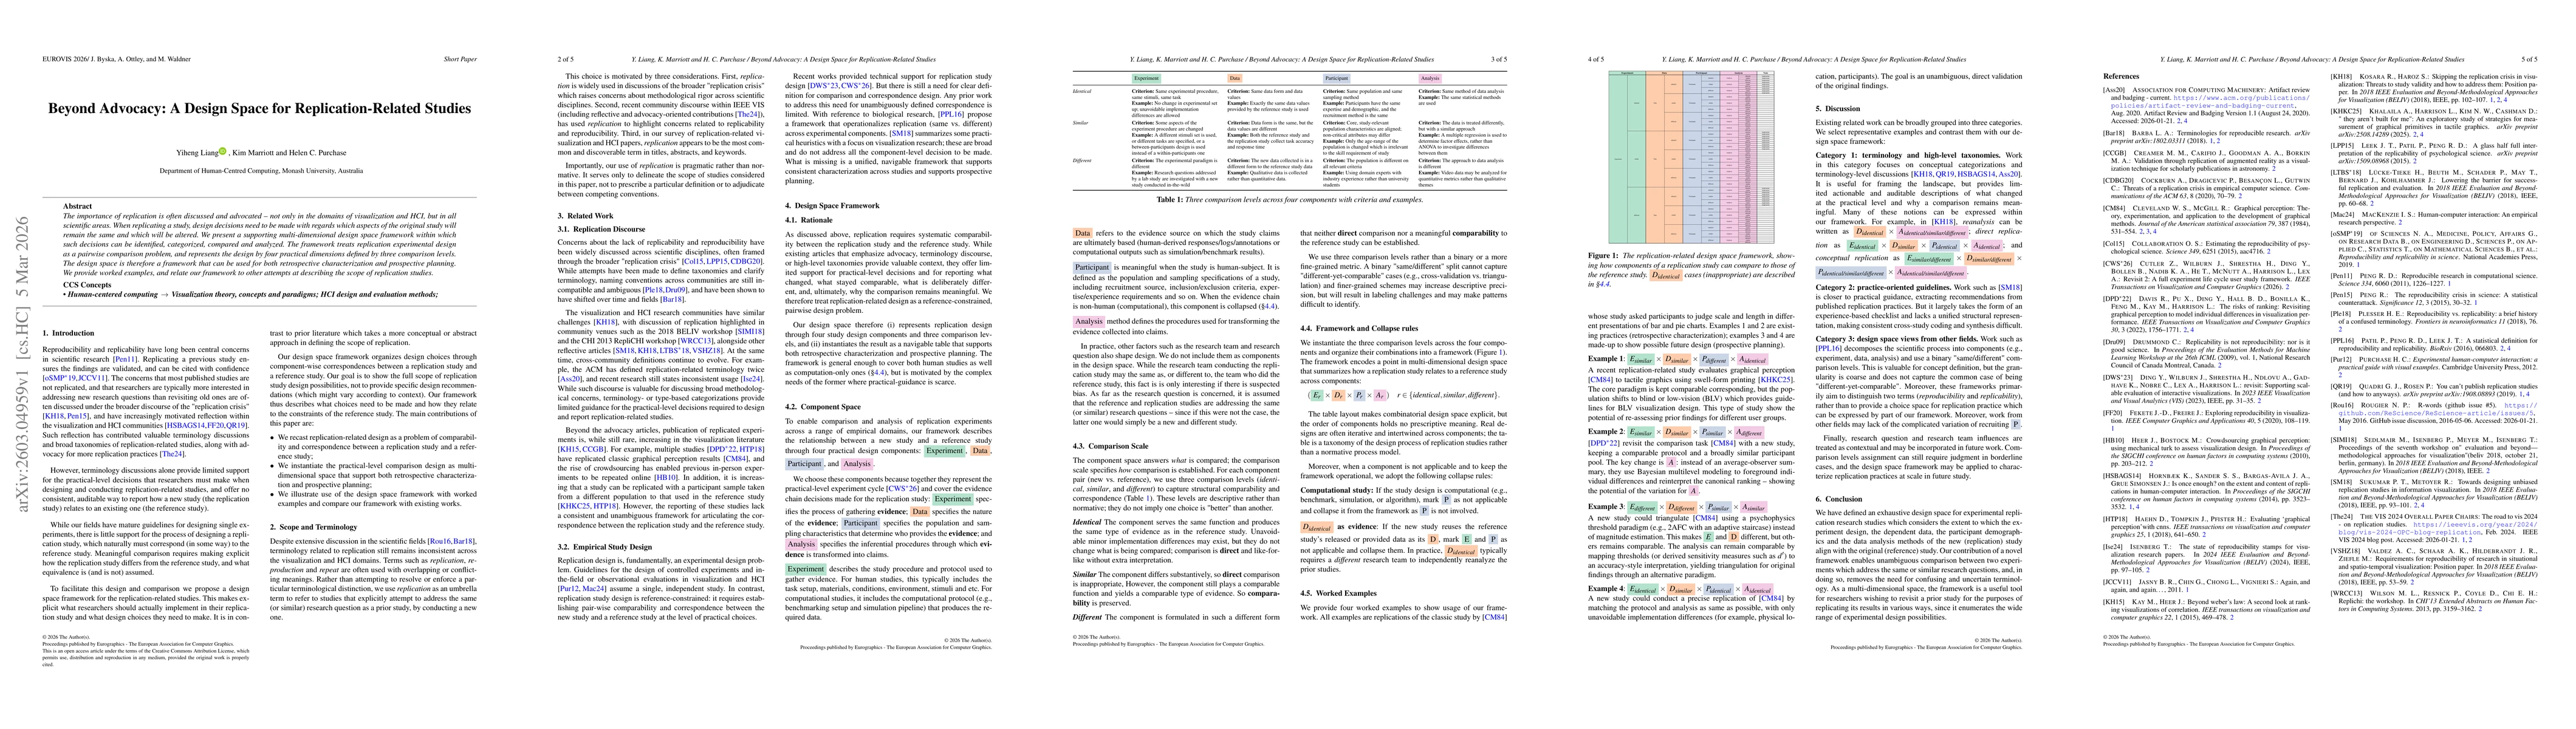
The importance of replication is often discussed and advocated -- not only in the domains of visualization and HCI, but in all scientific areas. When replicating a study, design decisions need to be m...
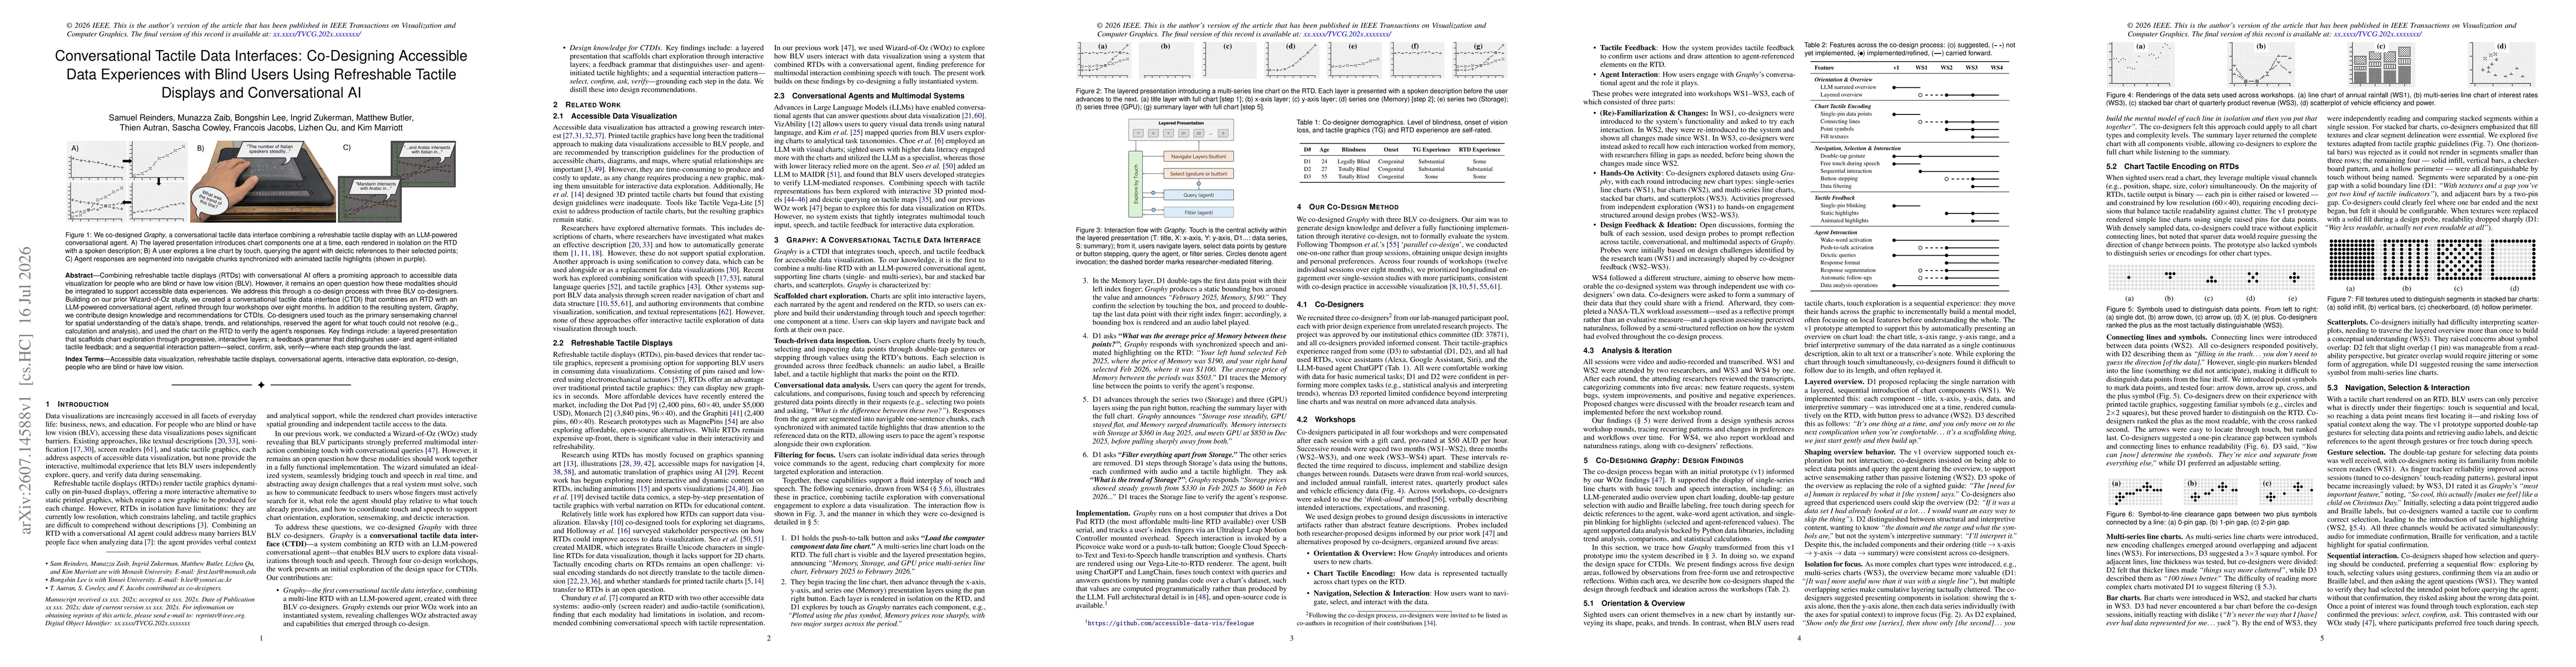
Combining refreshable tactile displays (RTDs) with conversational AI offers a promising approach to accessible data visualization for people who are blind or have low vision (BLV). However, it remains...