A Study on a User-Controlled Radial Tour for Variable Importance in High-Dimensional Data
Publication
Metrics
AI Quick Summary
This study evaluates the efficacy of a user-controlled radial tour for assessing variable importance in high-dimensional data against principal component analysis and the grand tour. Results from 108 participants show the radial tour significantly improves accuracy and is preferred for its effectiveness in variable attribution.
Paper Preview
Abstract
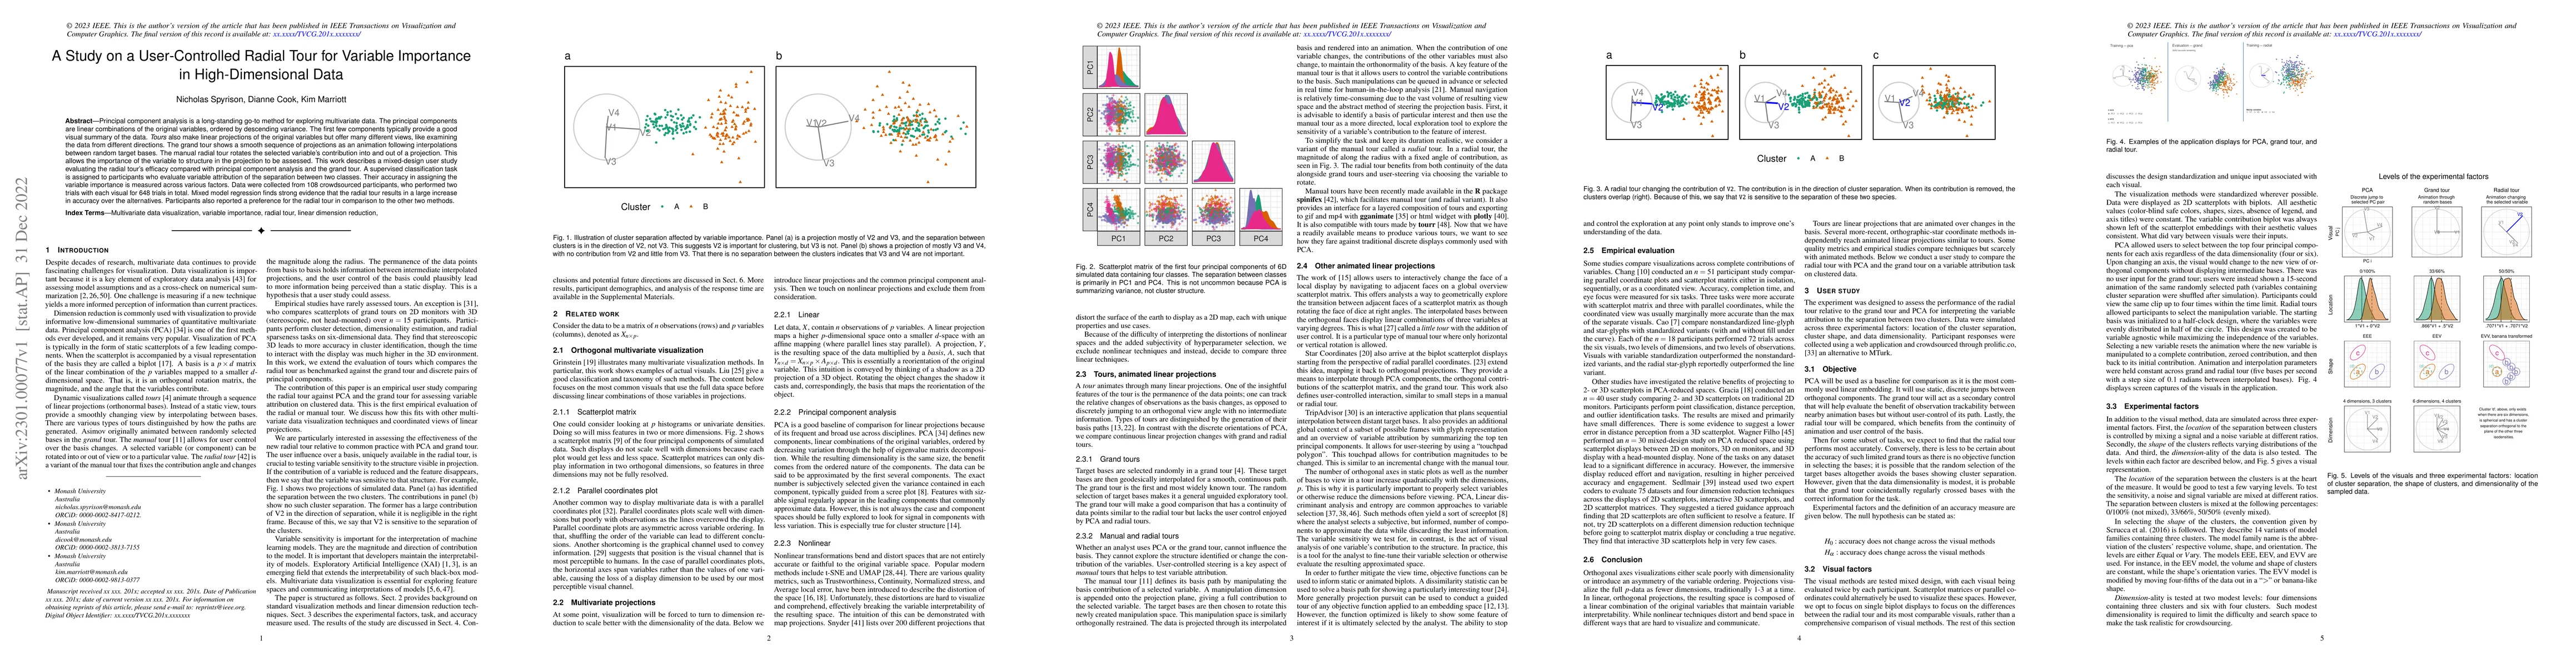
Principal component analysis is a long-standing go-to method for exploring multivariate data. The principal components are linear combinations of the original variables, ordered by descending variance. The first few components typically provide a good visual summary of the data. Tours also make linear projections of the original variables but offer many different views, like examining the data from different directions. The grand tour shows a smooth sequence of projections as an animation following interpolations between random target bases. The manual radial tour rotates the selected variable's contribution into and out of a projection. This allows the importance of the variable to structure in the projection to be assessed. This work describes a mixed-design user study evaluating the radial tour's efficacy compared with principal component analysis and the grand tour. A supervised classification task is assigned to participants who evaluate variable attribution of the separation between two classes. Their accuracy in assigning the variable importance is measured across various factors. Data were collected from 108 crowdsourced participants, who performed two trials with each visual for 648 trials in total. Mixed model regression finds strong evidence that the radial tour results in a large increase in accuracy over the alternatives. Participants also reported a preference for the radial tour in comparison to the other two methods.
AI Key Findings
Get AI-generated insights about this paper's methodology, results, significance, and more — seven facets brought into focus.
Impact
Paper Details
Authors
PDF Preview
Key Terms
Citation Network
Current paper (gray), citations (green), references (blue)
Display is limited for performance on very large graphs.
Discussion 0