Academic Profile
Statistics
Similar Authors
Papers on arXiv
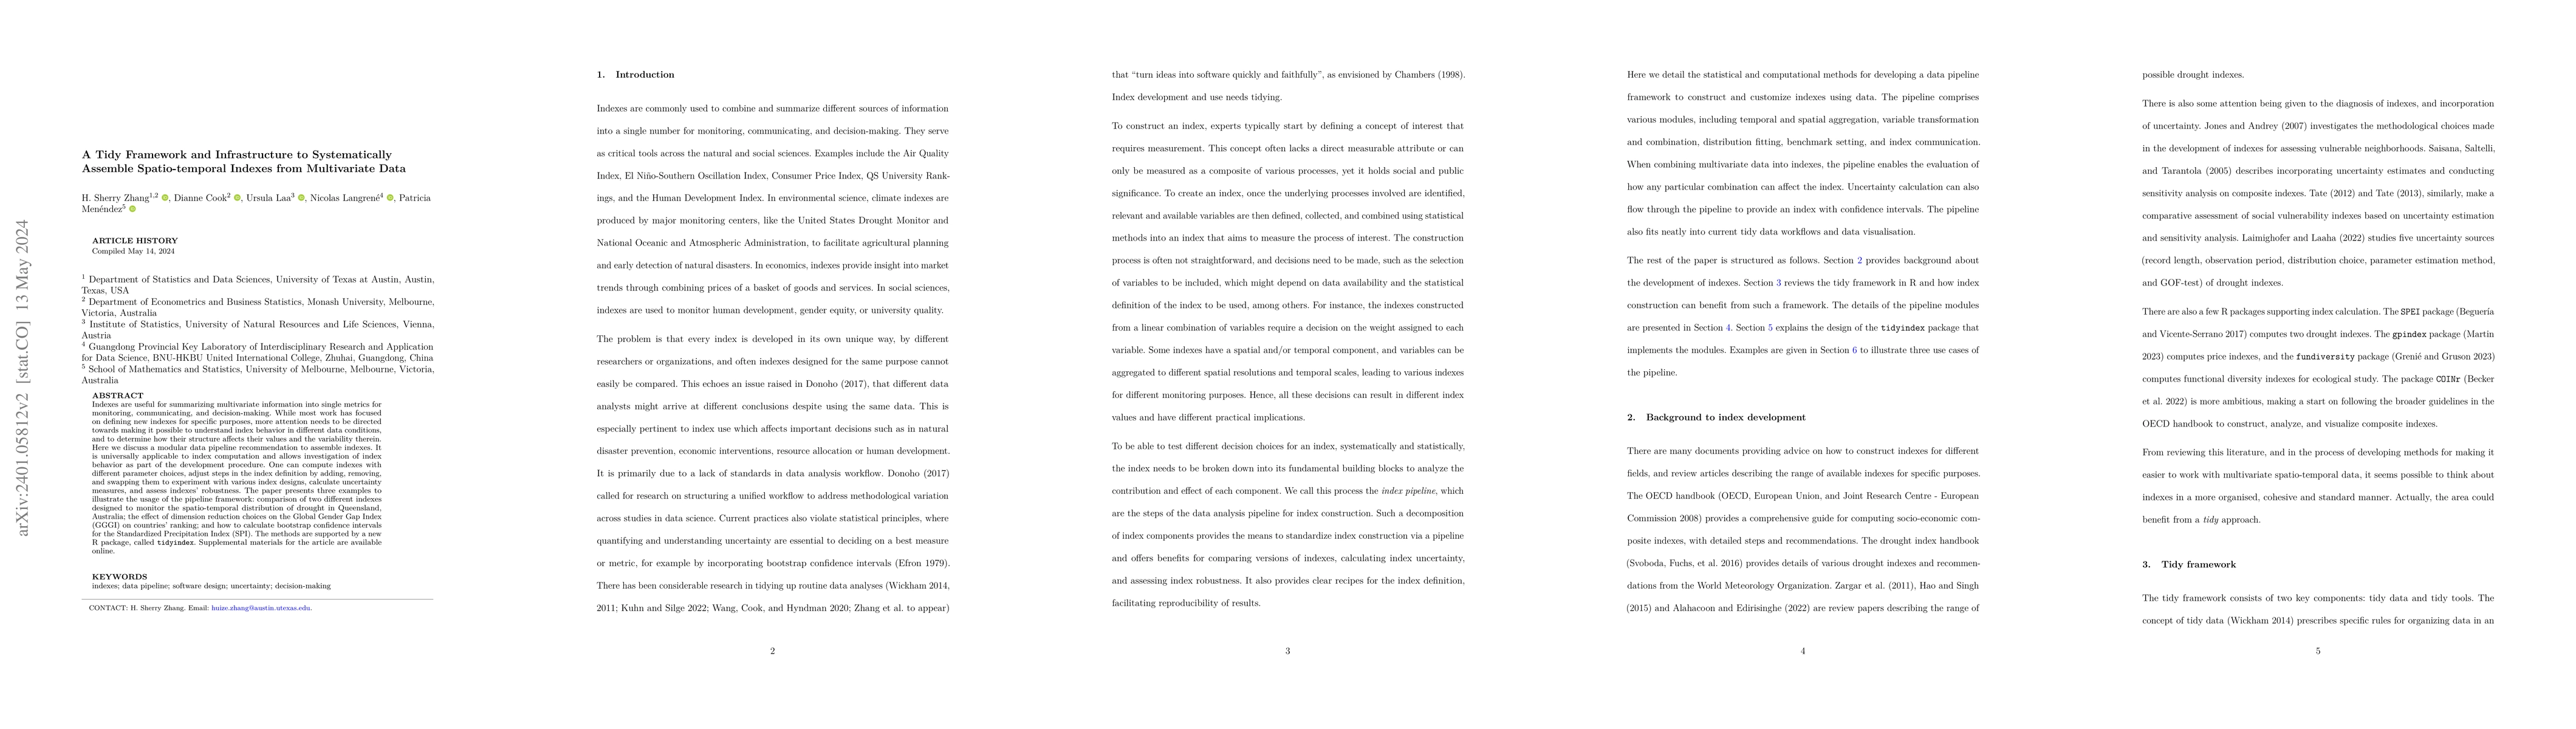
Indexes are useful for summarizing multivariate information into single metrics for monitoring, communicating, and decision-making. While most work has focused on defining new indexes for specific p...
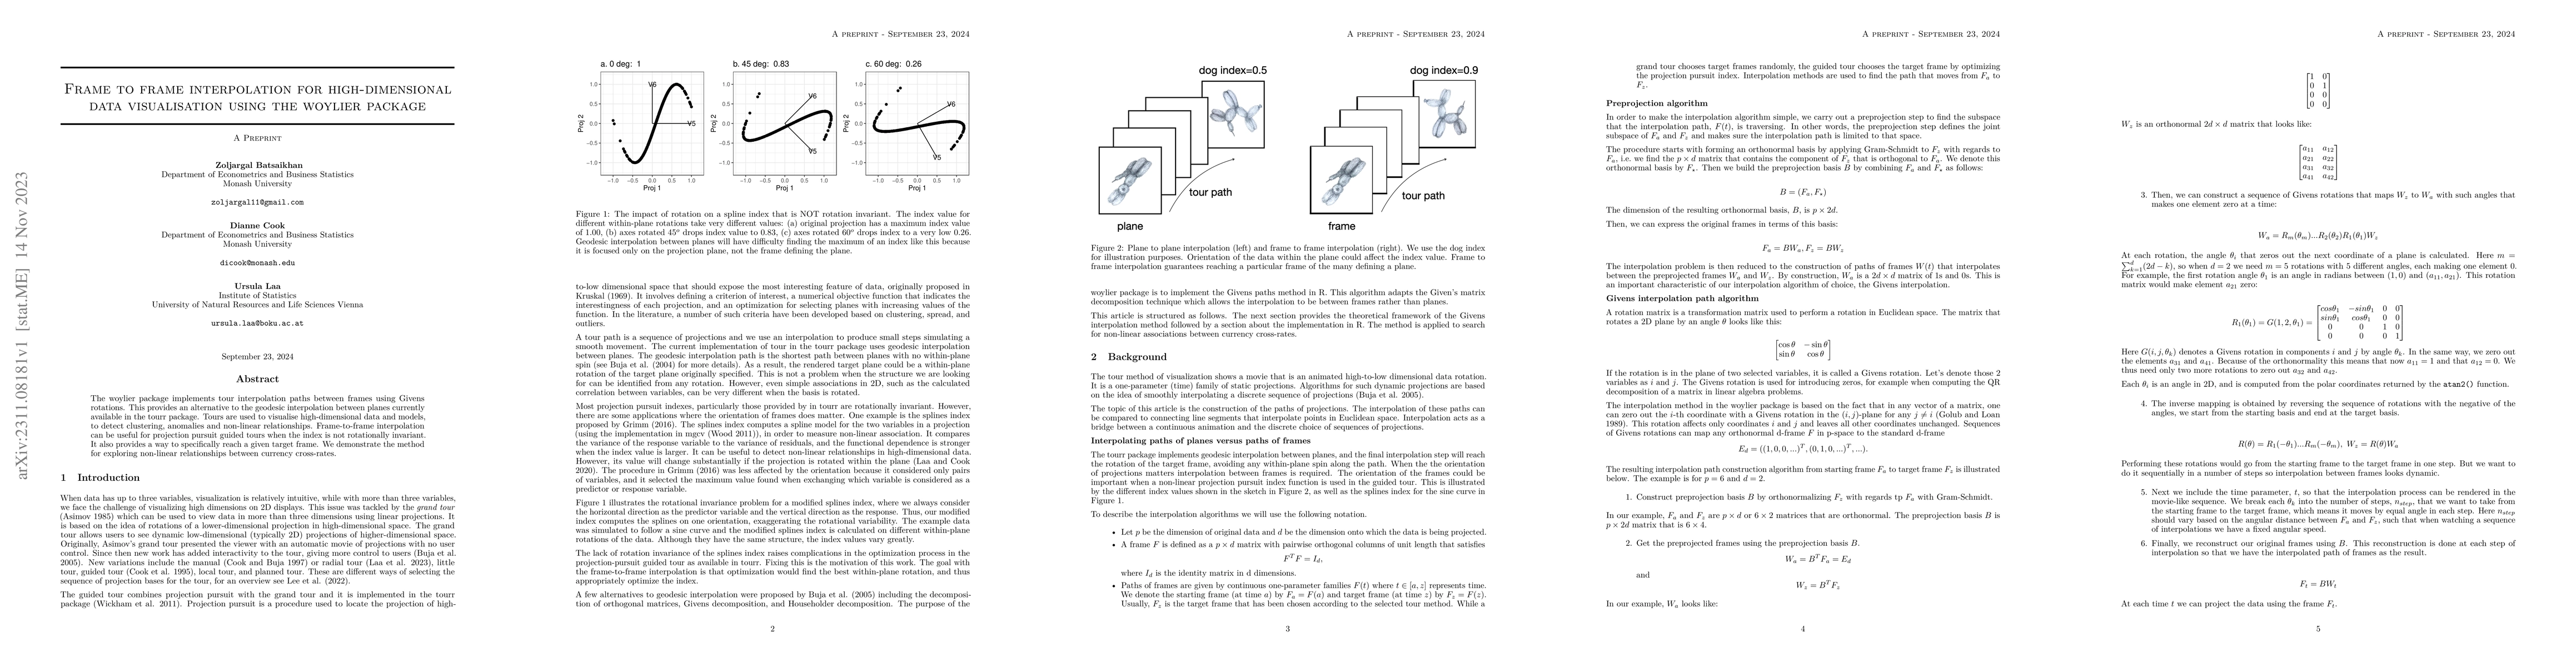
The woylier package implements tour interpolation paths between frames using Givens rotations. This provides an alternative to the geodesic interpolation between planes currently available in the to...
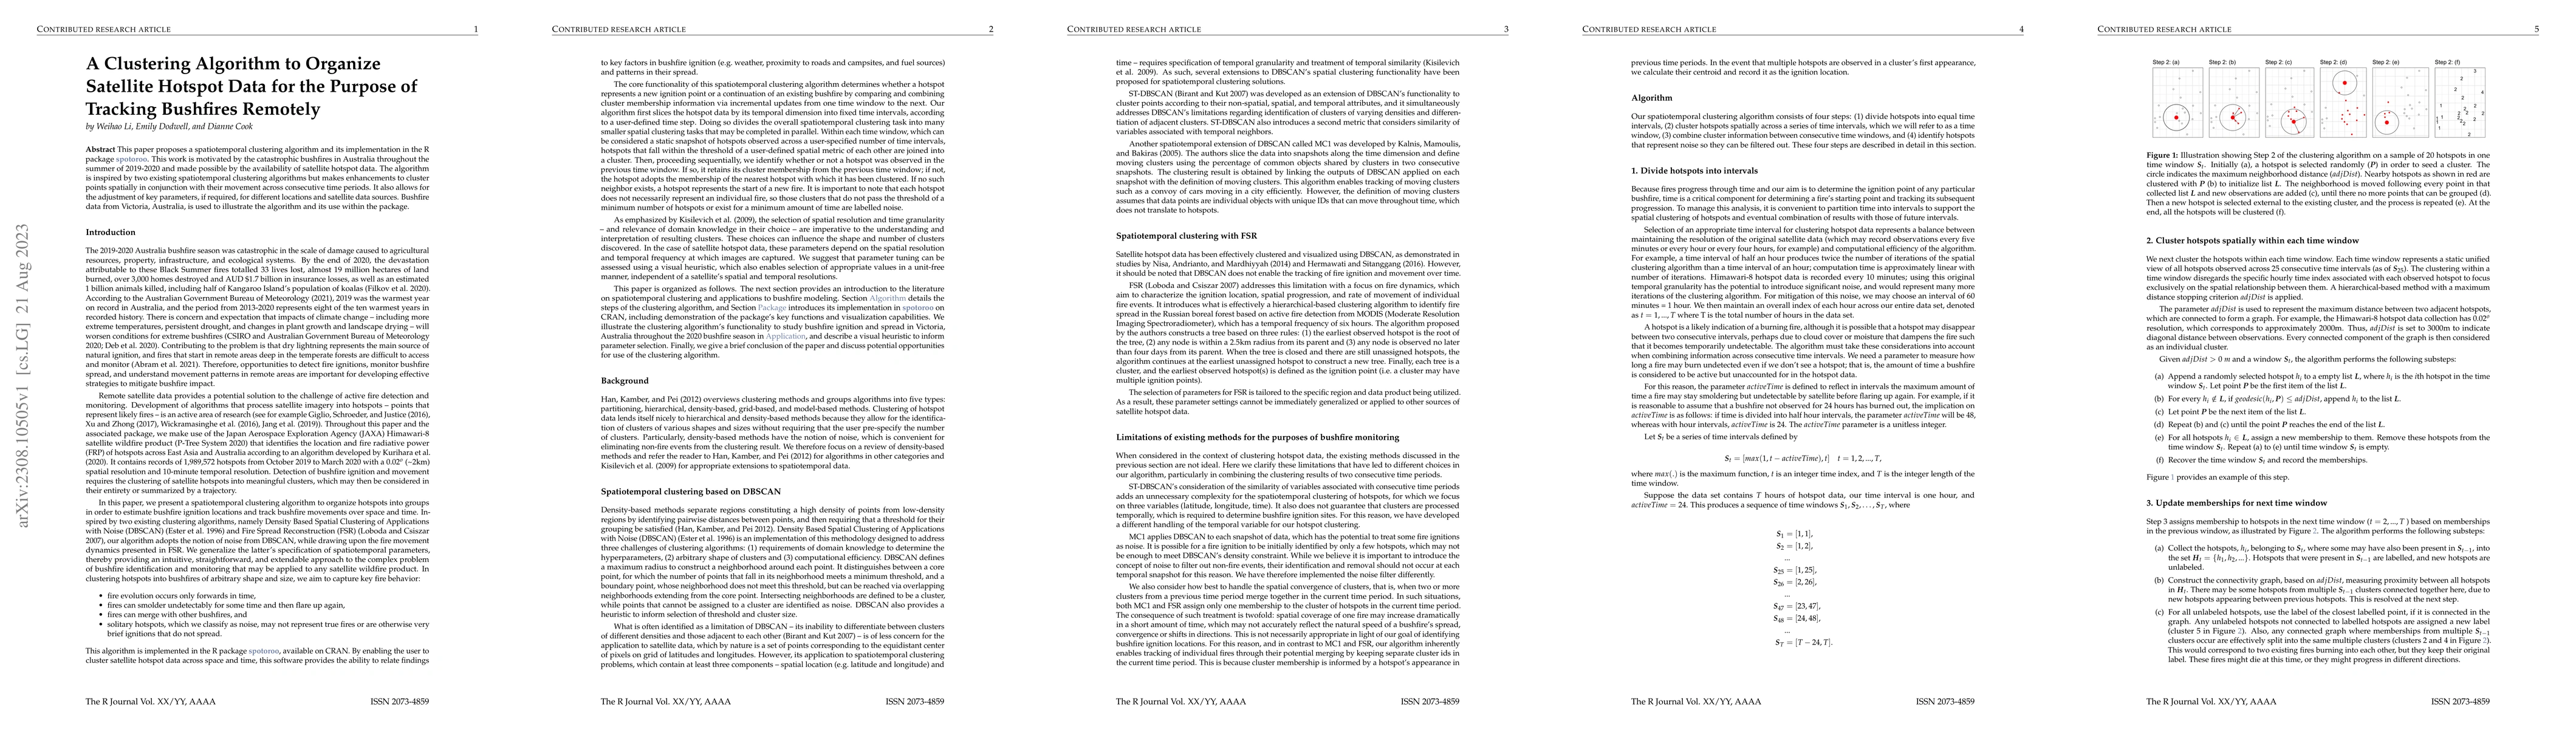
This paper proposes a spatiotemporal clustering algorithm and its implementation in the R package spotoroo. This work is motivated by the catastrophic bushfires in Australia throughout the summer of...
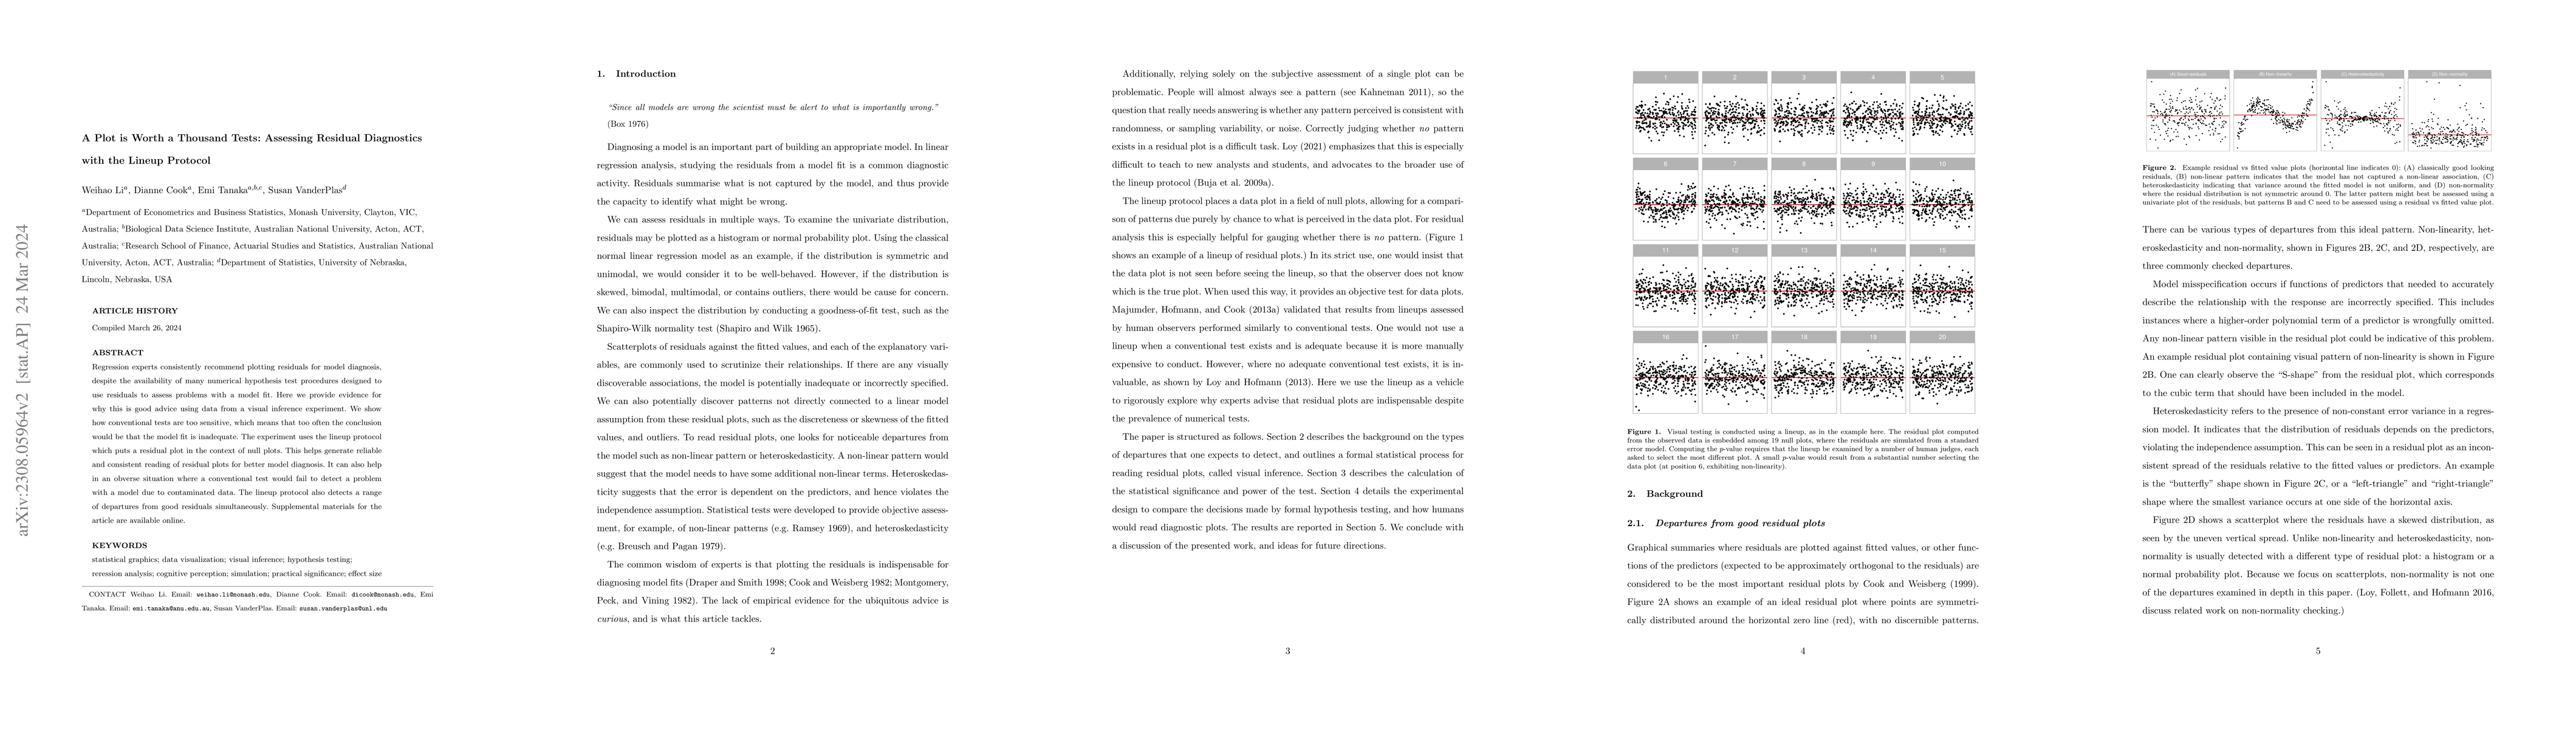
Regression experts consistently recommend plotting residuals for model diagnosis, despite the availability of many numerical hypothesis test procedures designed to use residuals to assess problems w...
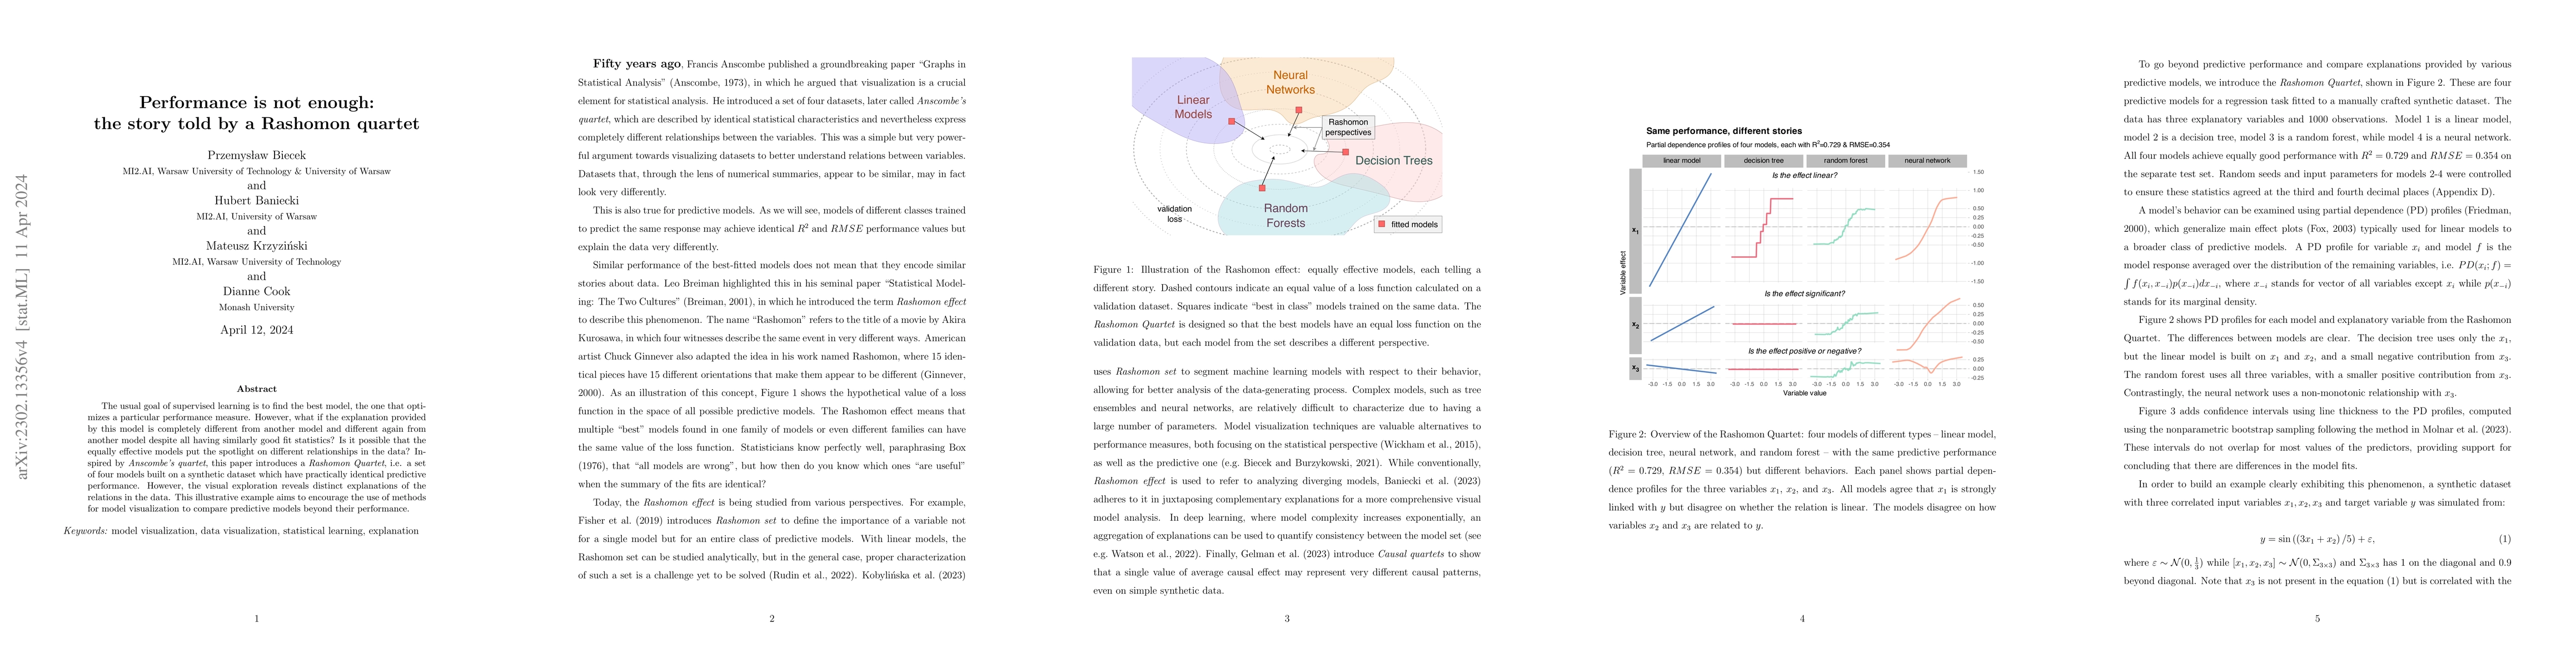
The usual goal of supervised learning is to find the best model, the one that optimizes a particular performance measure. However, what if the explanation provided by this model is completely differ...
Principal component analysis is a long-standing go-to method for exploring multivariate data. The principal components are linear combinations of the original variables, ordered by descending varian...
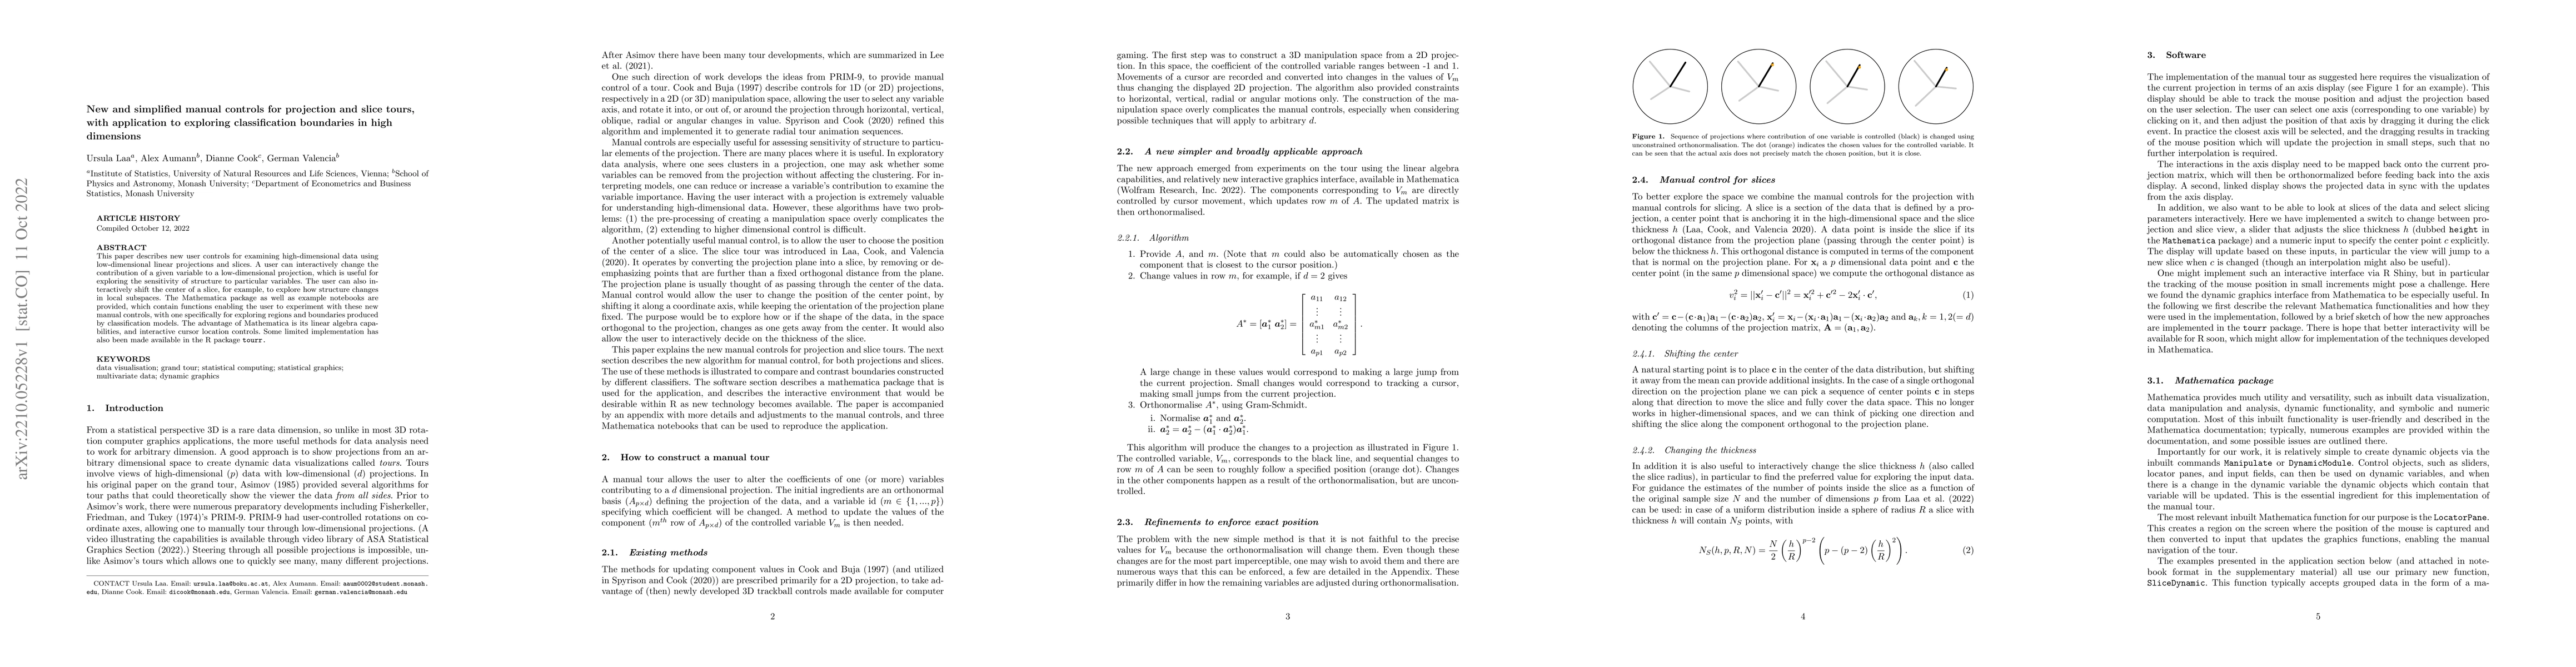
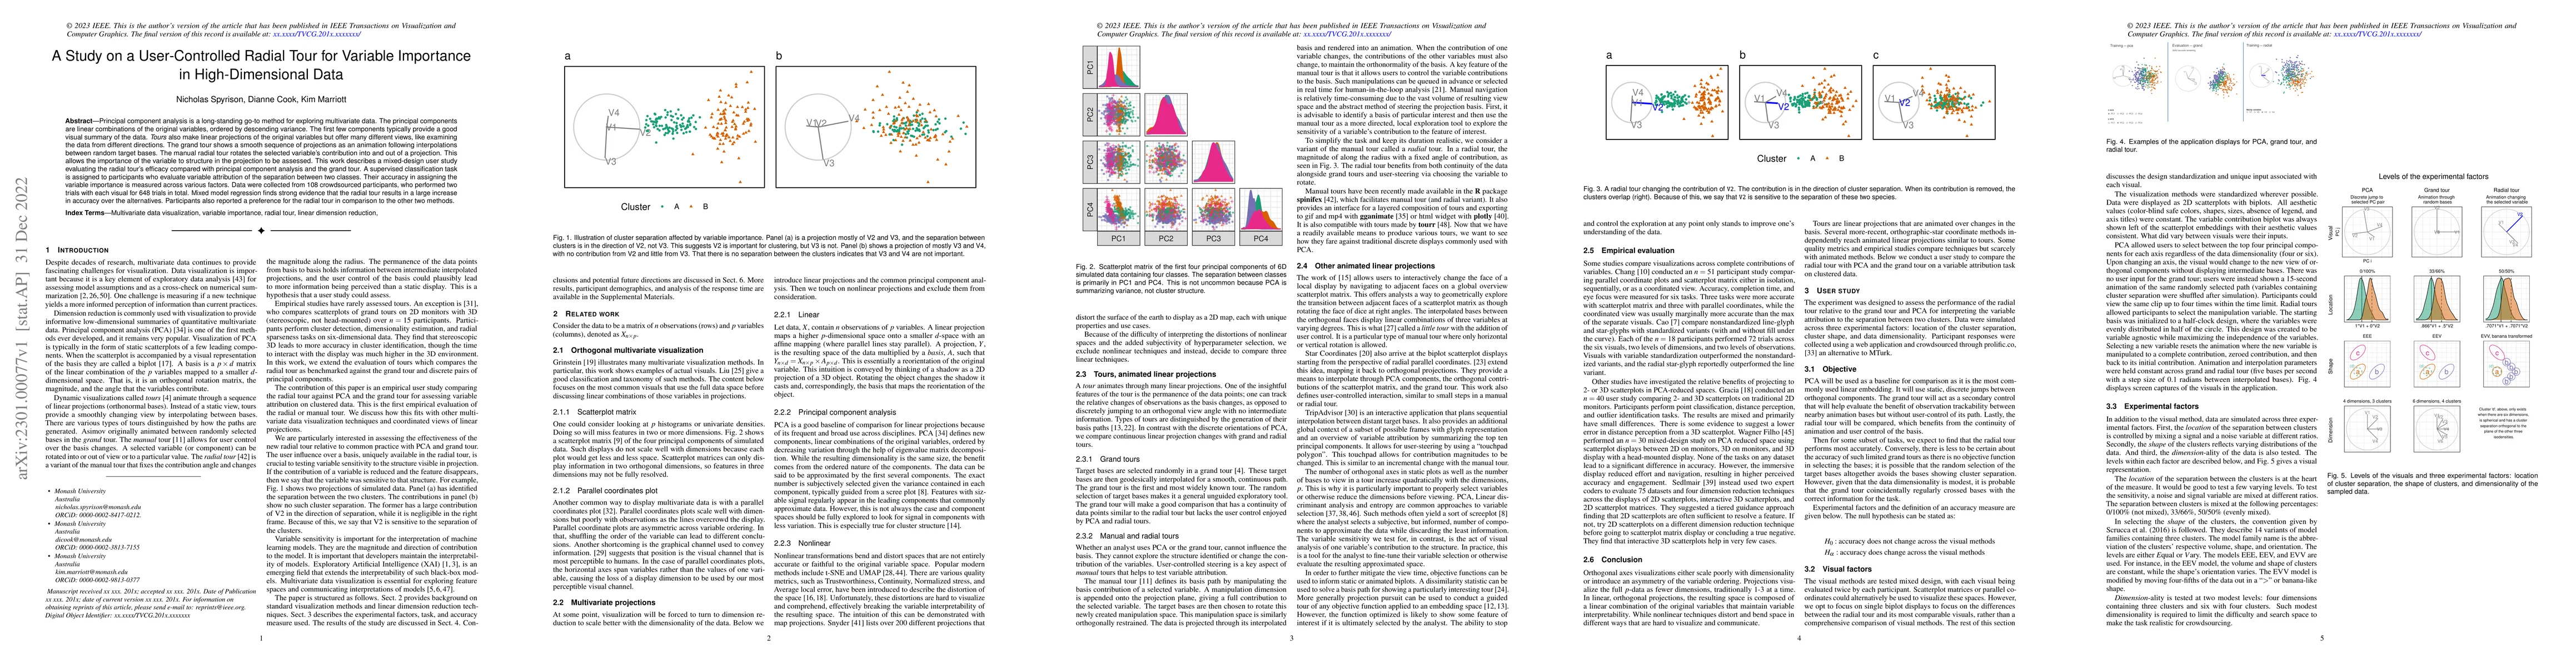
This paper describes new user controls for examining high-dimensional data using low-dimensional linear projections and slices. A user can interactively change the contribution of a given variable t...
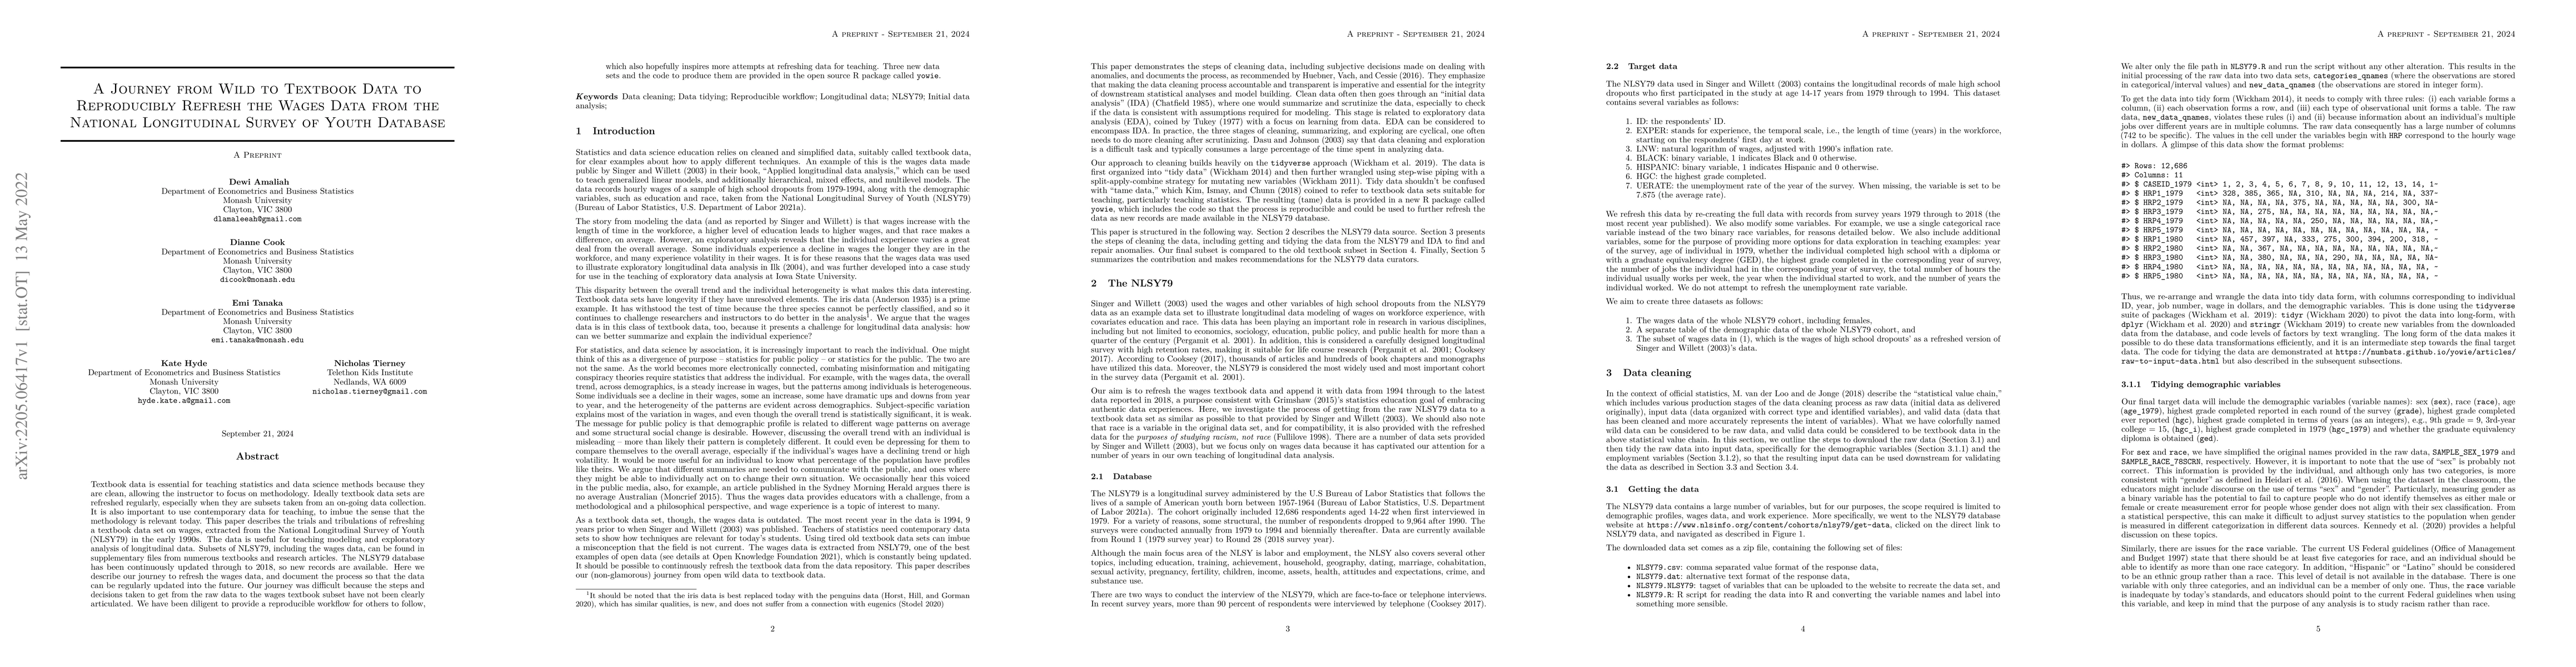
Textbook data is essential for teaching statistics and data science methods because they are clean, allowing the instructor to focus on methodology. Ideally textbook data sets are refreshed regularl...
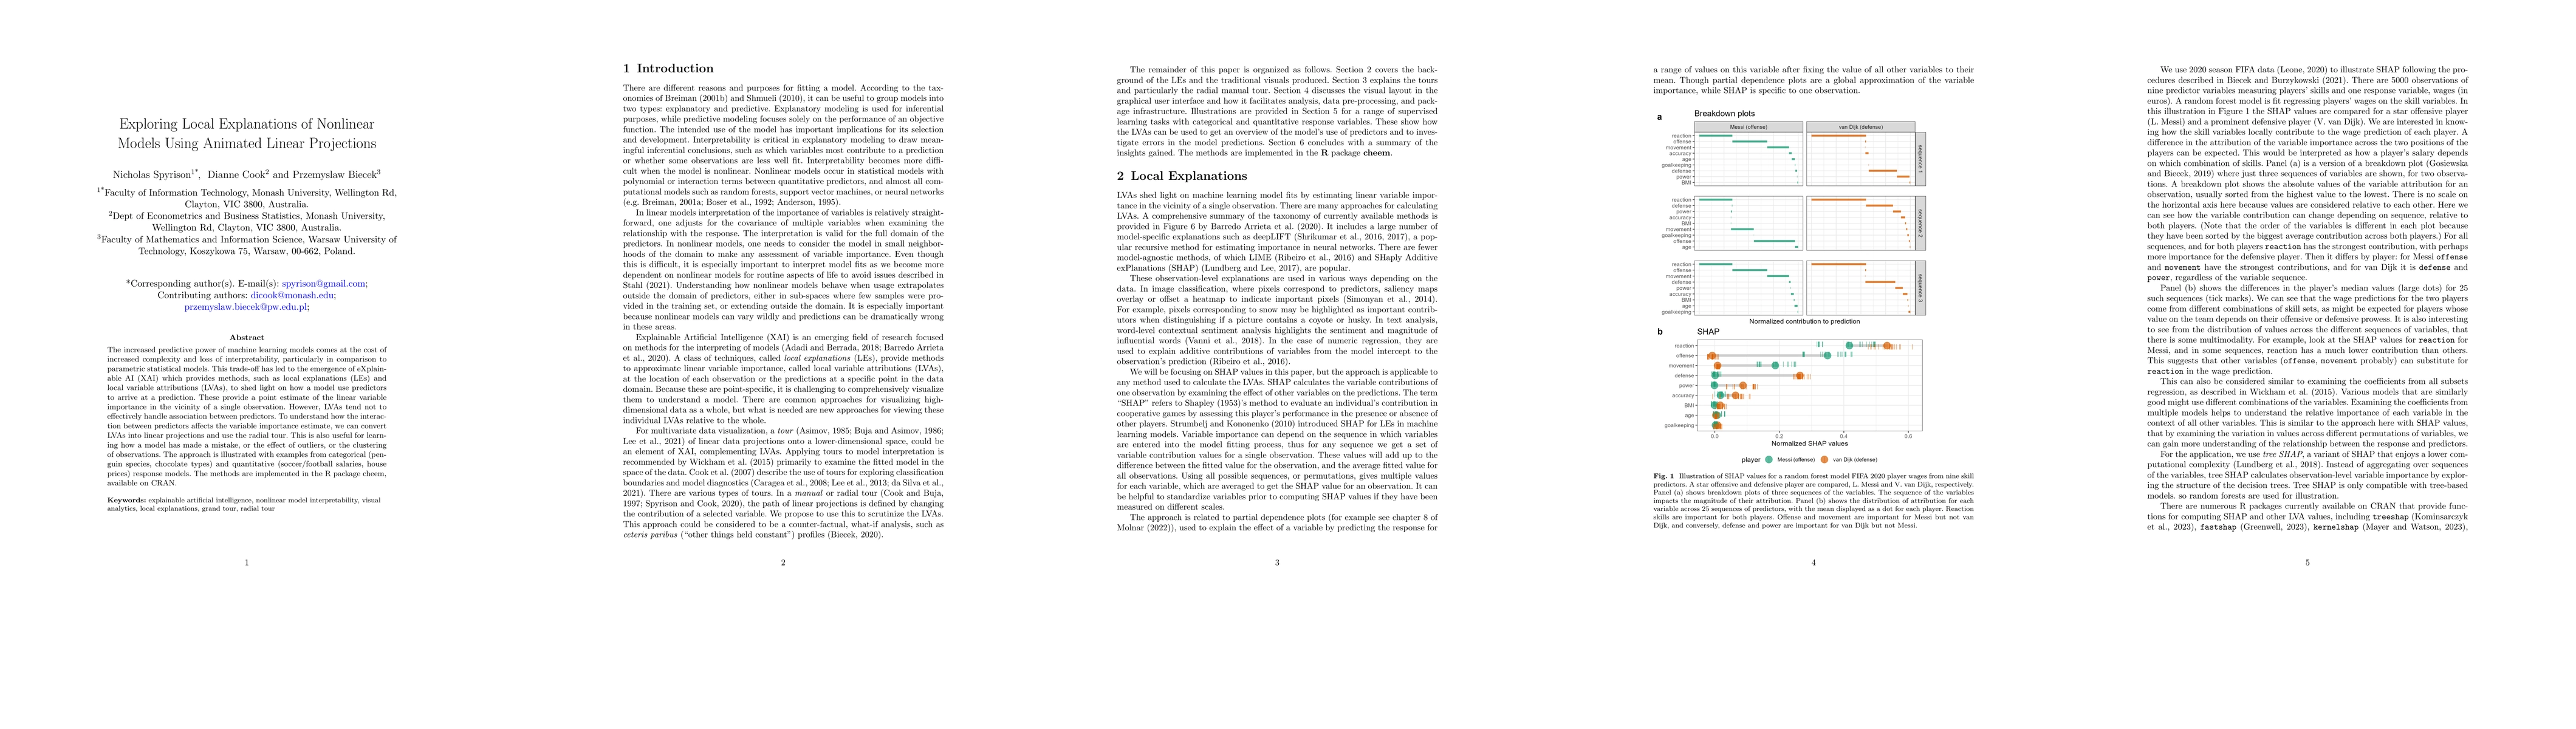
The increased predictive power of machine learning models comes at the cost of increased complexity and loss of interpretability, particularly in comparison to parametric statistical models. This tr...
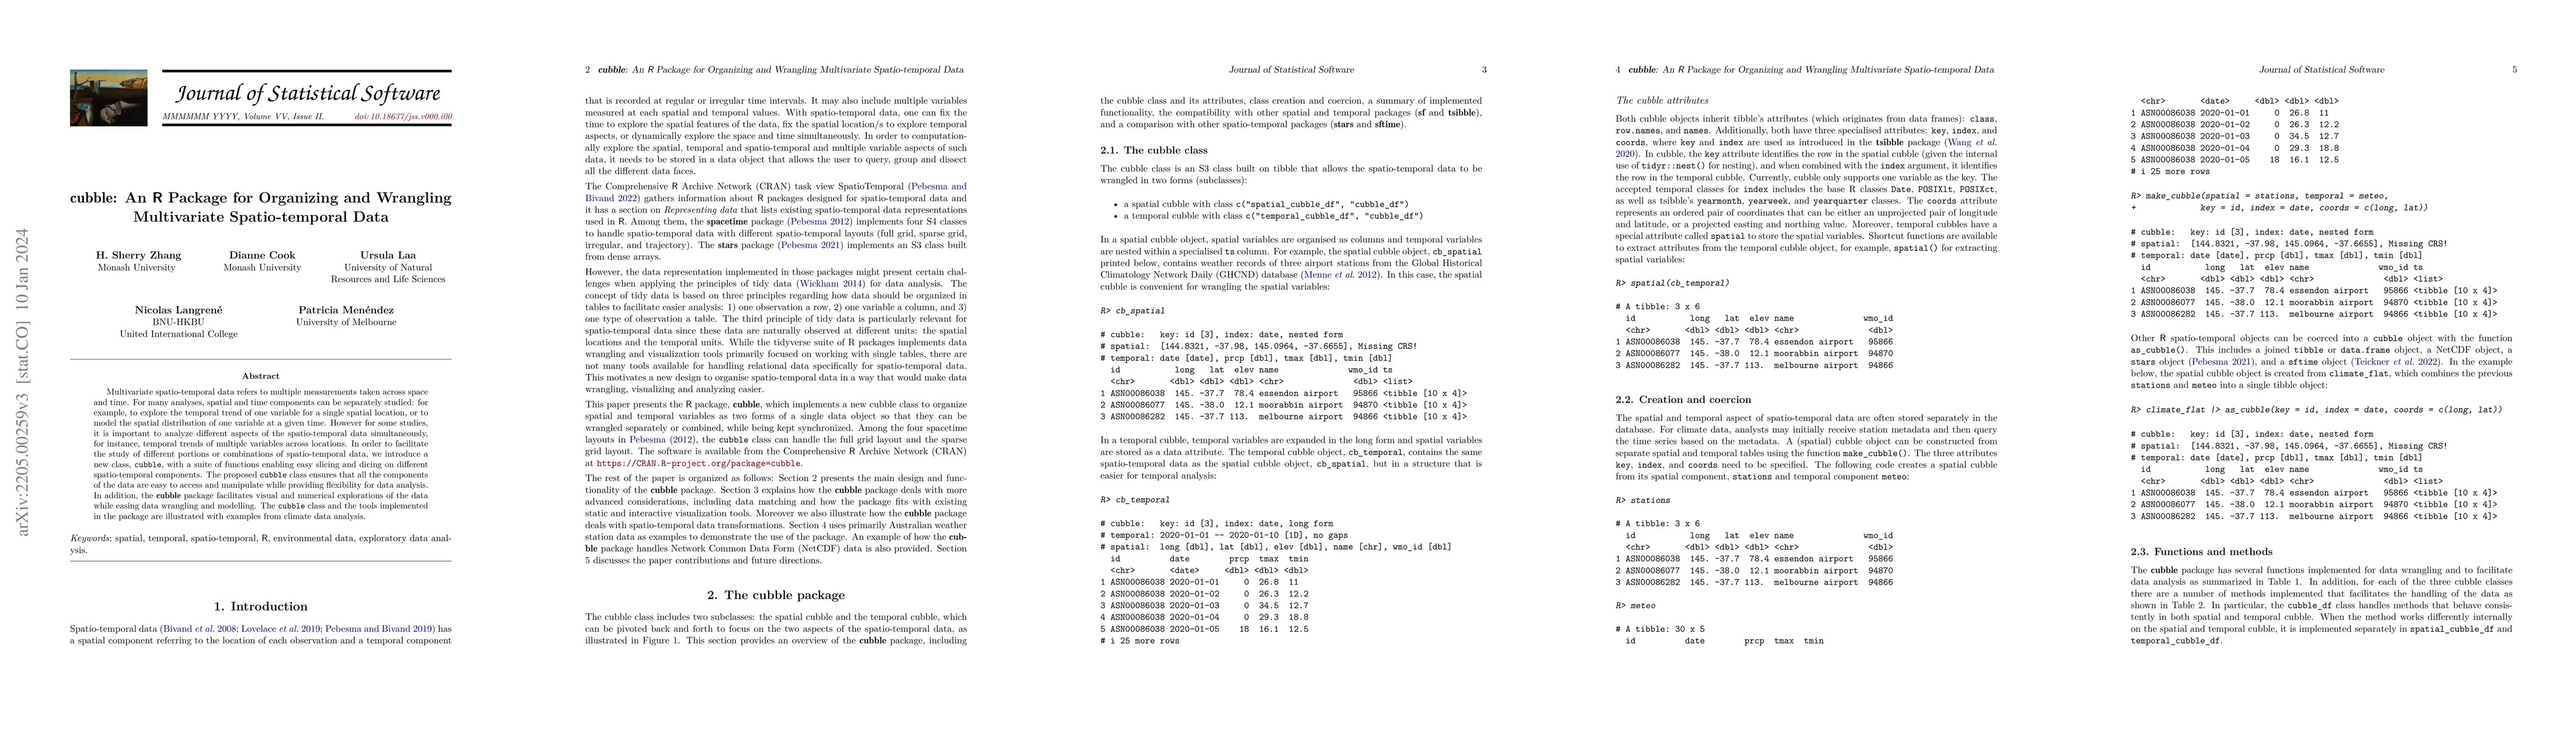
Multivariate spatio-temporal data refers to multiple measurements taken across space and time. For many analyses, spatial and time components can be separately studied: for example, to explore the t...
A guided tour helps to visualise high-dimensional data by showing low-dimensional projections along a projection pursuit optimisation path. Projection pursuit is a generalisation of principal compon...
Non-linear dimensionality reduction (NLDR) methods such as t-distributed stochastic neighbour embedding (t-SNE) are ubiquitous in the natural sciences, however, the appropriate use of these methods ...
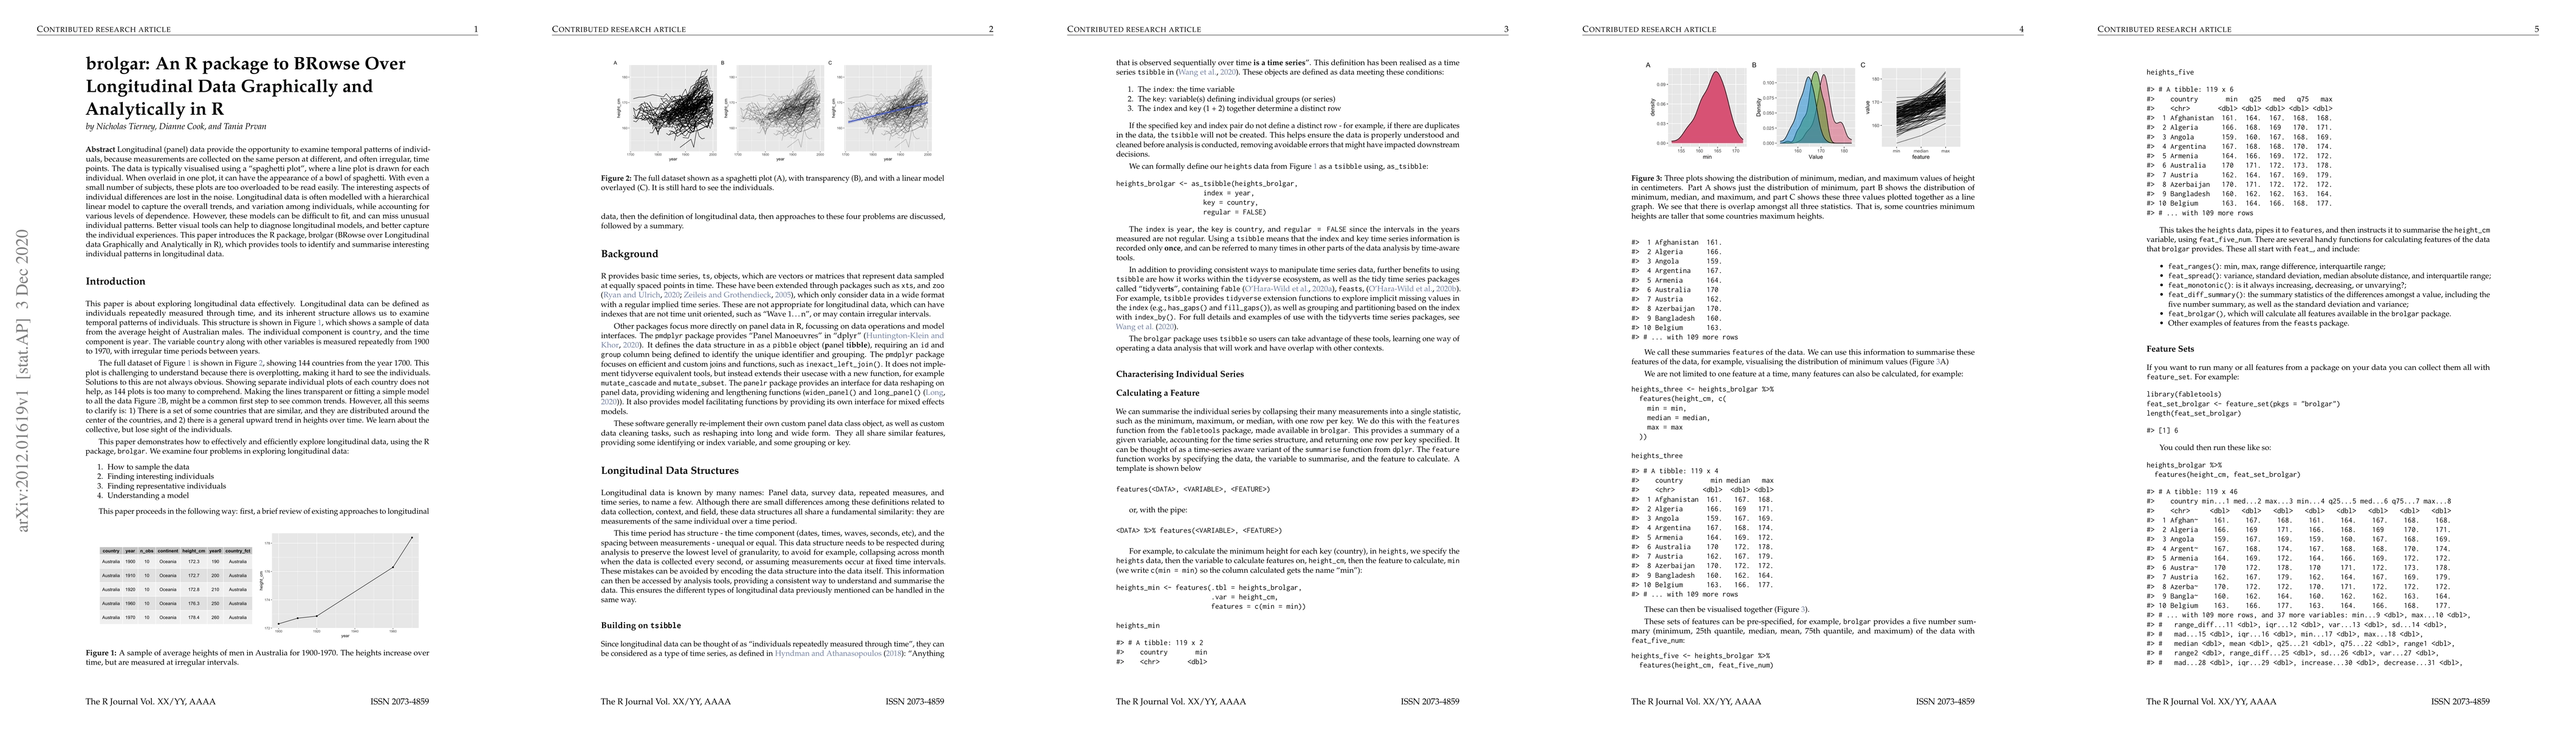
Longitudinal (panel) data provide the opportunity to examine temporal patterns of individuals, because measurements are collected on the same person at different, and often irregular, time points. T...
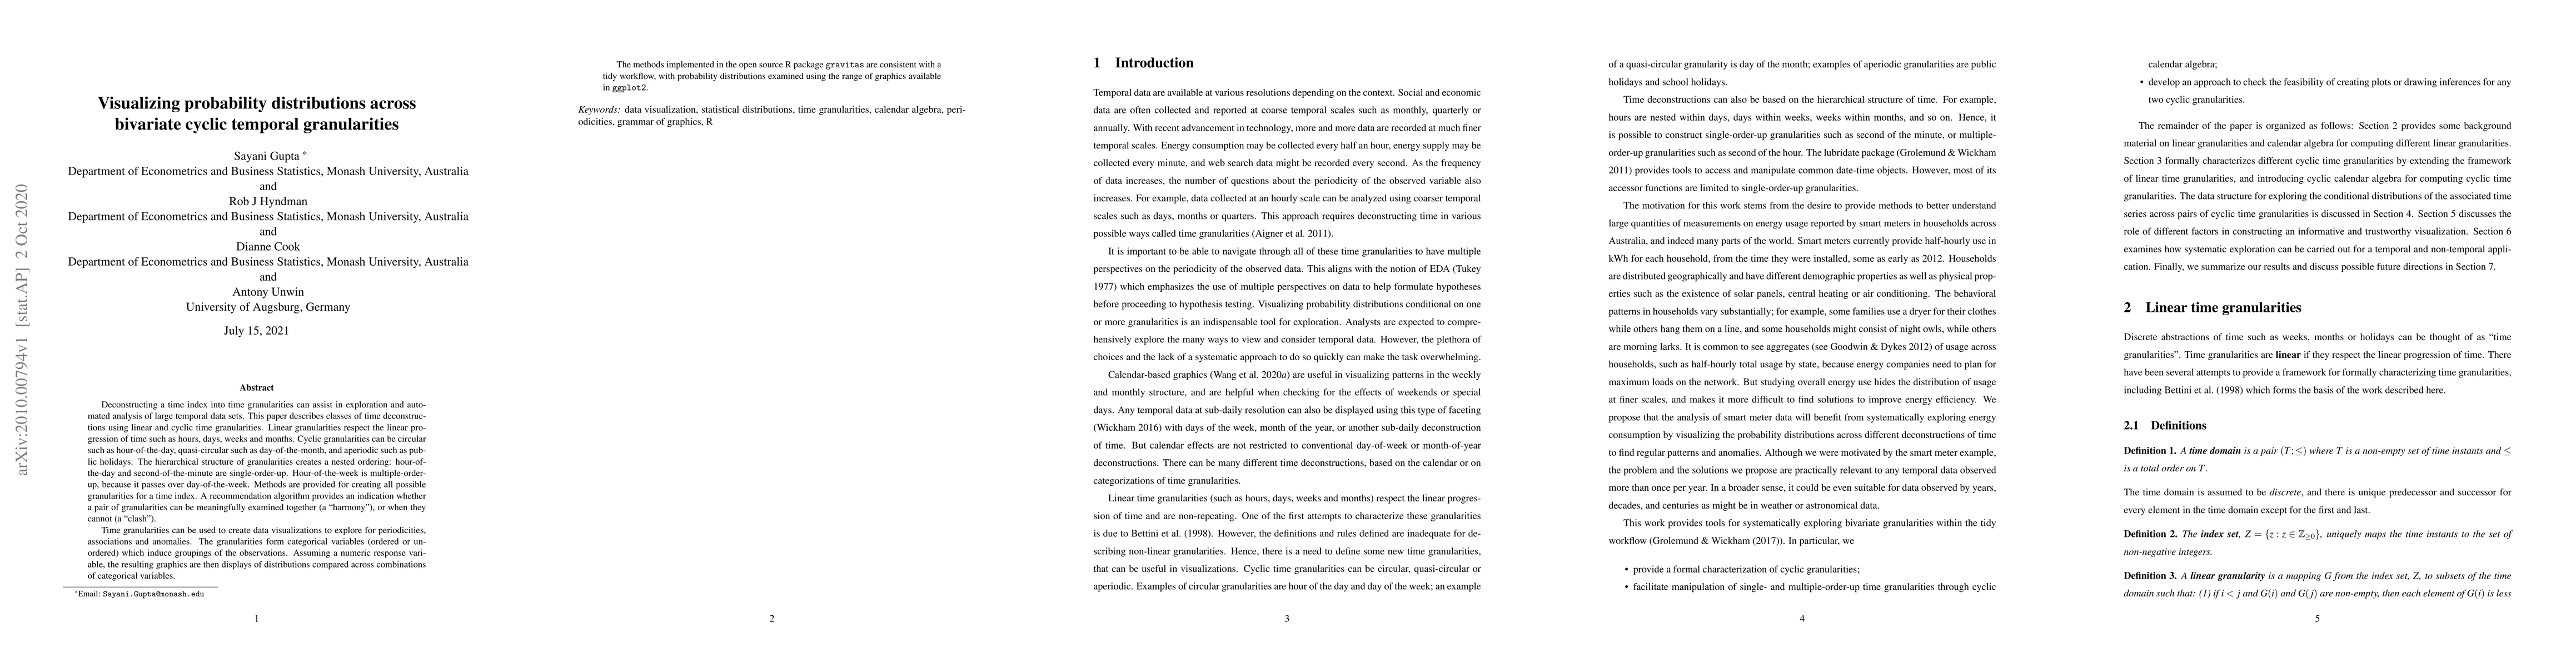
Deconstructing a time index into time granularities can assist in exploration and automated analysis of large temporal data sets. This paper describes classes of time deconstructions using linear an...
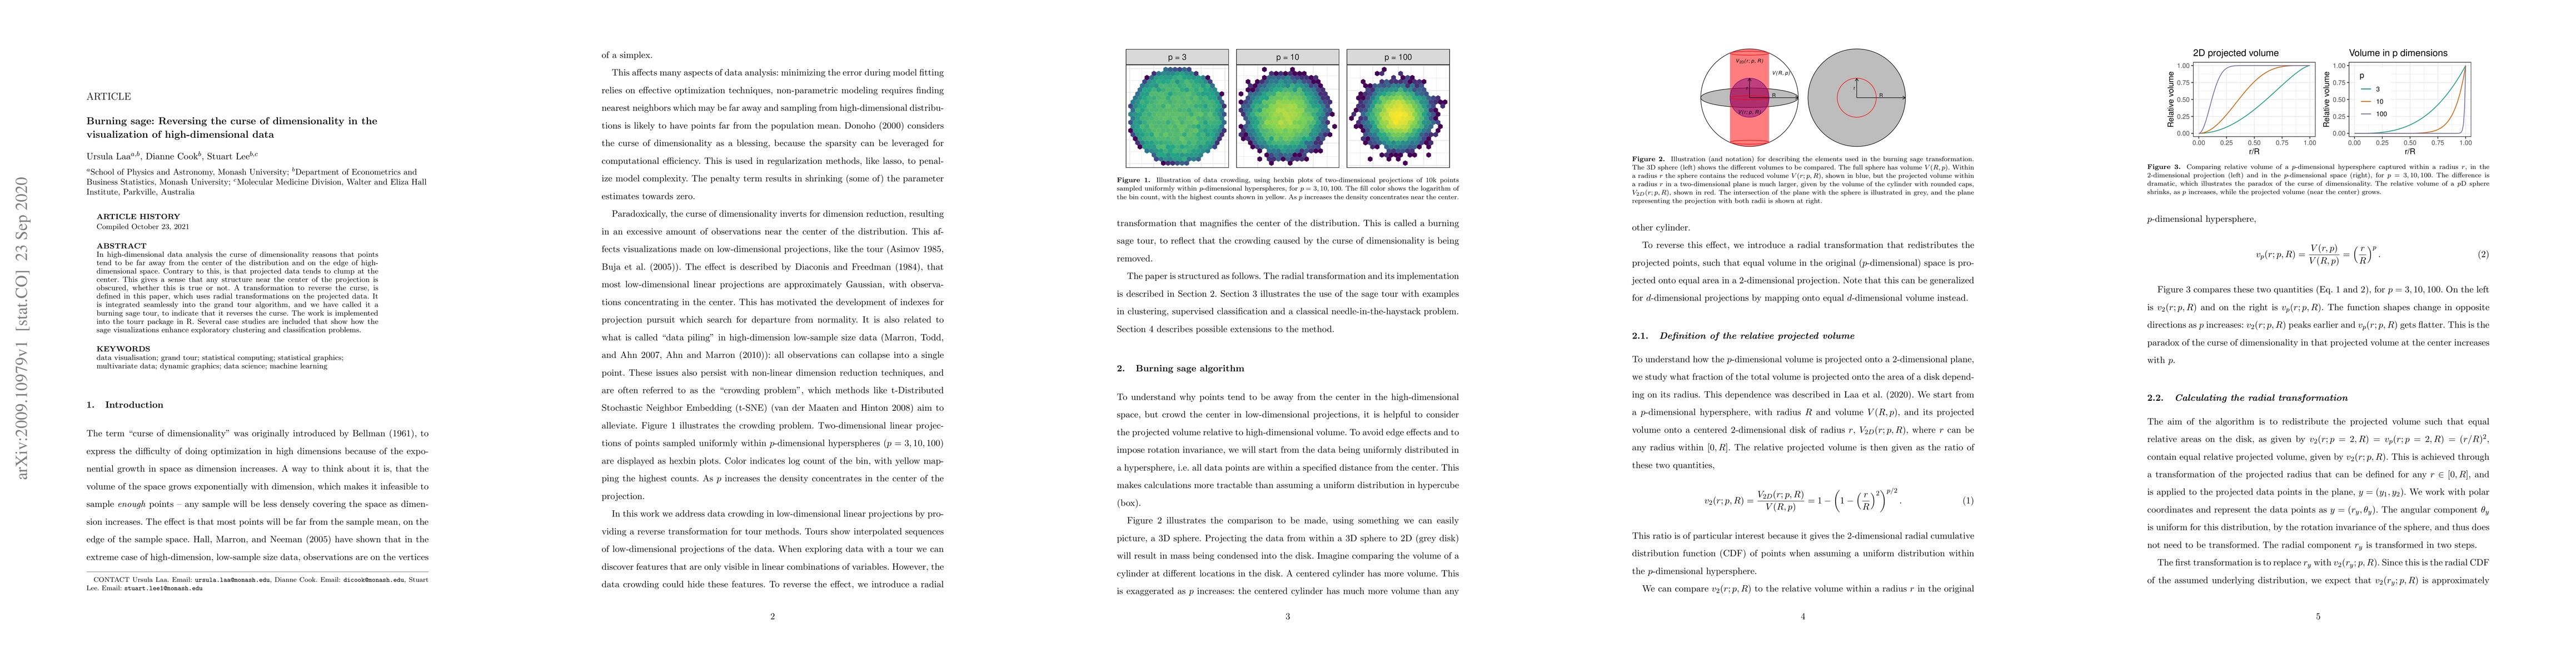
In high-dimensional data analysis the curse of dimensionality reasons that points tend to be far away from the center of the distribution and on the edge of high-dimensional space. Contrary to this,...
Multivariate data is often visualized using linear projections, produced by techniques such as principal component analysis, linear discriminant analysis, and projection pursuit. A problem with proj...
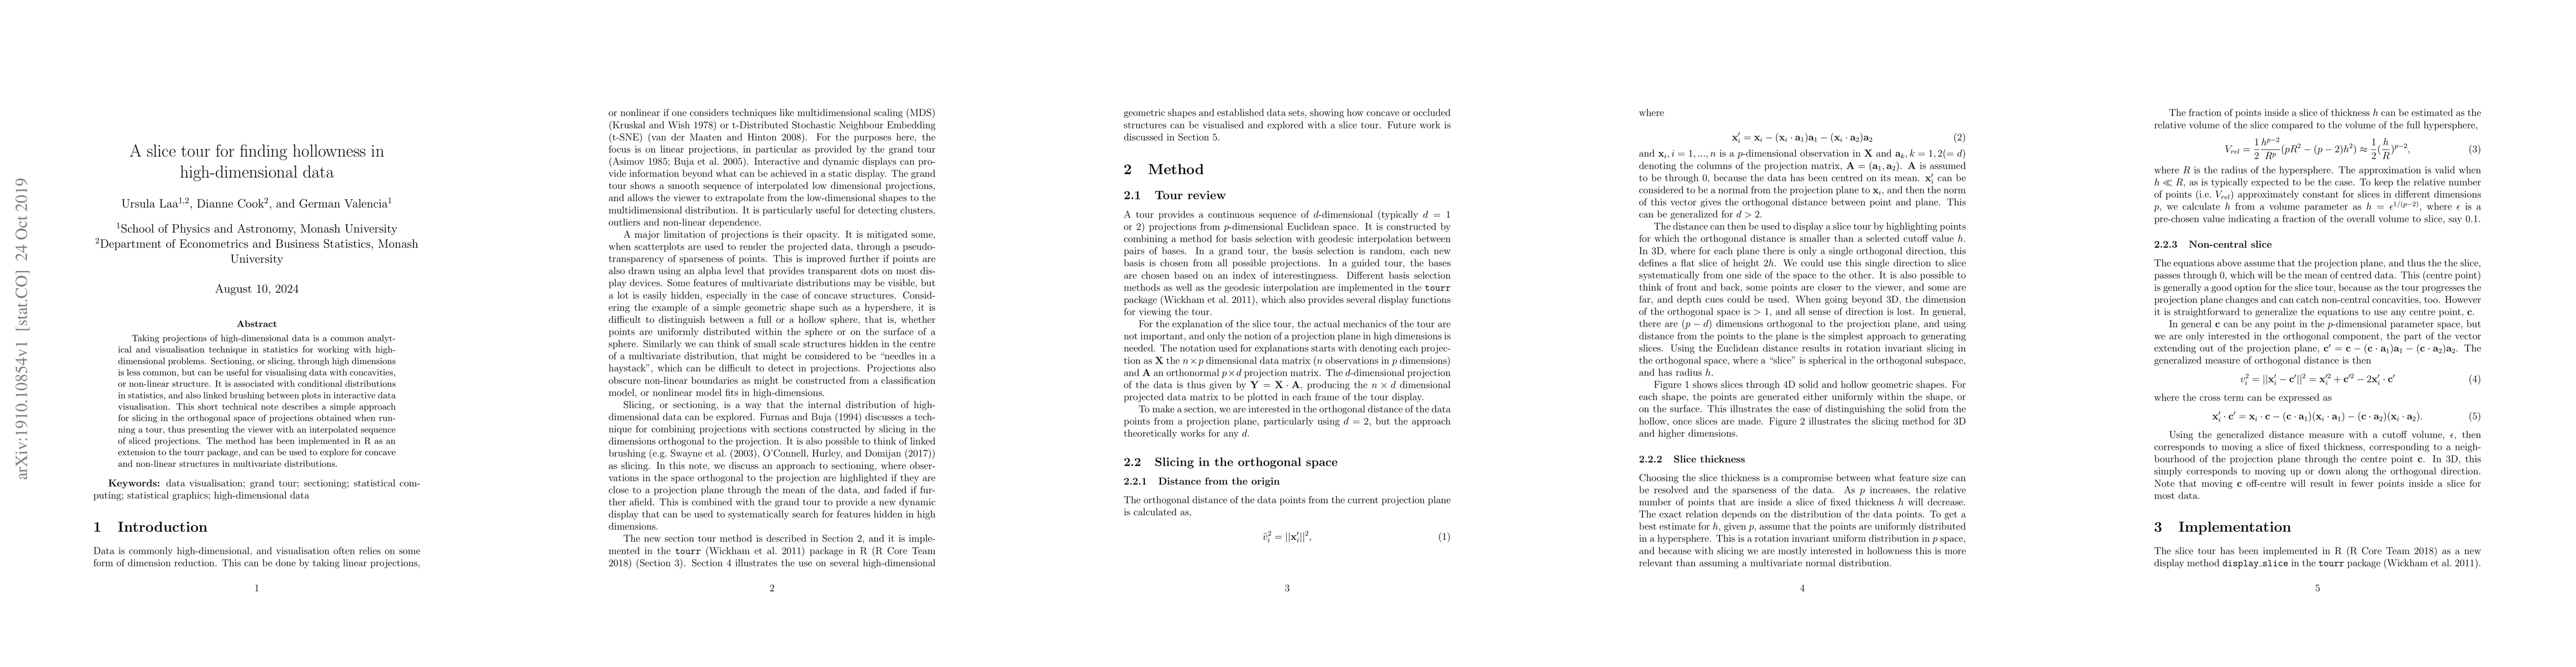
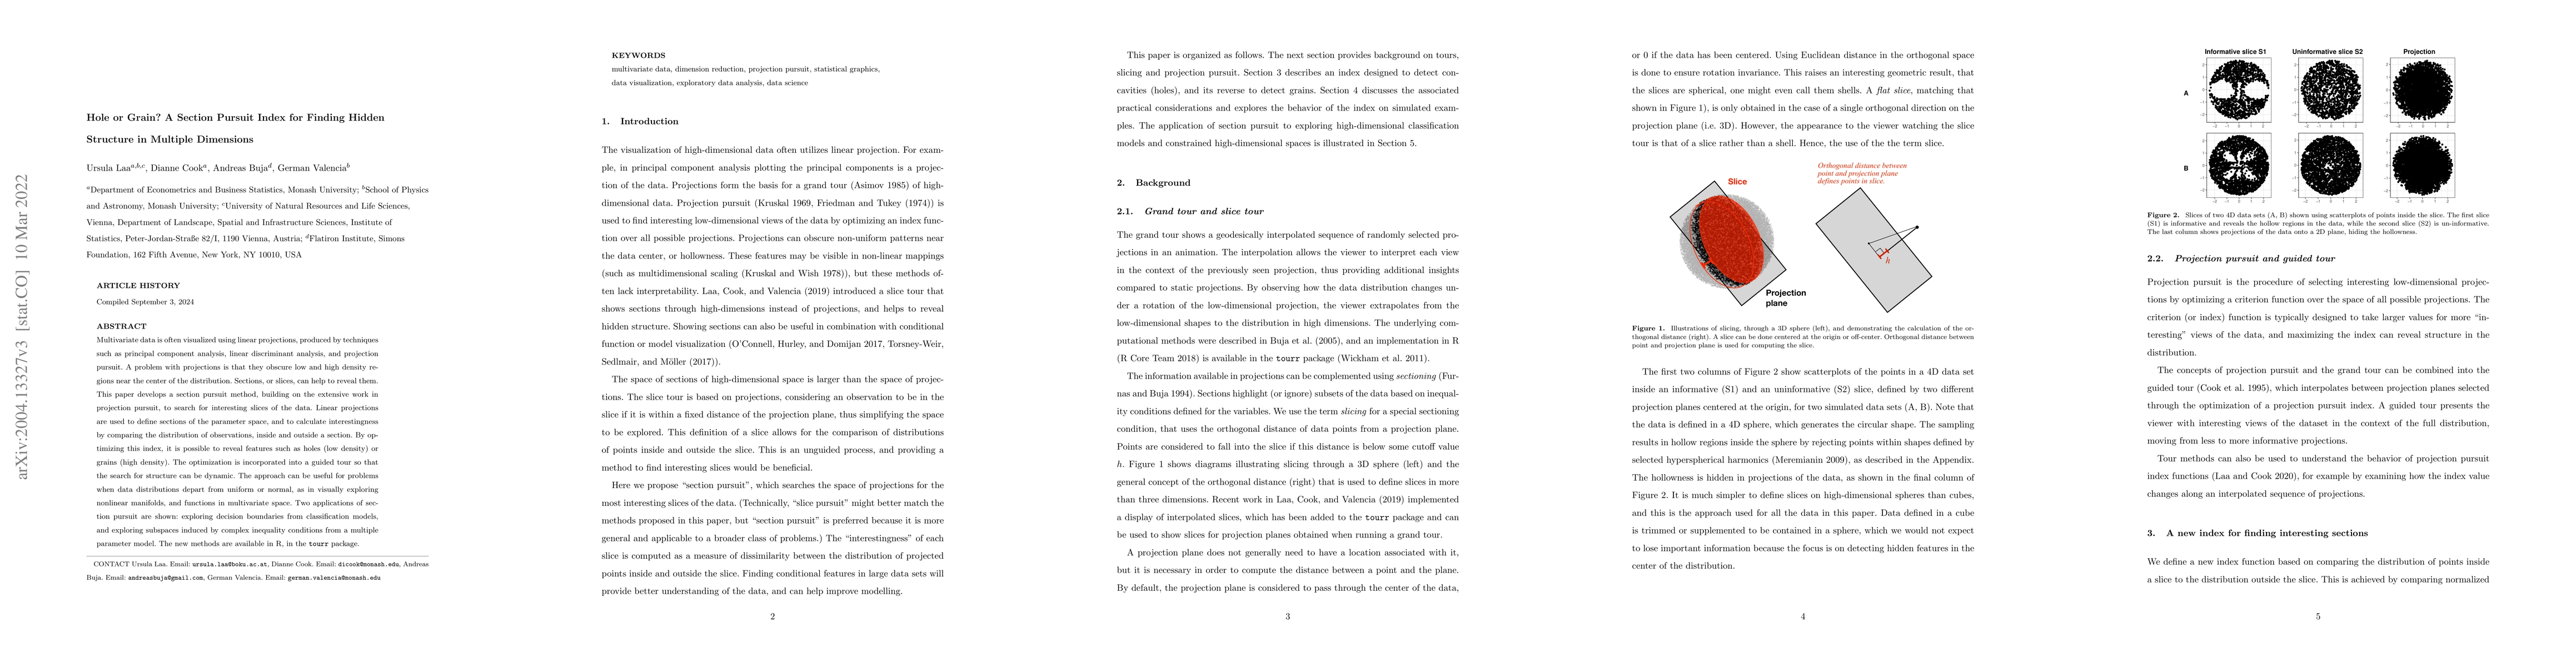
Taking projections of high-dimensional data is a common analytical and visualisation technique in statistics for working with high-dimensional problems. Sectioning, or slicing, through high dimensio...
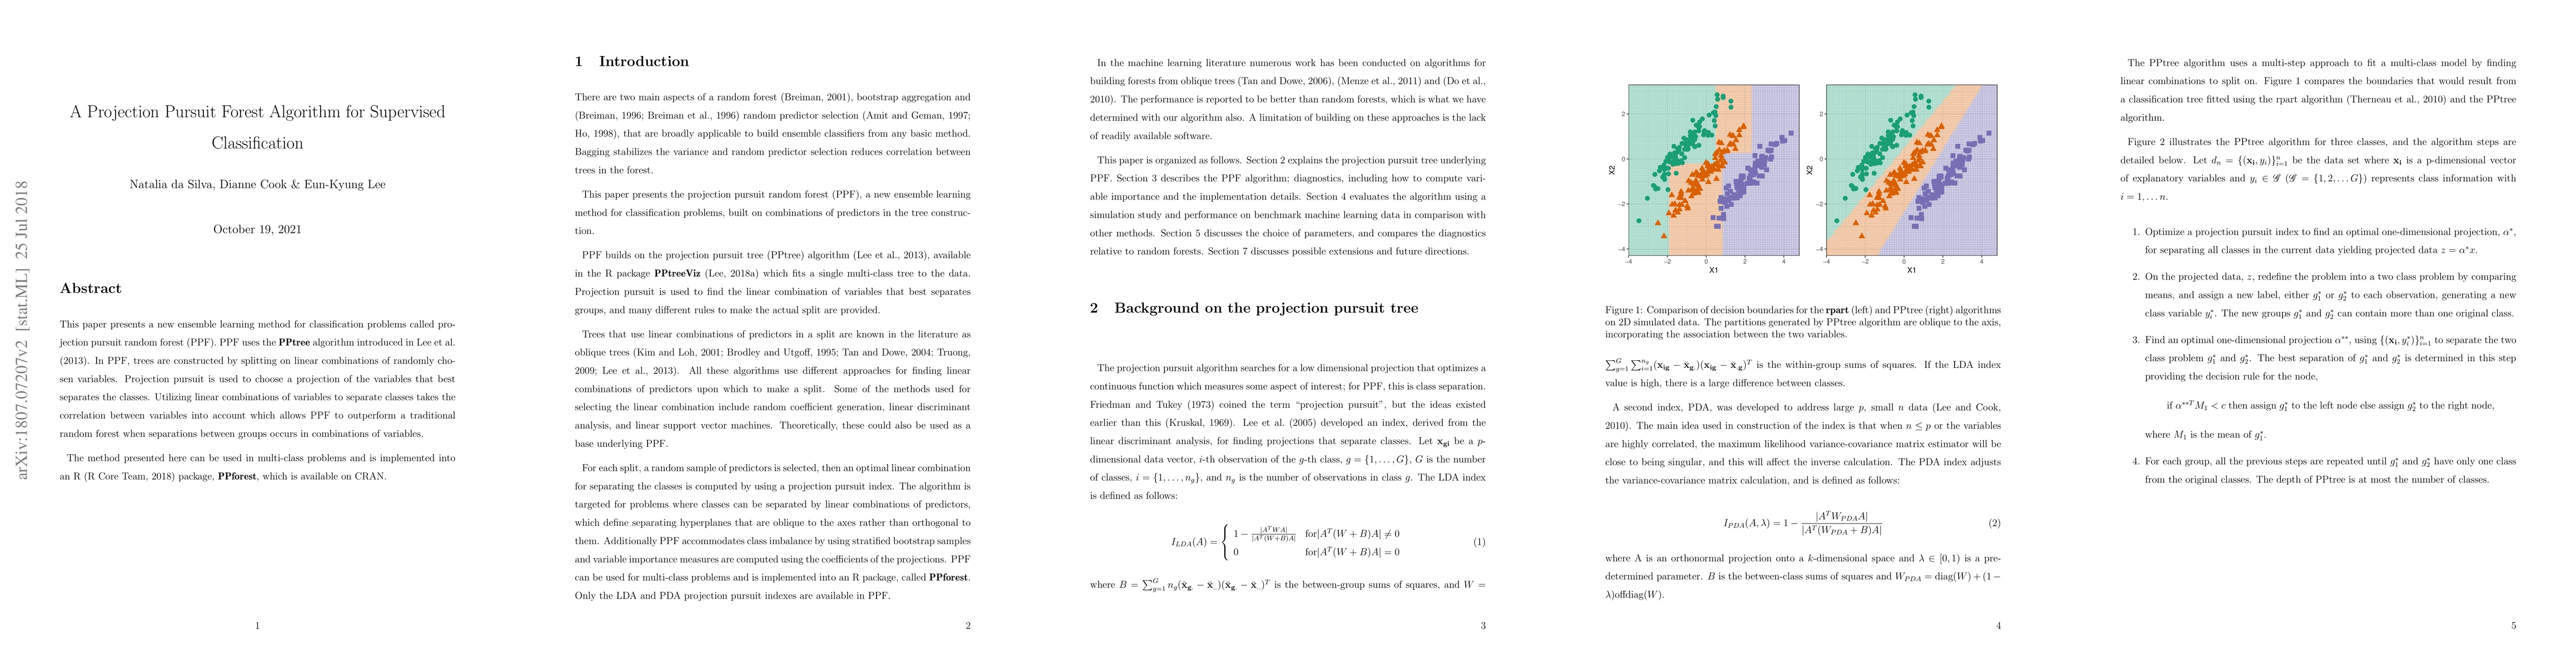
This paper presents a new ensemble learning method for classification problems called projection pursuit random forest (PPF). PPF uses the PPtree algorithm introduced in Lee et al. (2013). In PPF, t...
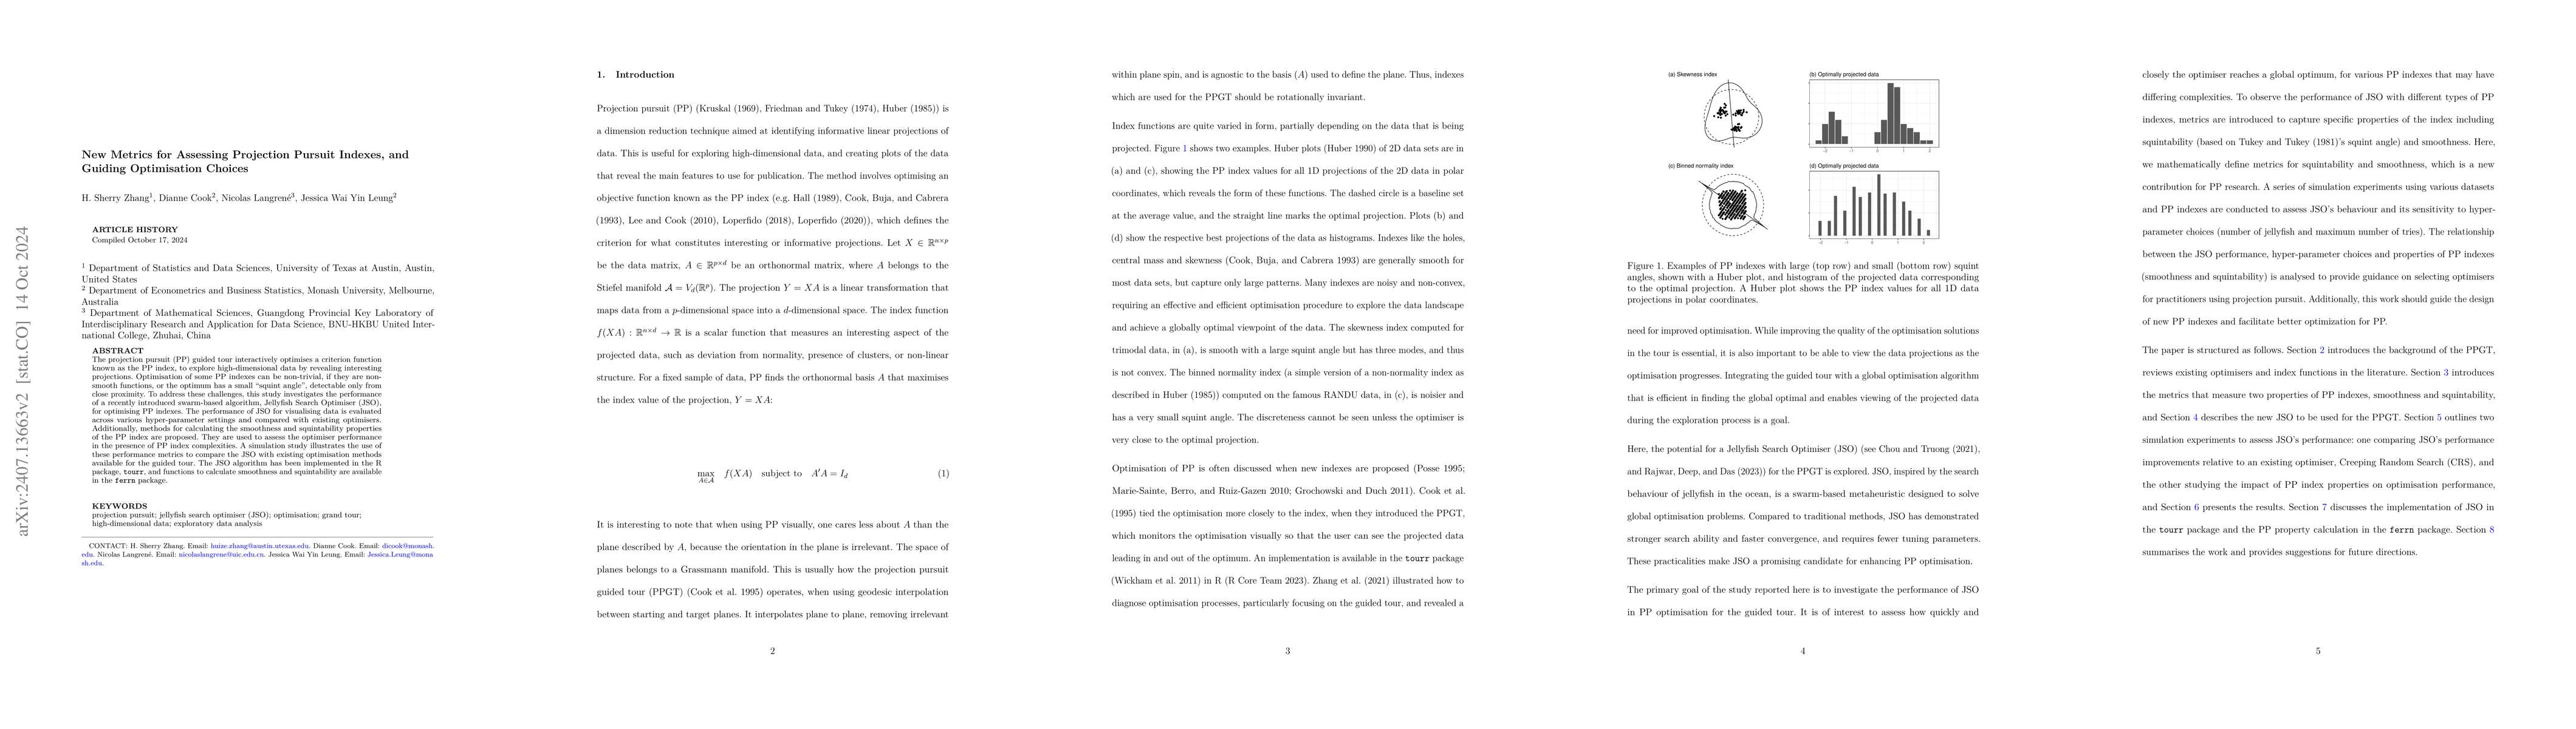
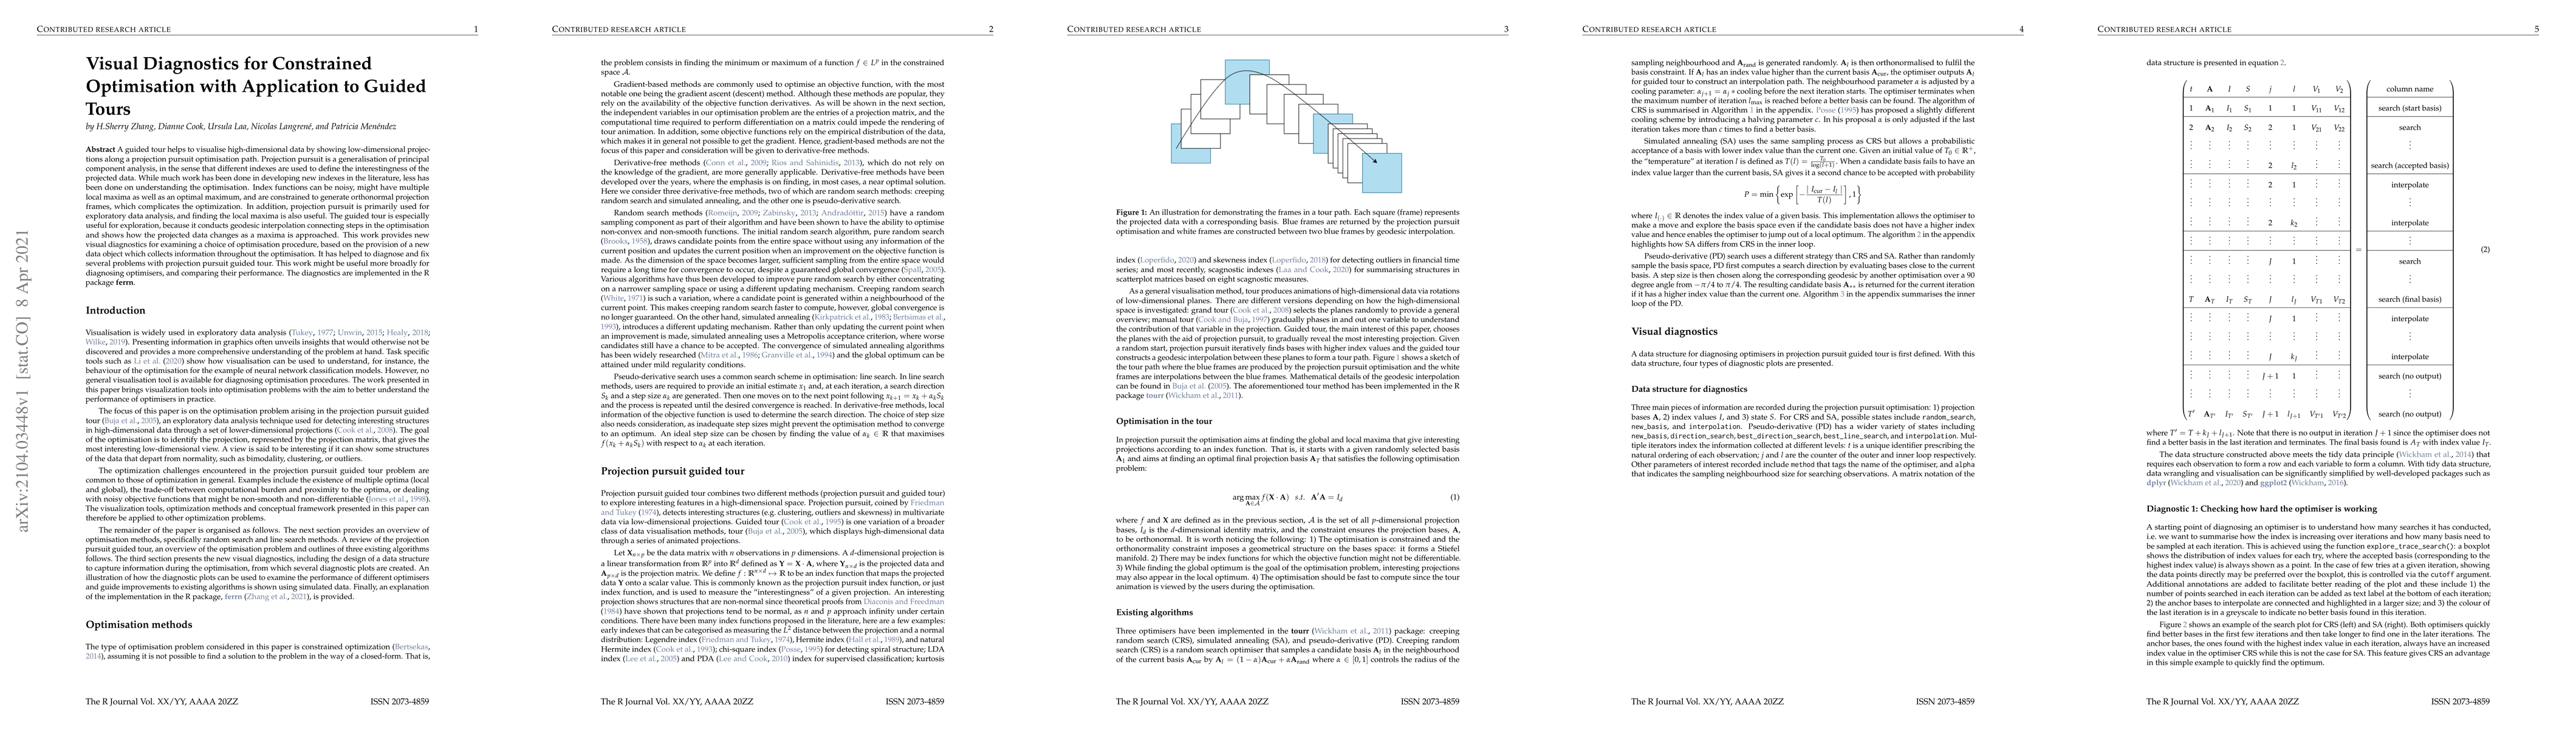
The projection pursuit (PP) guided tour interactively optimises a criteria function known as the PP index, to explore high-dimensional data by revealing interesting projections. The optimisation in PP...
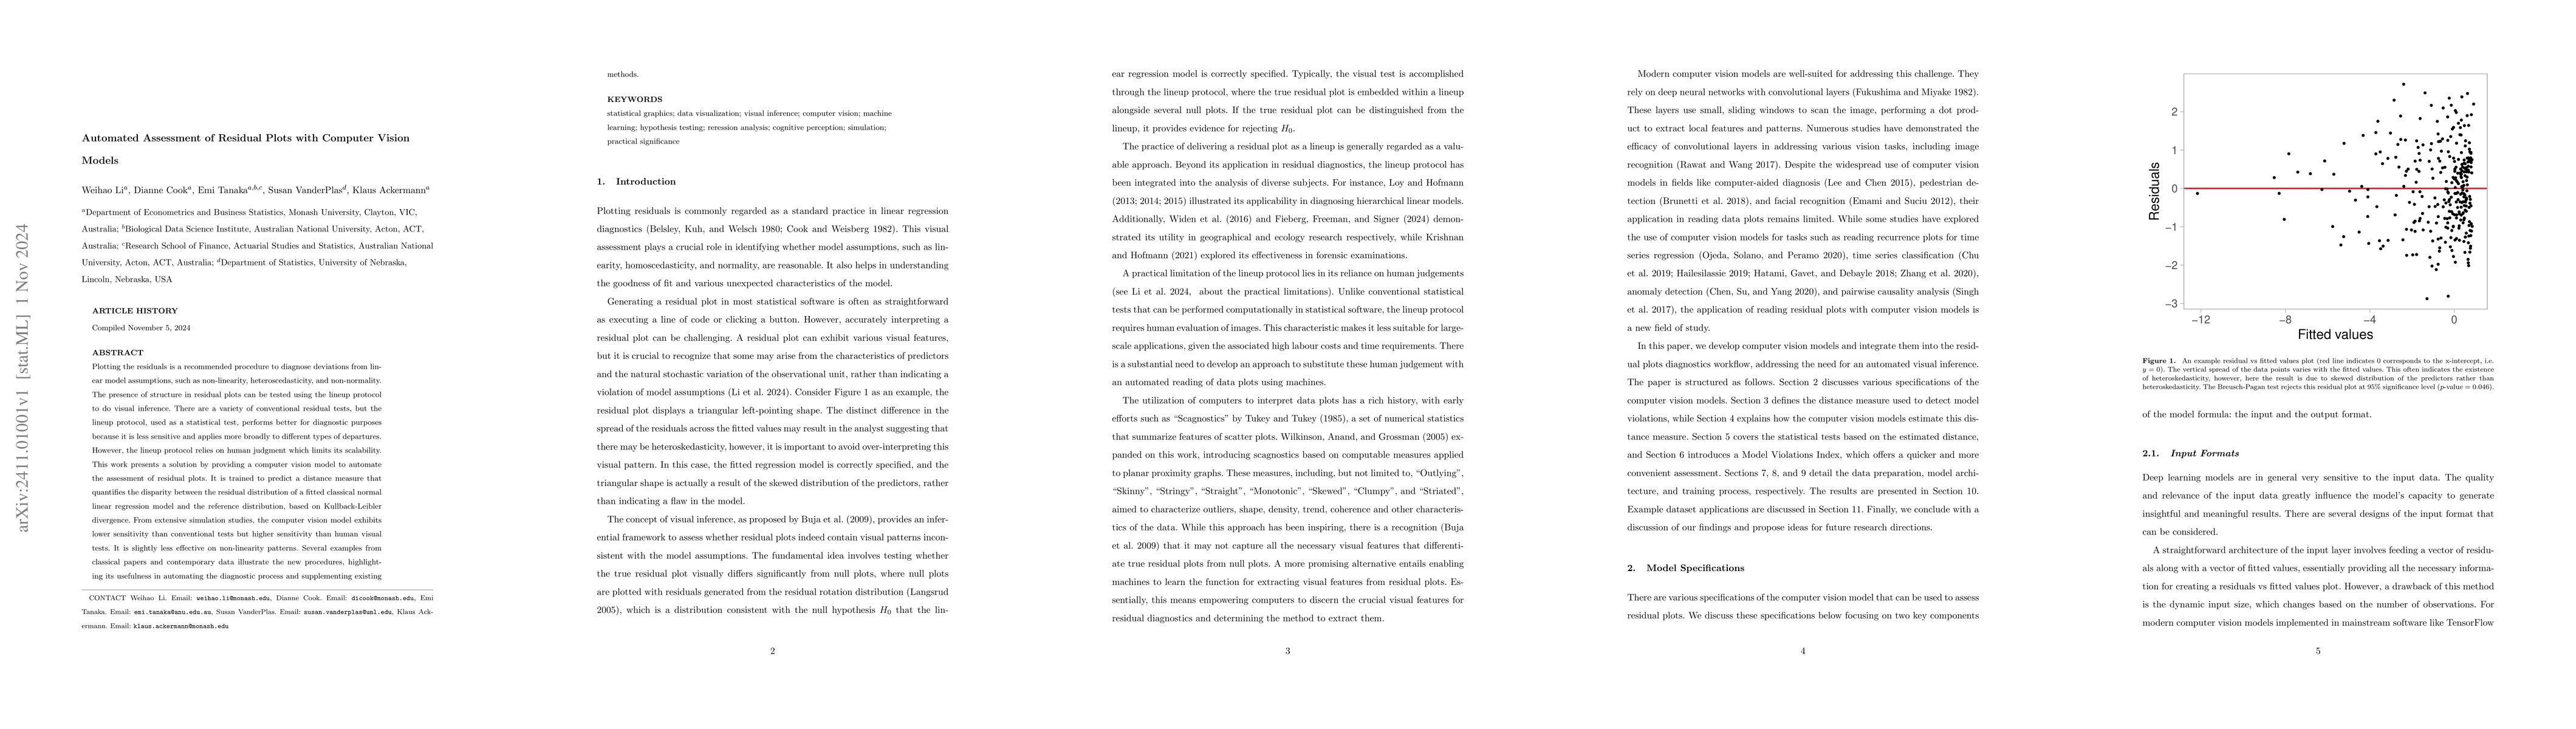
Plotting the residuals is a recommended procedure to diagnose deviations from linear model assumptions, such as non-linearity, heteroscedasticity, and non-normality. The presence of structure in resid...
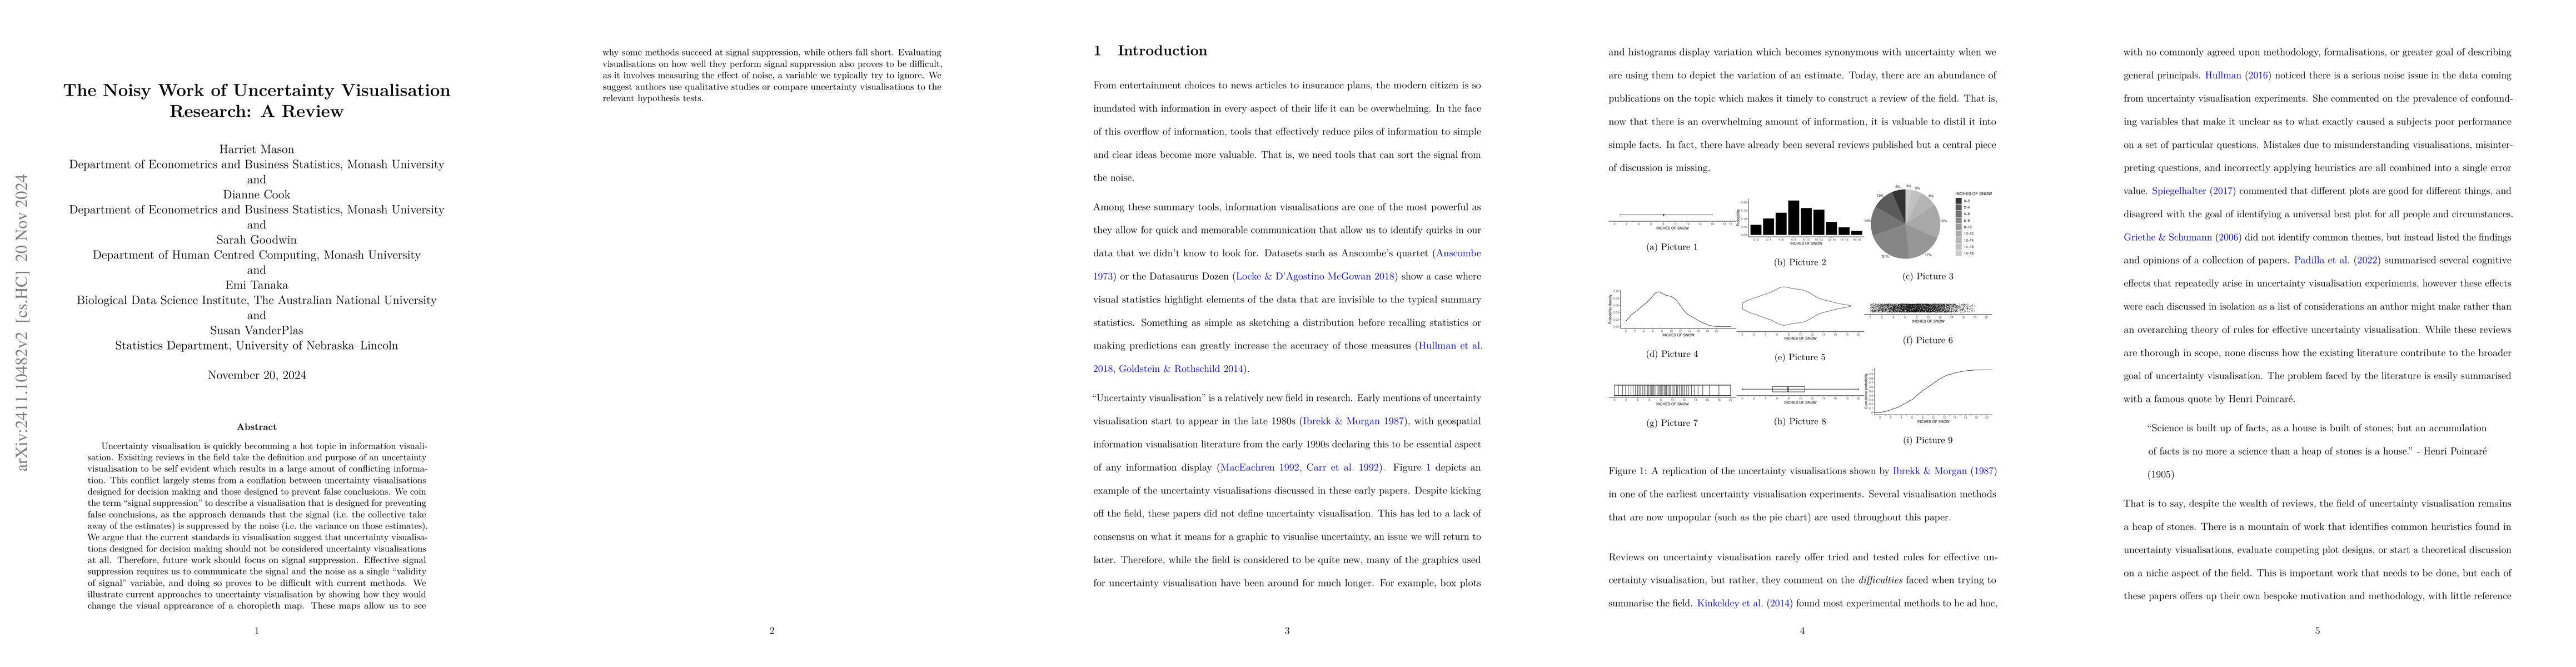
Uncertainty visualisation is quickly becomming a hot topic in information visualisation. Exisiting reviews in the field take the definition and purpose of an uncertainty visualisation to be self evide...
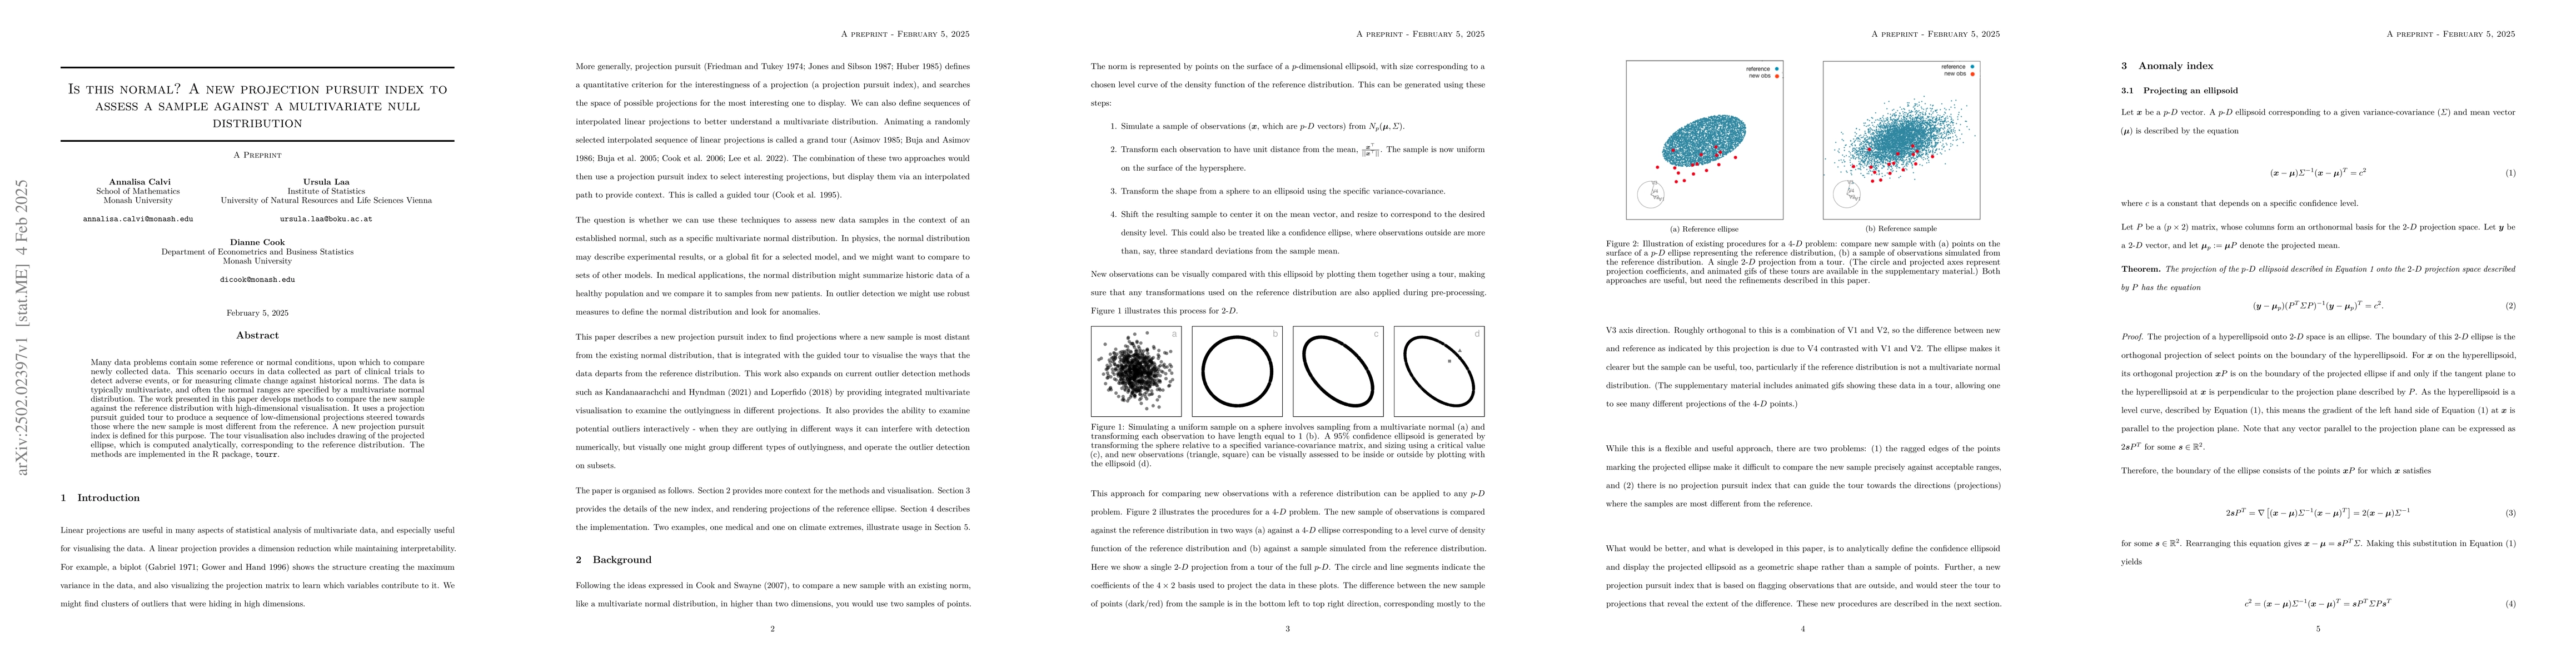
Many data problems contain some reference or normal conditions, upon which to compare newly collected data. This scenario occurs in data collected as part of clinical trials to detect adverse events, ...
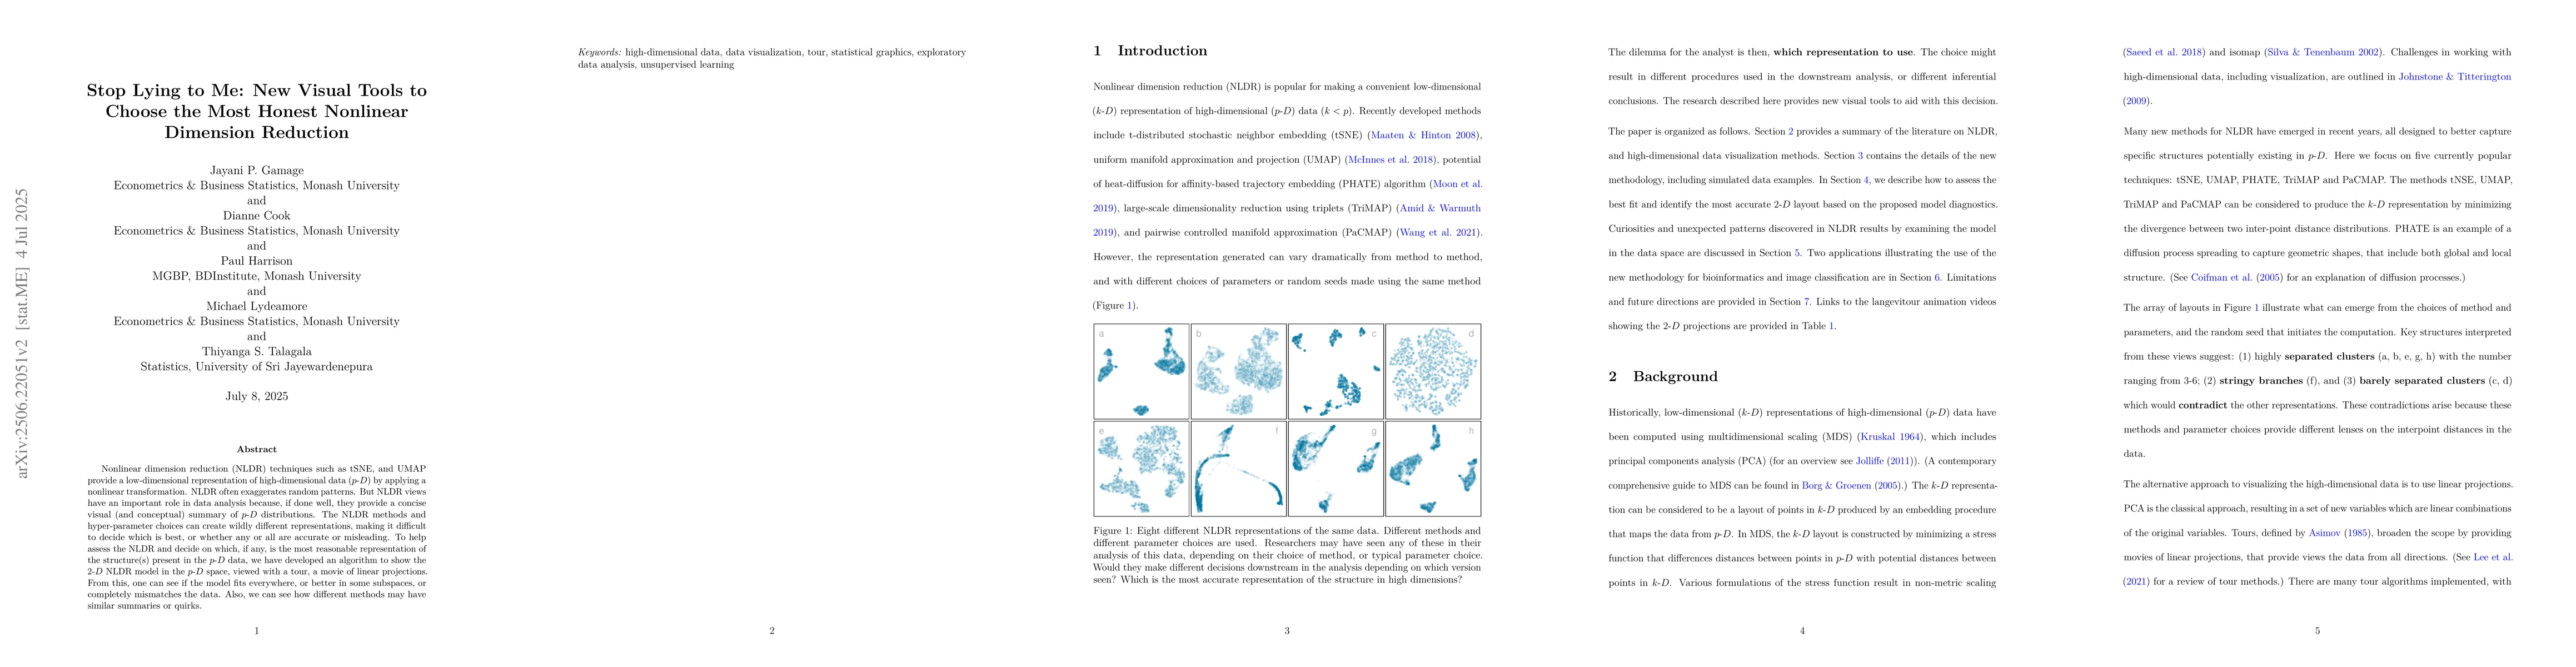
Nonlinear dimension reduction (NLDR) techniques such as tSNE, and UMAP provide a low-dimensional representation of high-dimensional data (\pD{}) by applying a nonlinear transformation. NLDR often exag...
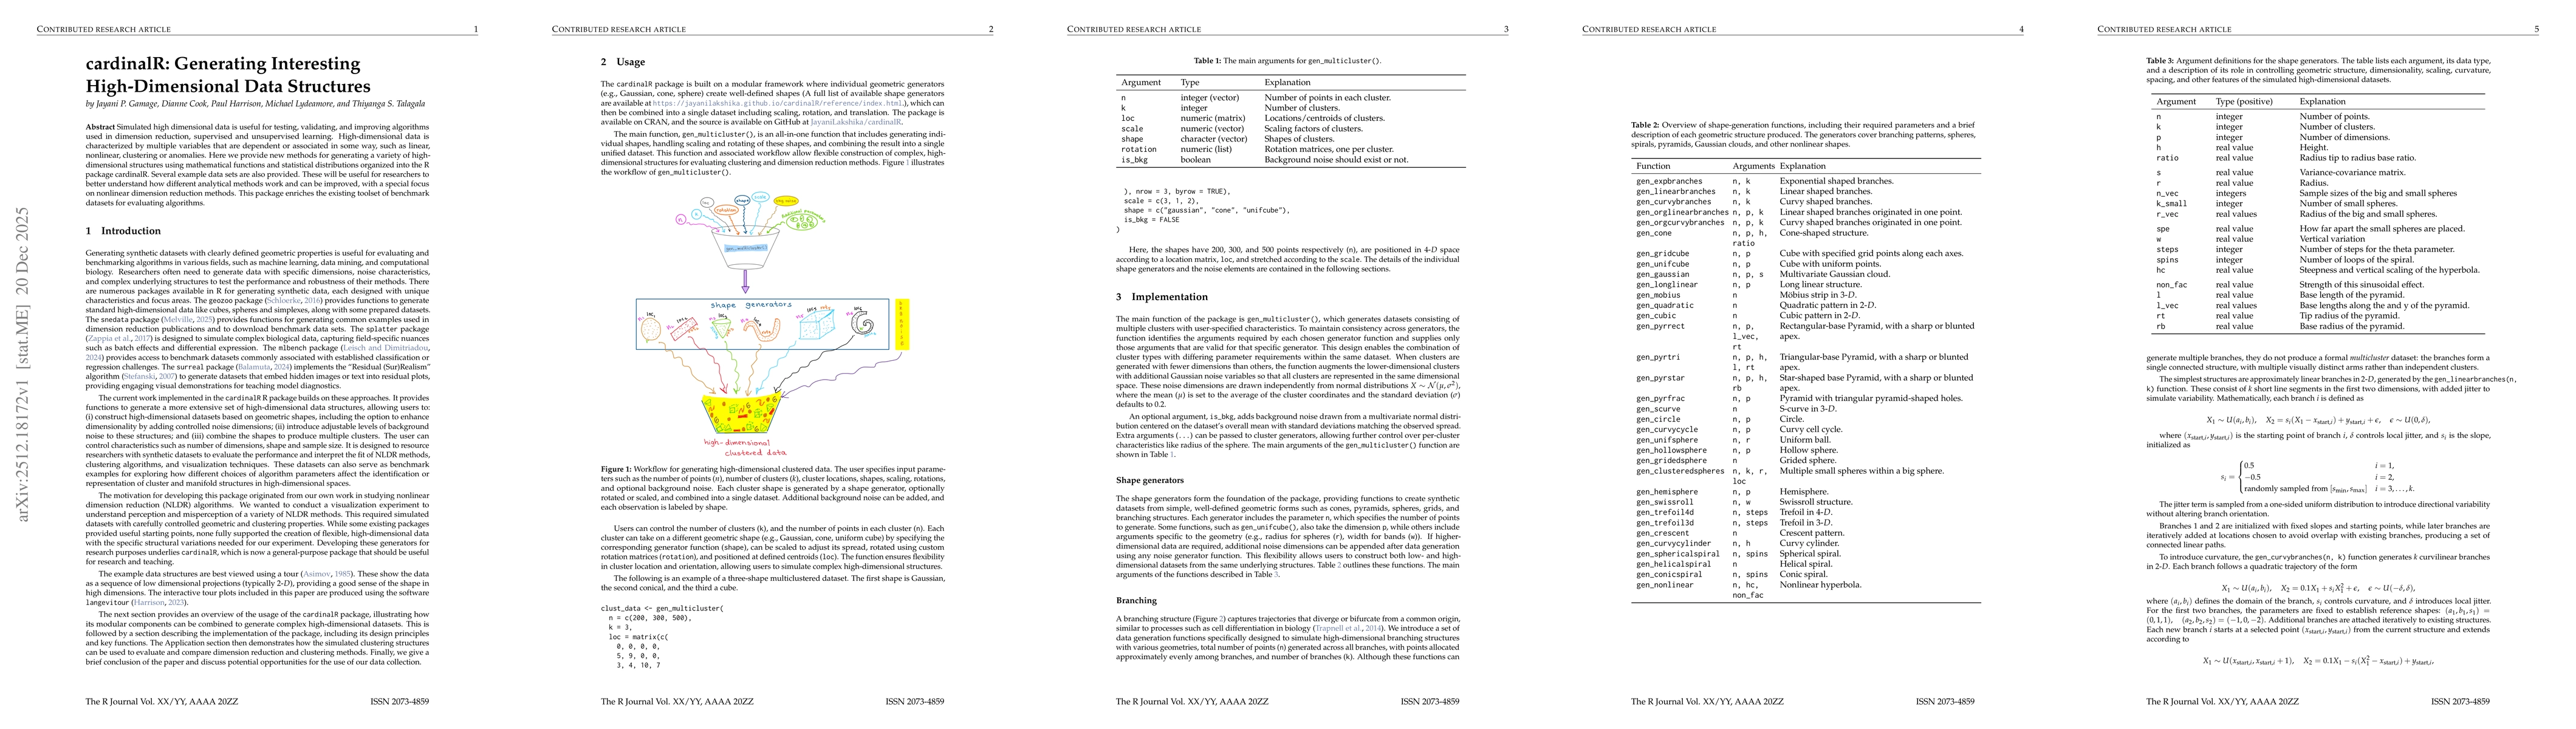
Simulated high-dimensional data is useful for testing, validating, and improving algorithms used in dimension reduction, supervised and unsupervised learning. High-dimensional data is characterized by...
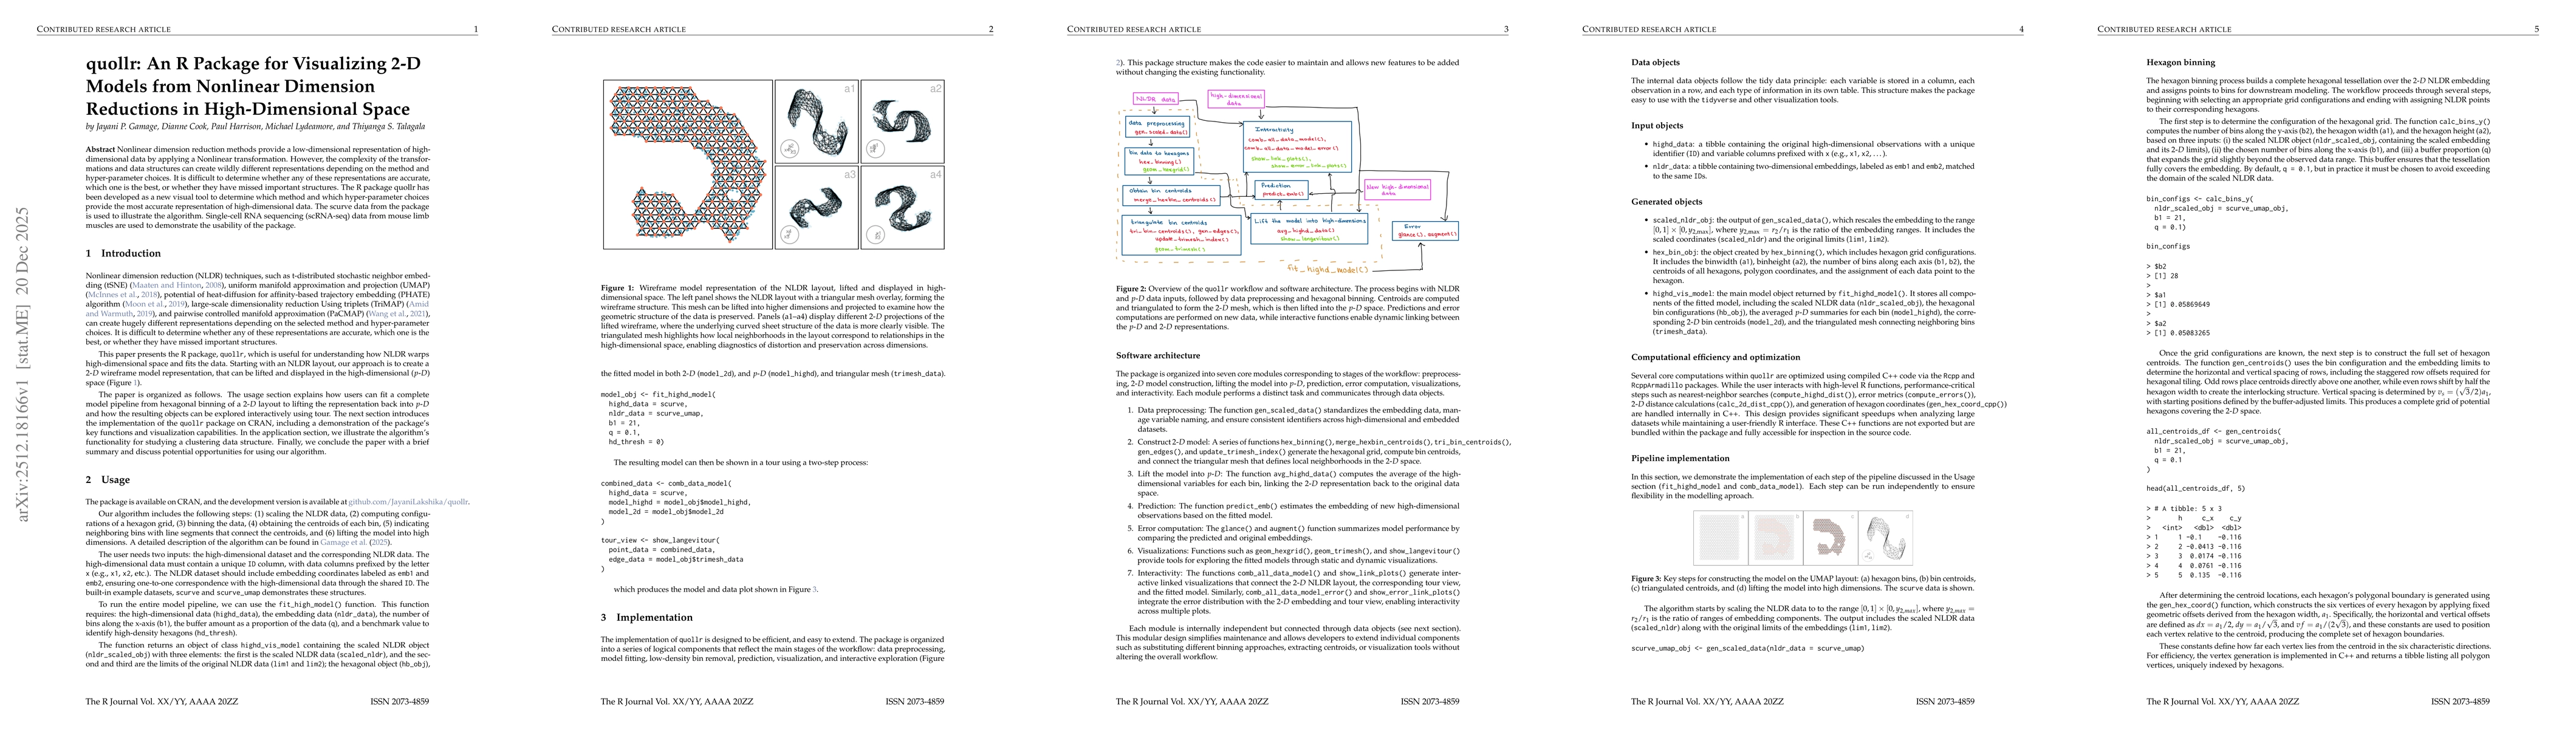
Nonlinear dimension reduction methods provide a low-dimensional representation of high-dimensional data by applying a Nonlinear transformation. However, the complexity of the transformations and data ...
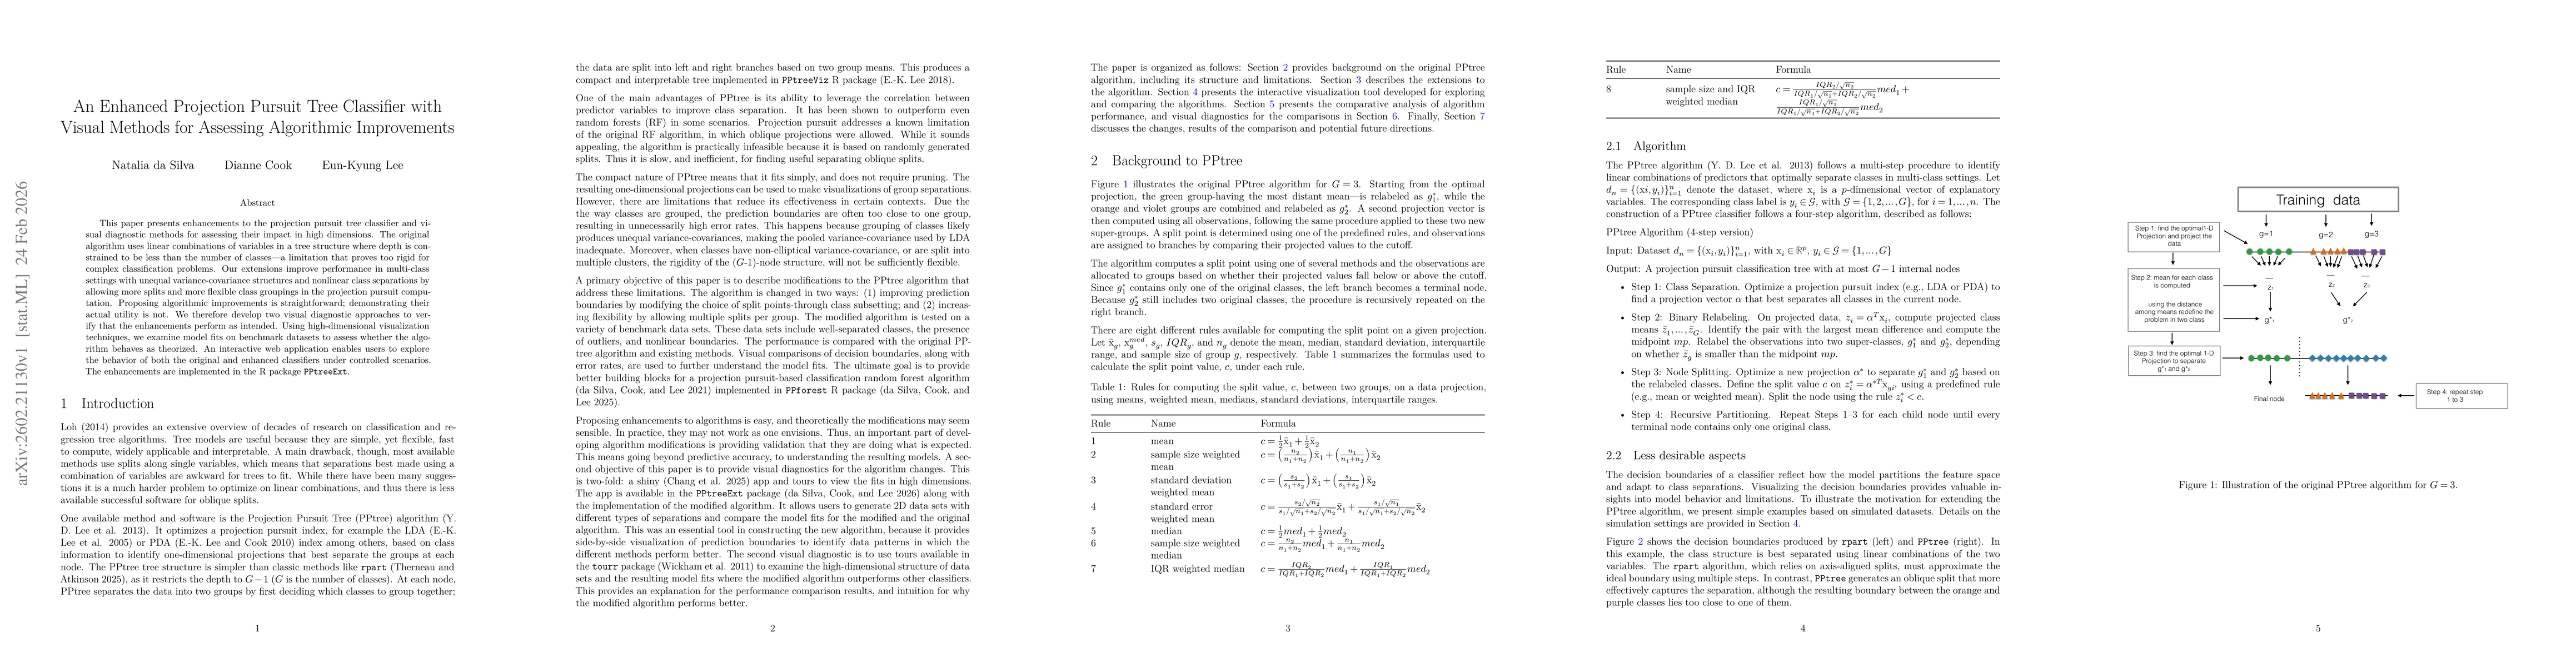
This paper presents enhancements to the projection pursuit tree classifier and visual diagnostic methods for assessing their impact in high dimensions. The original algorithm uses linear combinations ...
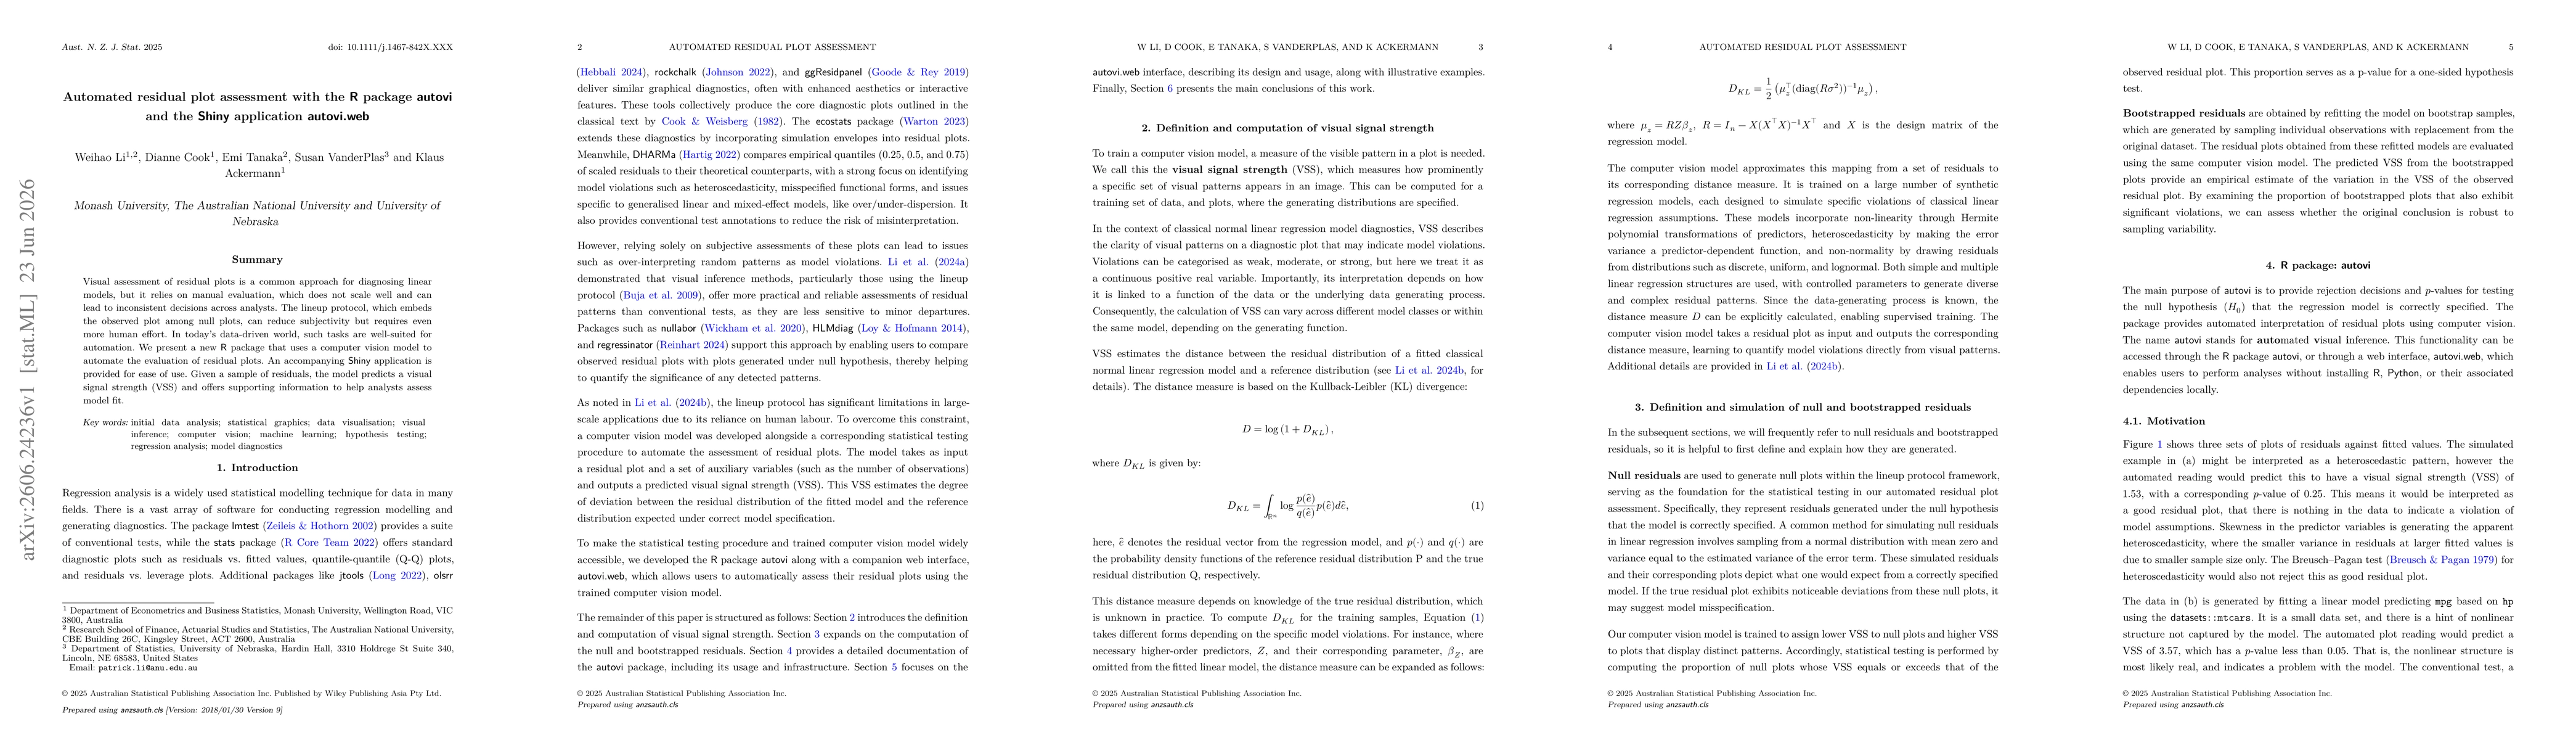
Visual assessment of residual plots is a common approach for diagnosing linear models, but it relies on manual evaluation, which does not scale well and can lead to inconsistent decisions across analy...
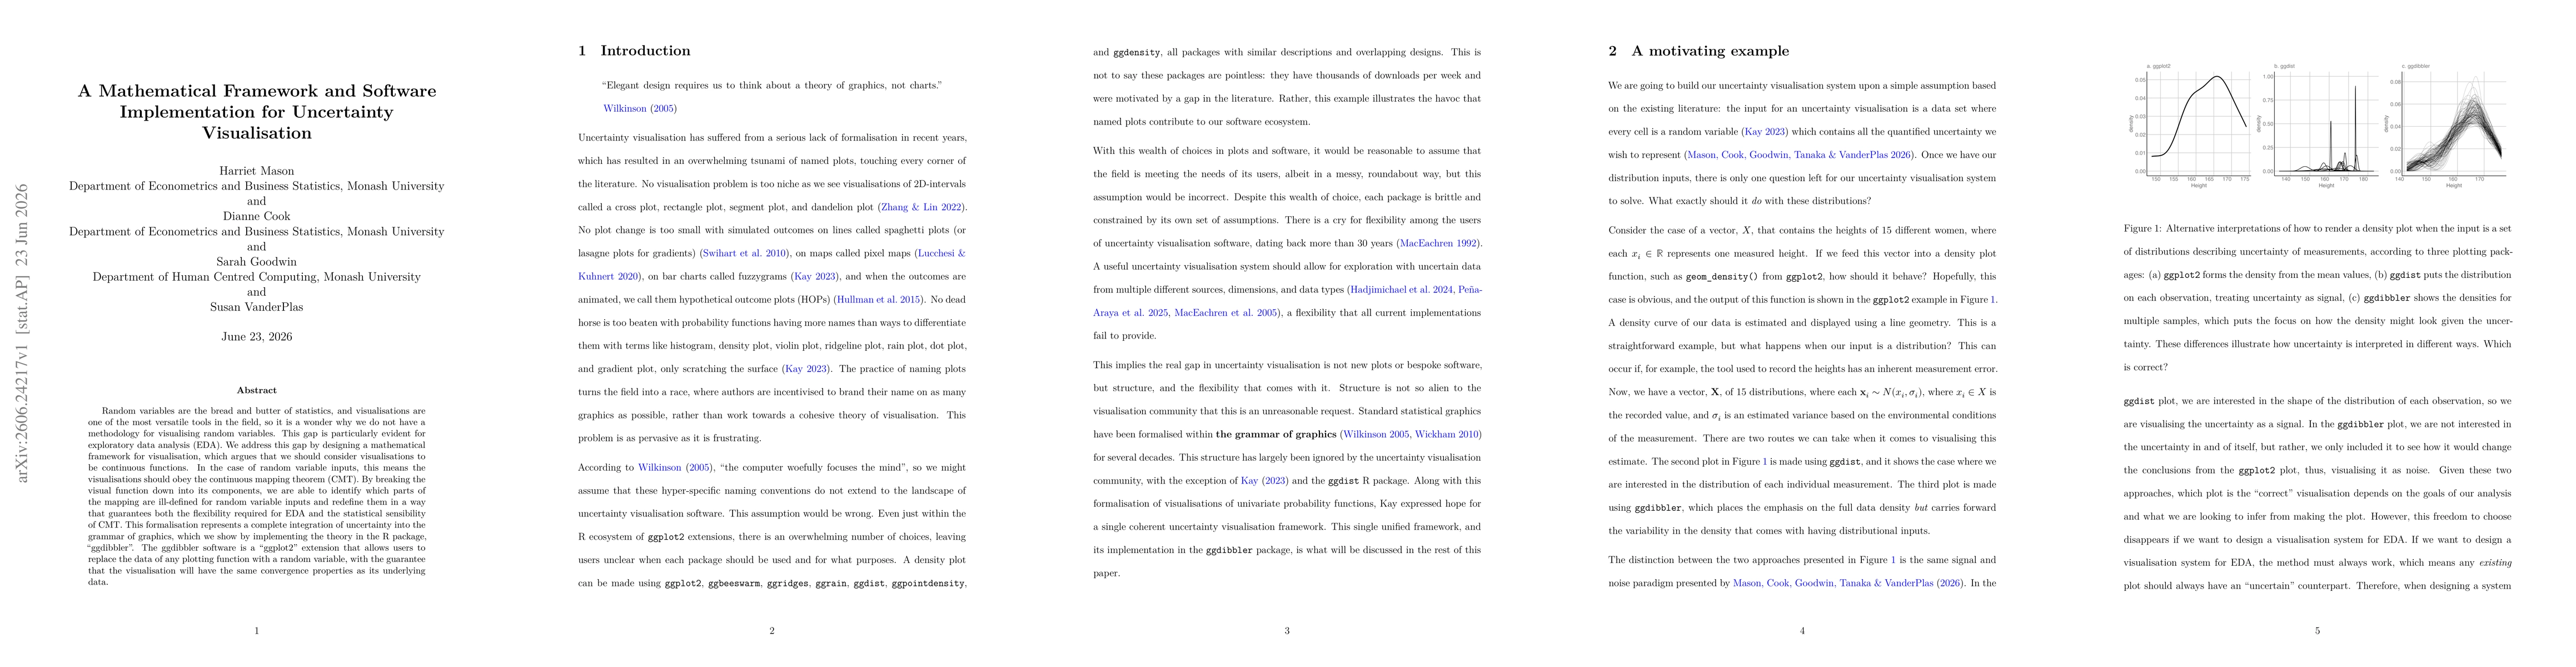
Random variables are the bread and butter of statistics, and visualisations are one of the most versatile tools in the field, so it is a wonder why we do not have a methodology for visualising random ...