Stop Lying to Me: New Visual Tools to Choose the Most Honest Nonlinear Dimension Reduction
Publication
Metrics
Paper Preview
Abstract
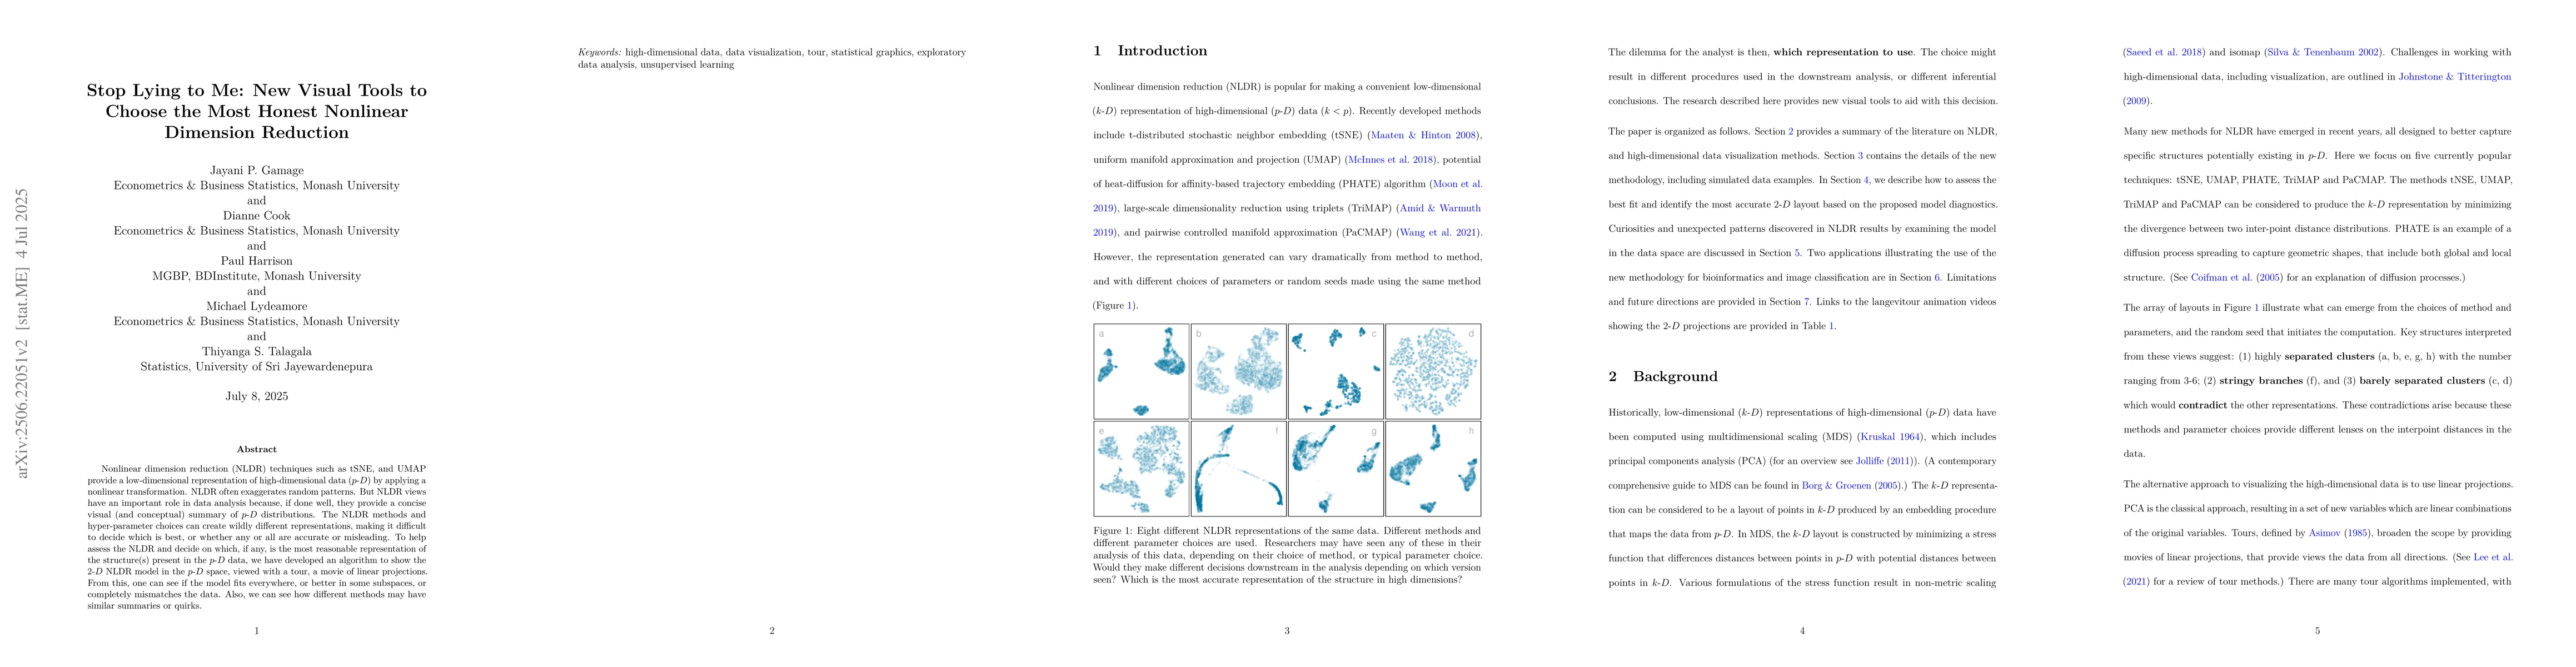
Nonlinear dimension reduction (NLDR) techniques such as tSNE, and UMAP provide a low-dimensional representation of high-dimensional data (\pD{}) by applying a nonlinear transformation. NLDR often exaggerates random patterns. But NLDR views have an important role in data analysis because, if done well, they provide a concise visual (and conceptual) summary of \pD{} distributions. The NLDR methods and hyper-parameter choices can create wildly different representations, making it difficult to decide which is best, or whether any or all are accurate or misleading. To help assess the NLDR and decide on which, if any, is the most reasonable representation of the structure(s) present in the \pD{} data, we have developed an algorithm to show the \gD{} NLDR model in the \pD{} space, viewed with a tour, a movie of linear projections. From this, one can see if the model fits everywhere, or better in some subspaces, or completely mismatches the data. Also, we can see how different methods may have similar summaries or quirks.
AI Key Findings
Get AI-generated insights about this paper's methodology, results, significance, and more — seven facets brought into focus.
Impact
Paper Details
Authors
PDF Preview
Citation Network
Current paper (gray), citations (green), references (blue)
Display is limited for performance on very large graphs.
Discussion 0