A Tidy Framework and Infrastructure to Systematically Assemble Spatio-temporal Indexes from Multivariate Data
Publication
Metrics
AI Quick Summary
This paper proposes a modular data pipeline, called tidyindex, for systematically constructing and evaluating spatio-temporal indexes from multivariate data. The framework allows for flexibility in index design, uncertainty calculation, and robustness assessment, supported by three illustrative examples and an accompanying R package.
Paper Preview
Abstract
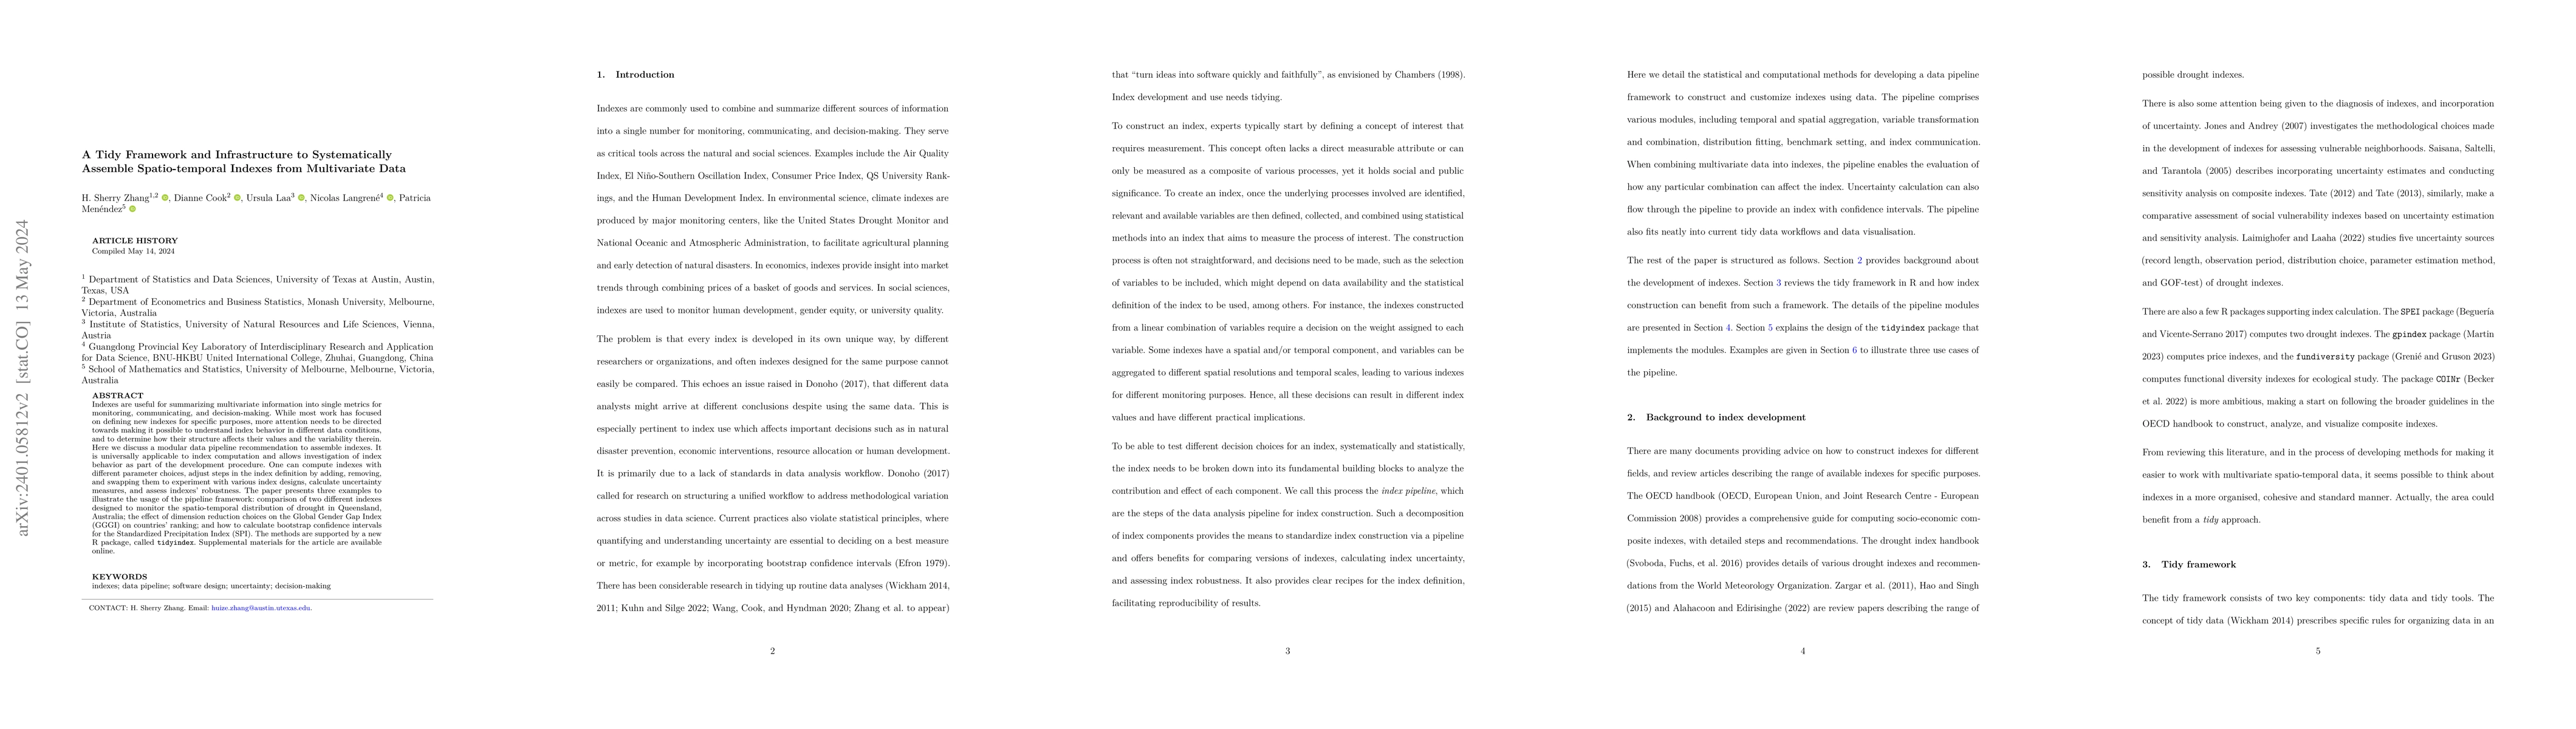
Indexes are useful for summarizing multivariate information into single metrics for monitoring, communicating, and decision-making. While most work has focused on defining new indexes for specific purposes, more attention needs to be directed towards making it possible to understand index behavior in different data conditions, and to determine how their structure affects their values and variation in values. Here we discuss a modular data pipeline recommendation to assemble indexes. It is universally applicable to index computation and allows investigation of index behavior as part of the development procedure. One can compute indexes with different parameter choices, adjust steps in the index definition by adding, removing, and swapping them to experiment with various index designs, calculate uncertainty measures, and assess indexes robustness. The paper presents three examples to illustrate the pipeline framework usage: comparison of two different indexes designed to monitor the spatio-temporal distribution of drought in Queensland, Australia; the effect of dimension reduction choices on the Global Gender Gap Index (GGGI) on countries ranking; and how to calculate bootstrap confidence intervals for the Standardized Precipitation Index (SPI). The methods are supported by a new R package, called tidyindex.
AI Key Findings
Get AI-generated insights about this paper's methodology, results, significance, and more — seven facets brought into focus.
Impact
Paper Details
Authors
PDF Preview
Key Terms
Citation Network
Current paper (gray), citations (green), references (blue)
Display is limited for performance on very large graphs.
Discussion 0