Academic Profile
Statistics
Similar Authors
Papers on arXiv
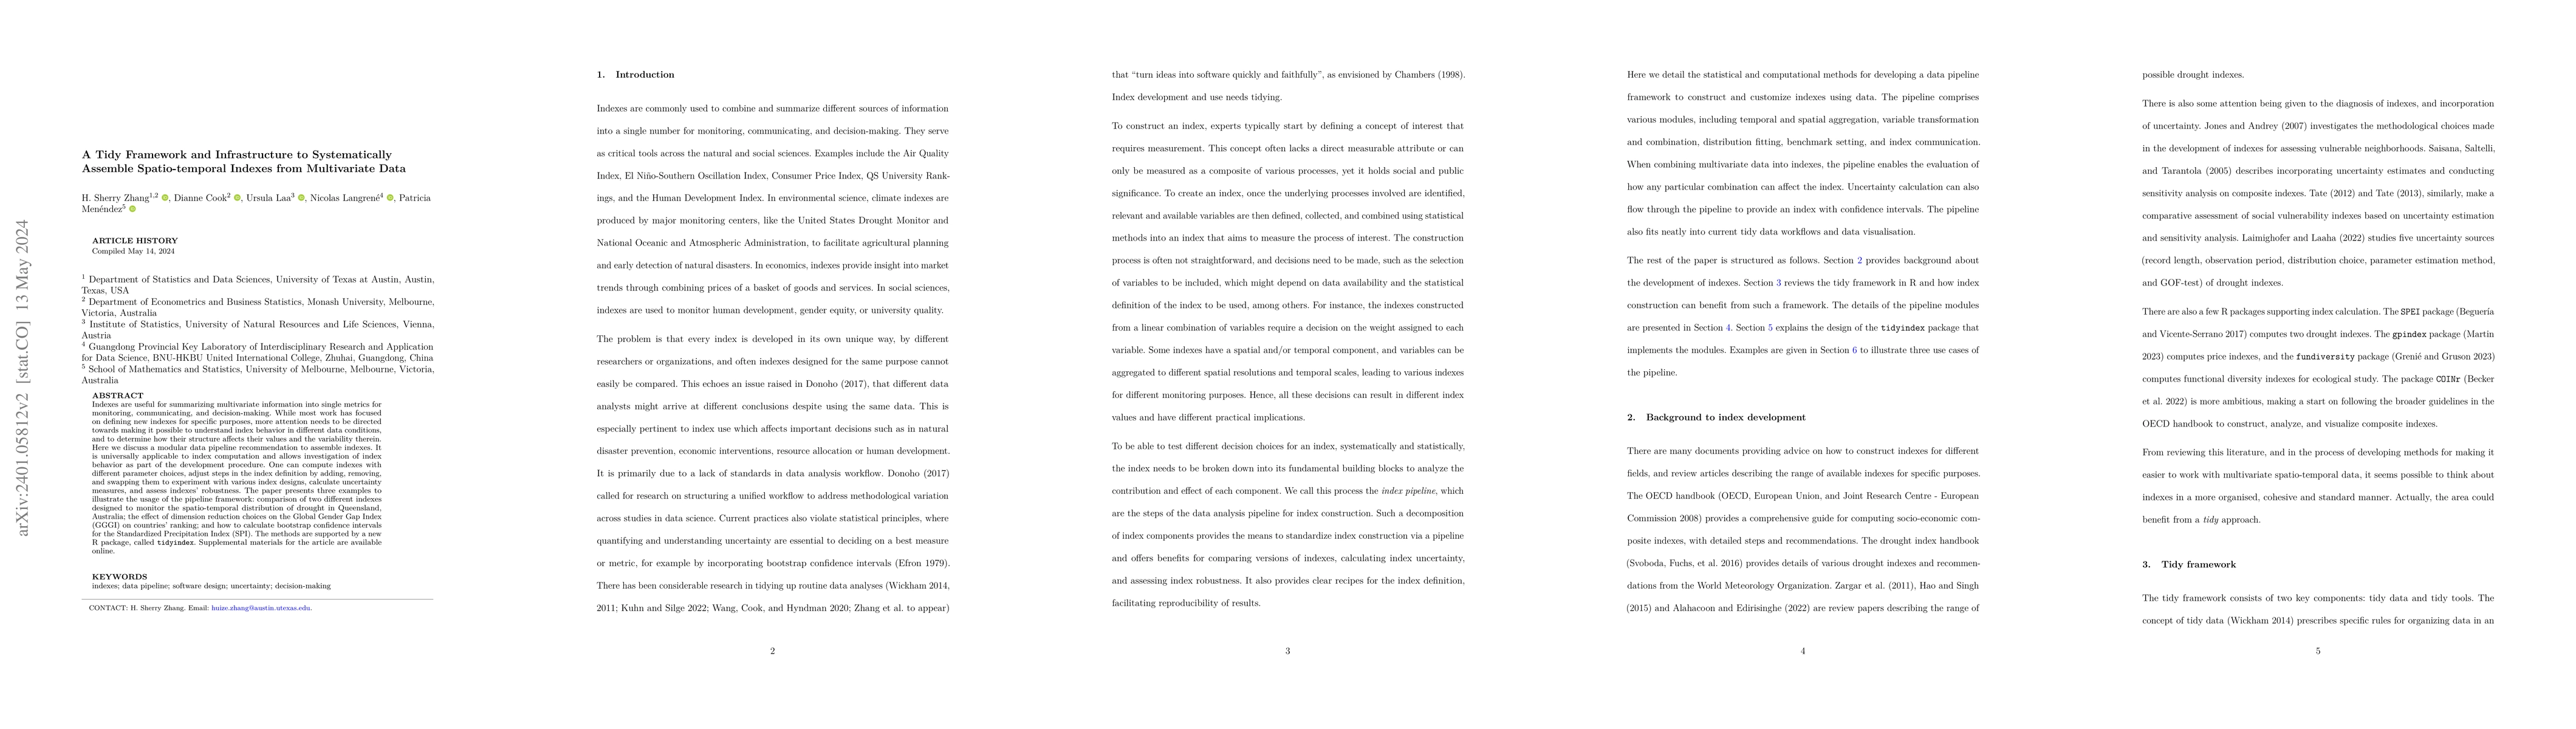
Indexes are useful for summarizing multivariate information into single metrics for monitoring, communicating, and decision-making. While most work has focused on defining new indexes for specific p...
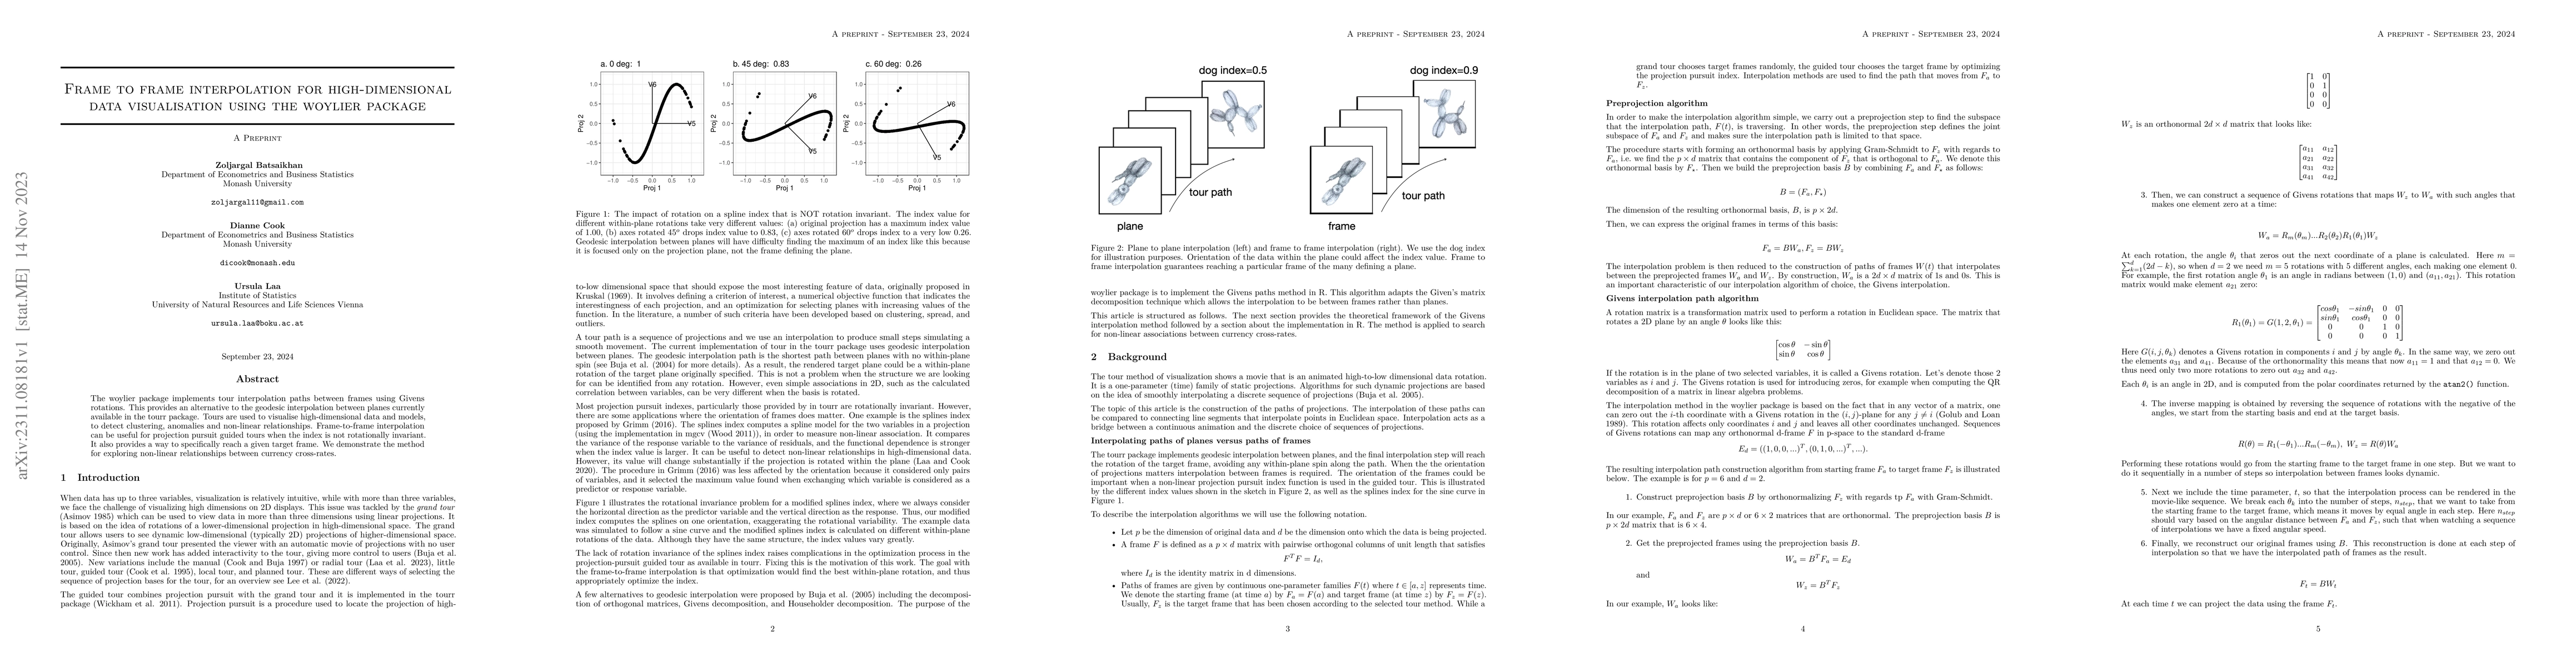
The woylier package implements tour interpolation paths between frames using Givens rotations. This provides an alternative to the geodesic interpolation between planes currently available in the to...
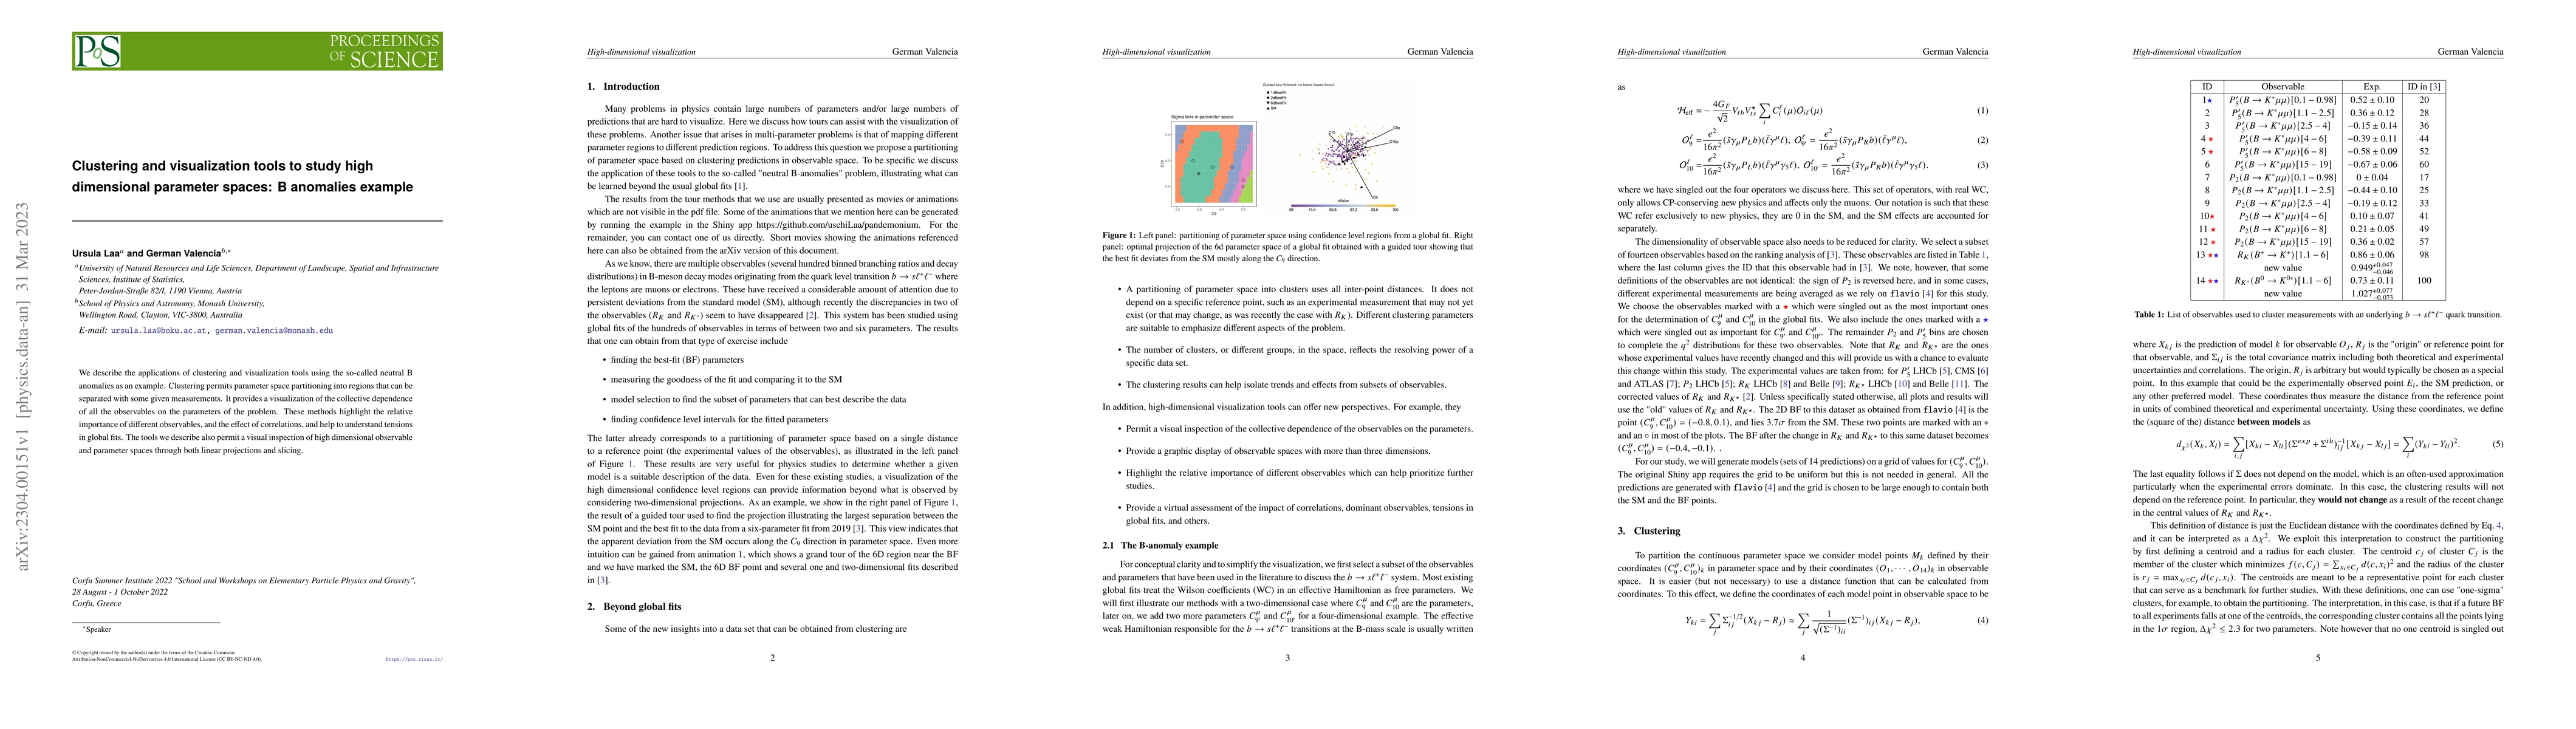
We describe the applications of clustering and visualization tools using the so-called neutral B anomalies as an example. Clustering permits parameter space partitioning into regions that can be sep...
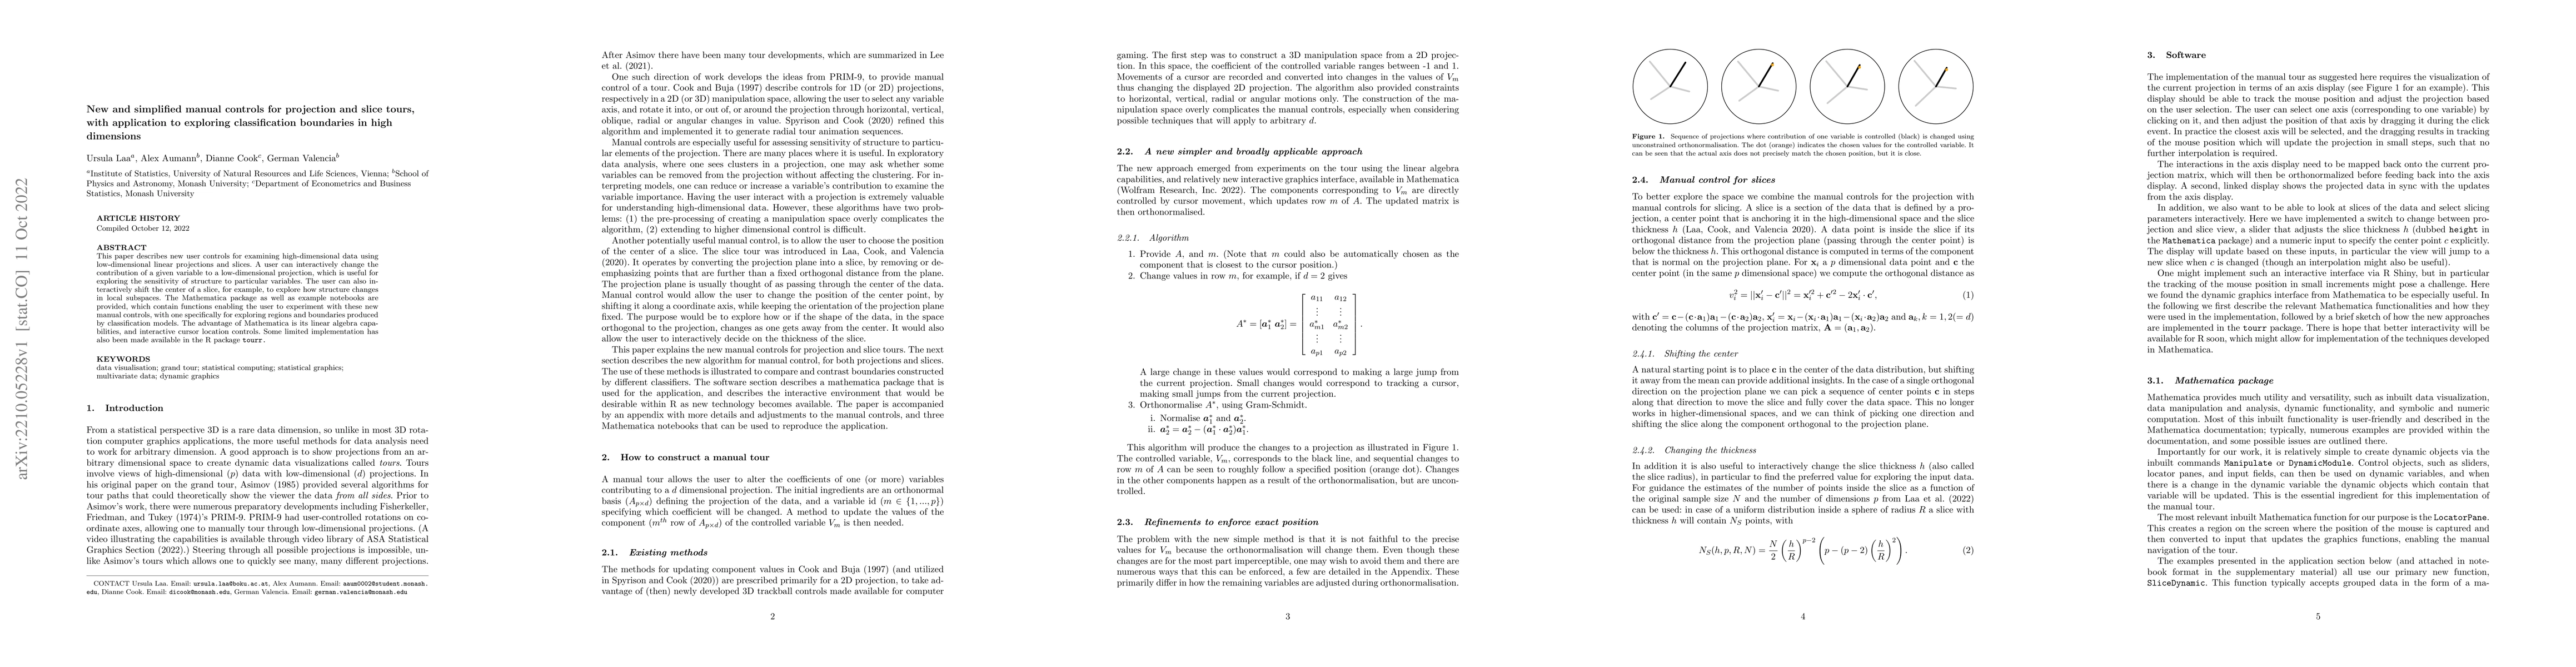
This paper describes new user controls for examining high-dimensional data using low-dimensional linear projections and slices. A user can interactively change the contribution of a given variable t...
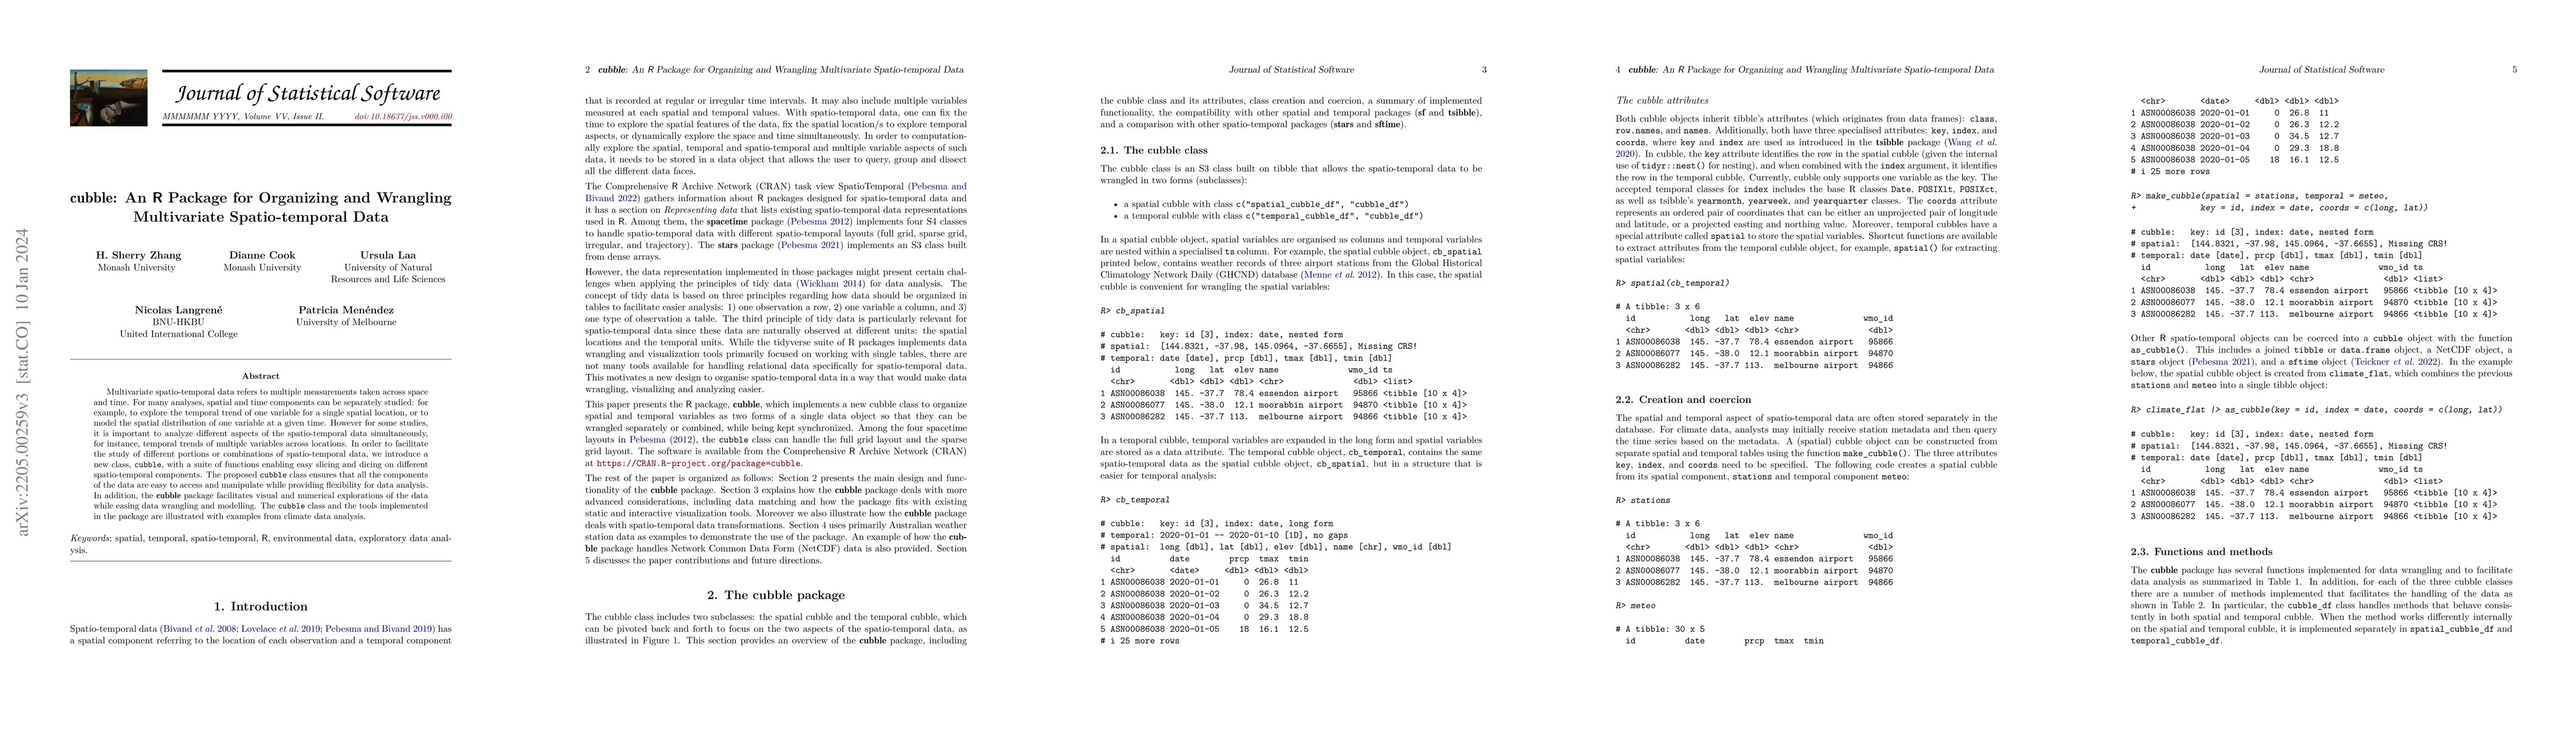
Multivariate spatio-temporal data refers to multiple measurements taken across space and time. For many analyses, spatial and time components can be separately studied: for example, to explore the t...
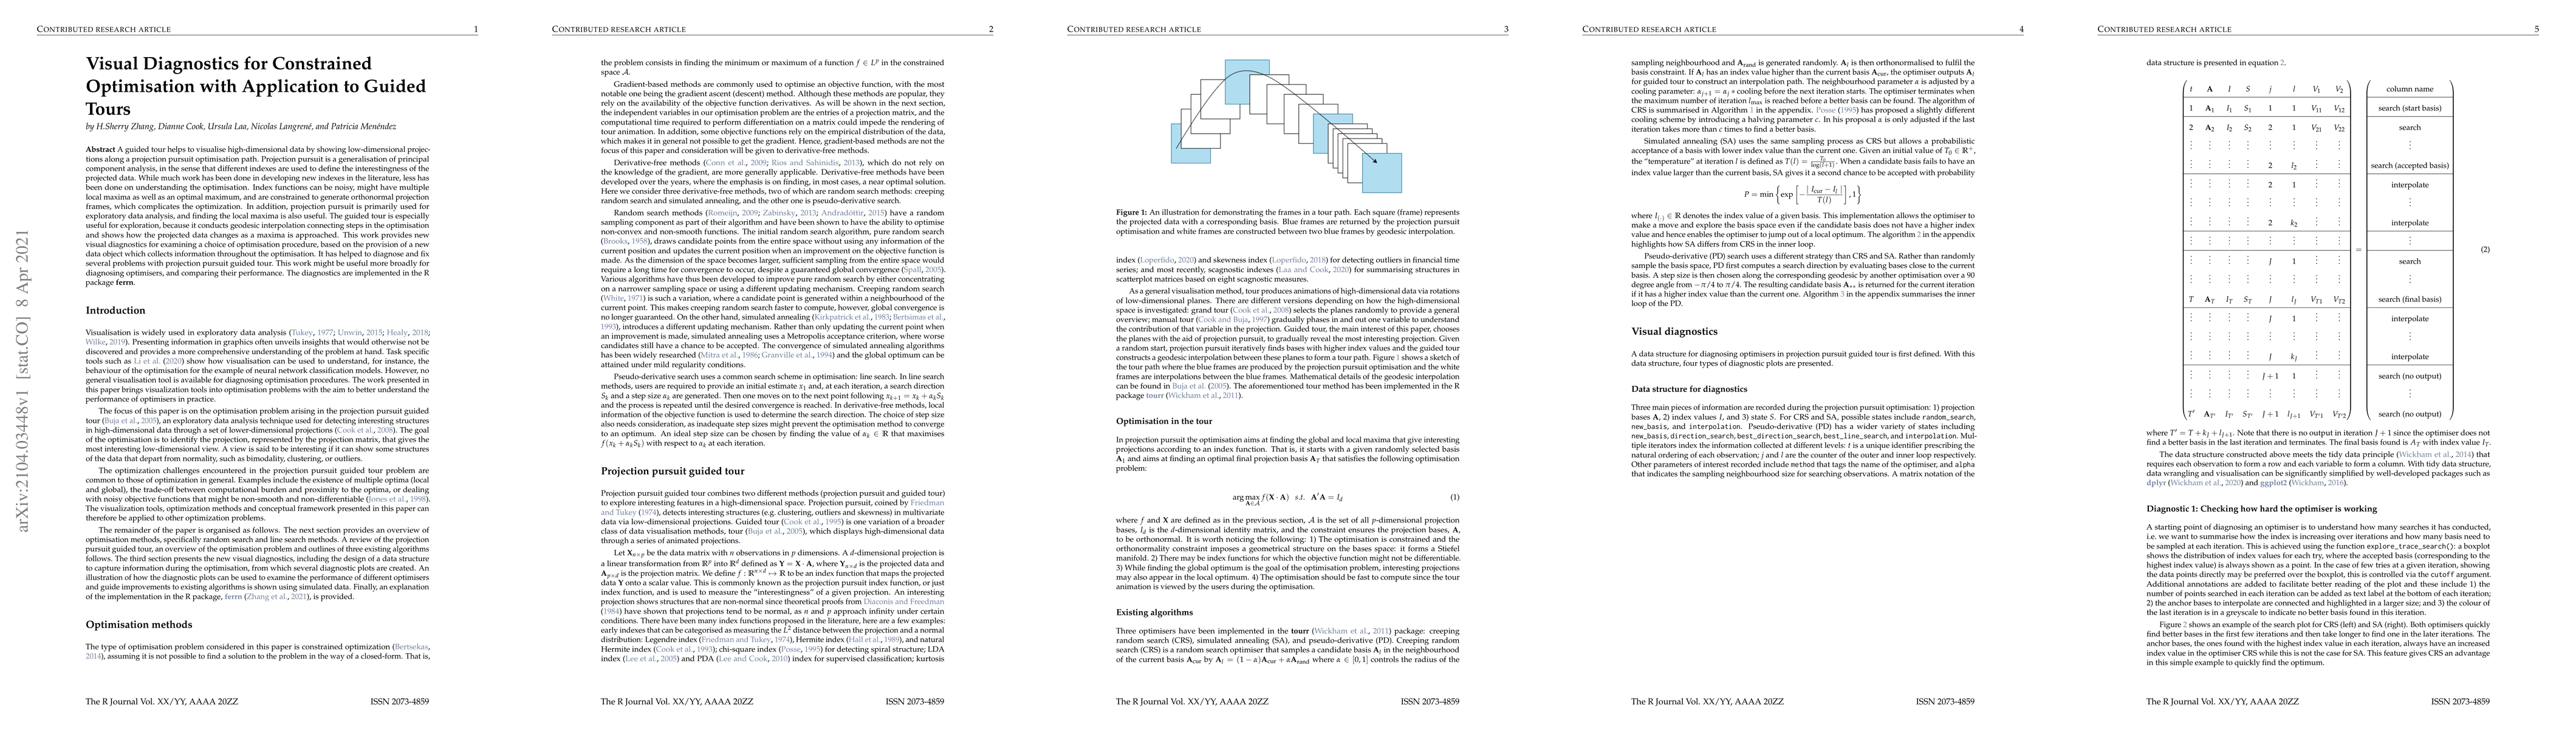
A guided tour helps to visualise high-dimensional data by showing low-dimensional projections along a projection pursuit optimisation path. Projection pursuit is a generalisation of principal compon...
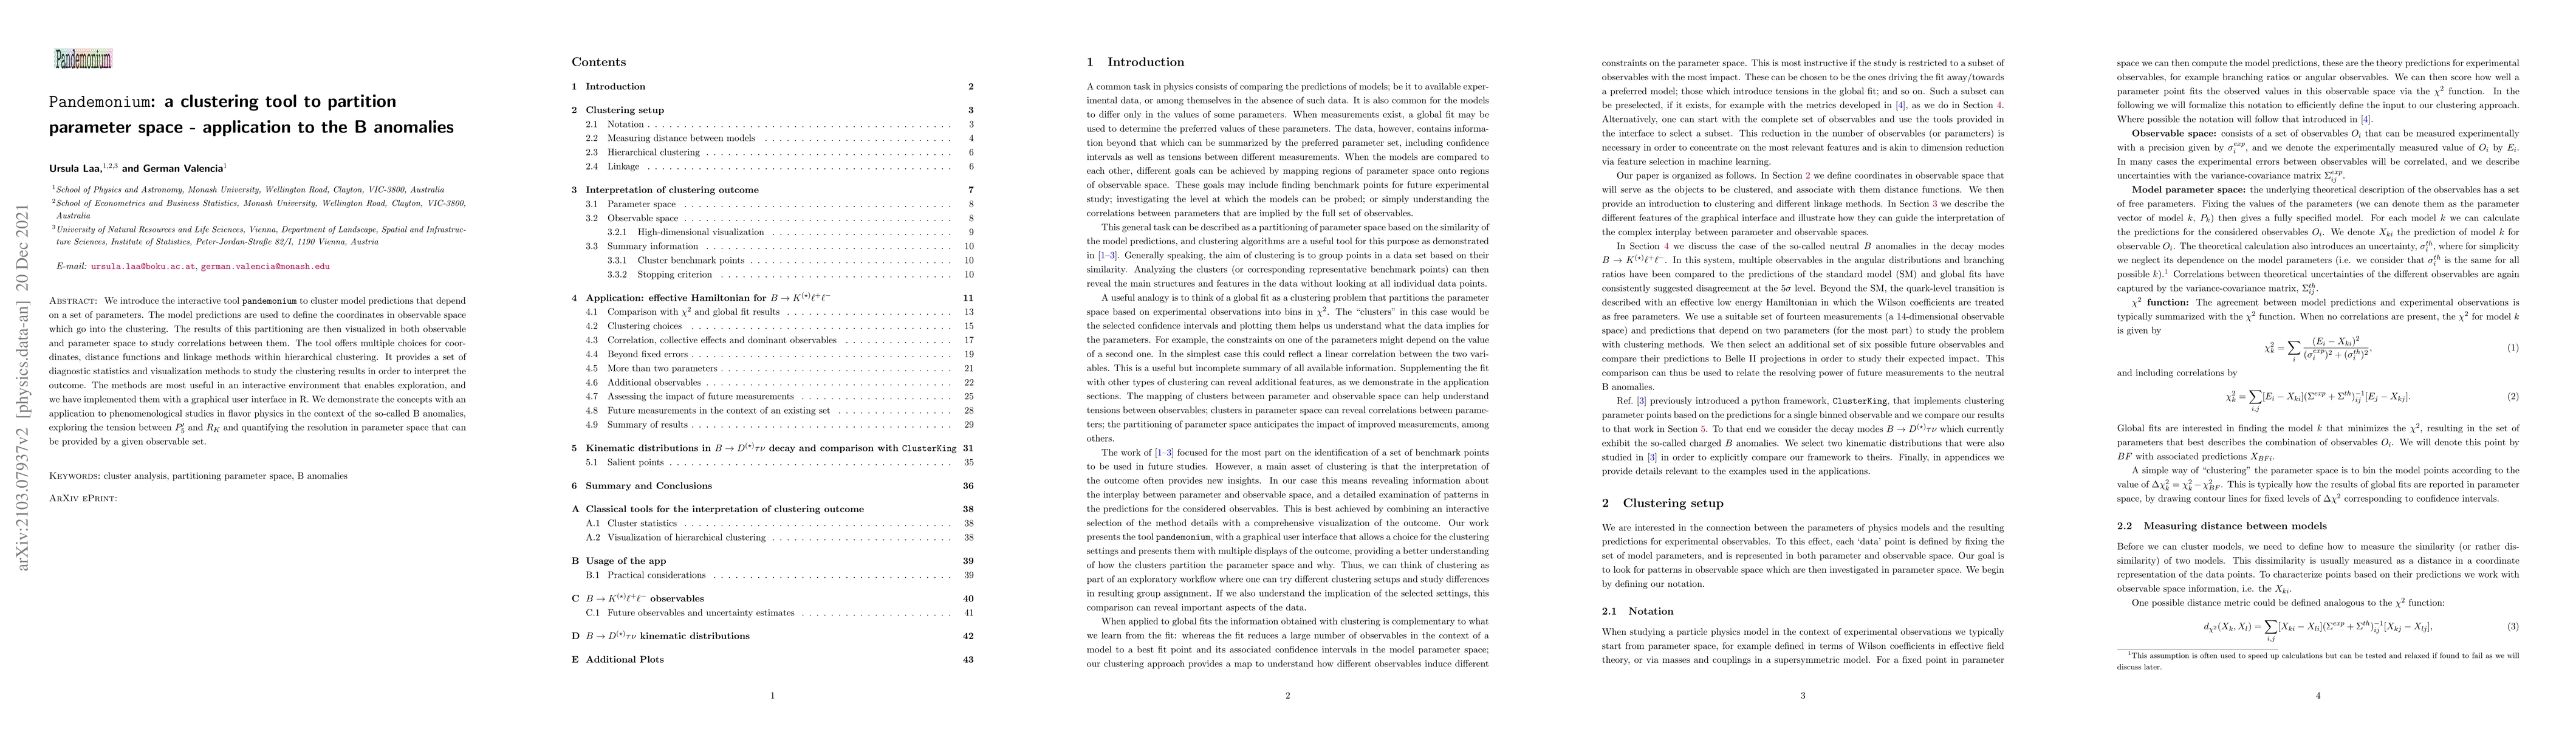
We introduce the interactive tool pandemonium to cluster model predictions that depend on a set of parameters. The model predictions are used to define the coordinates in observable space which go i...
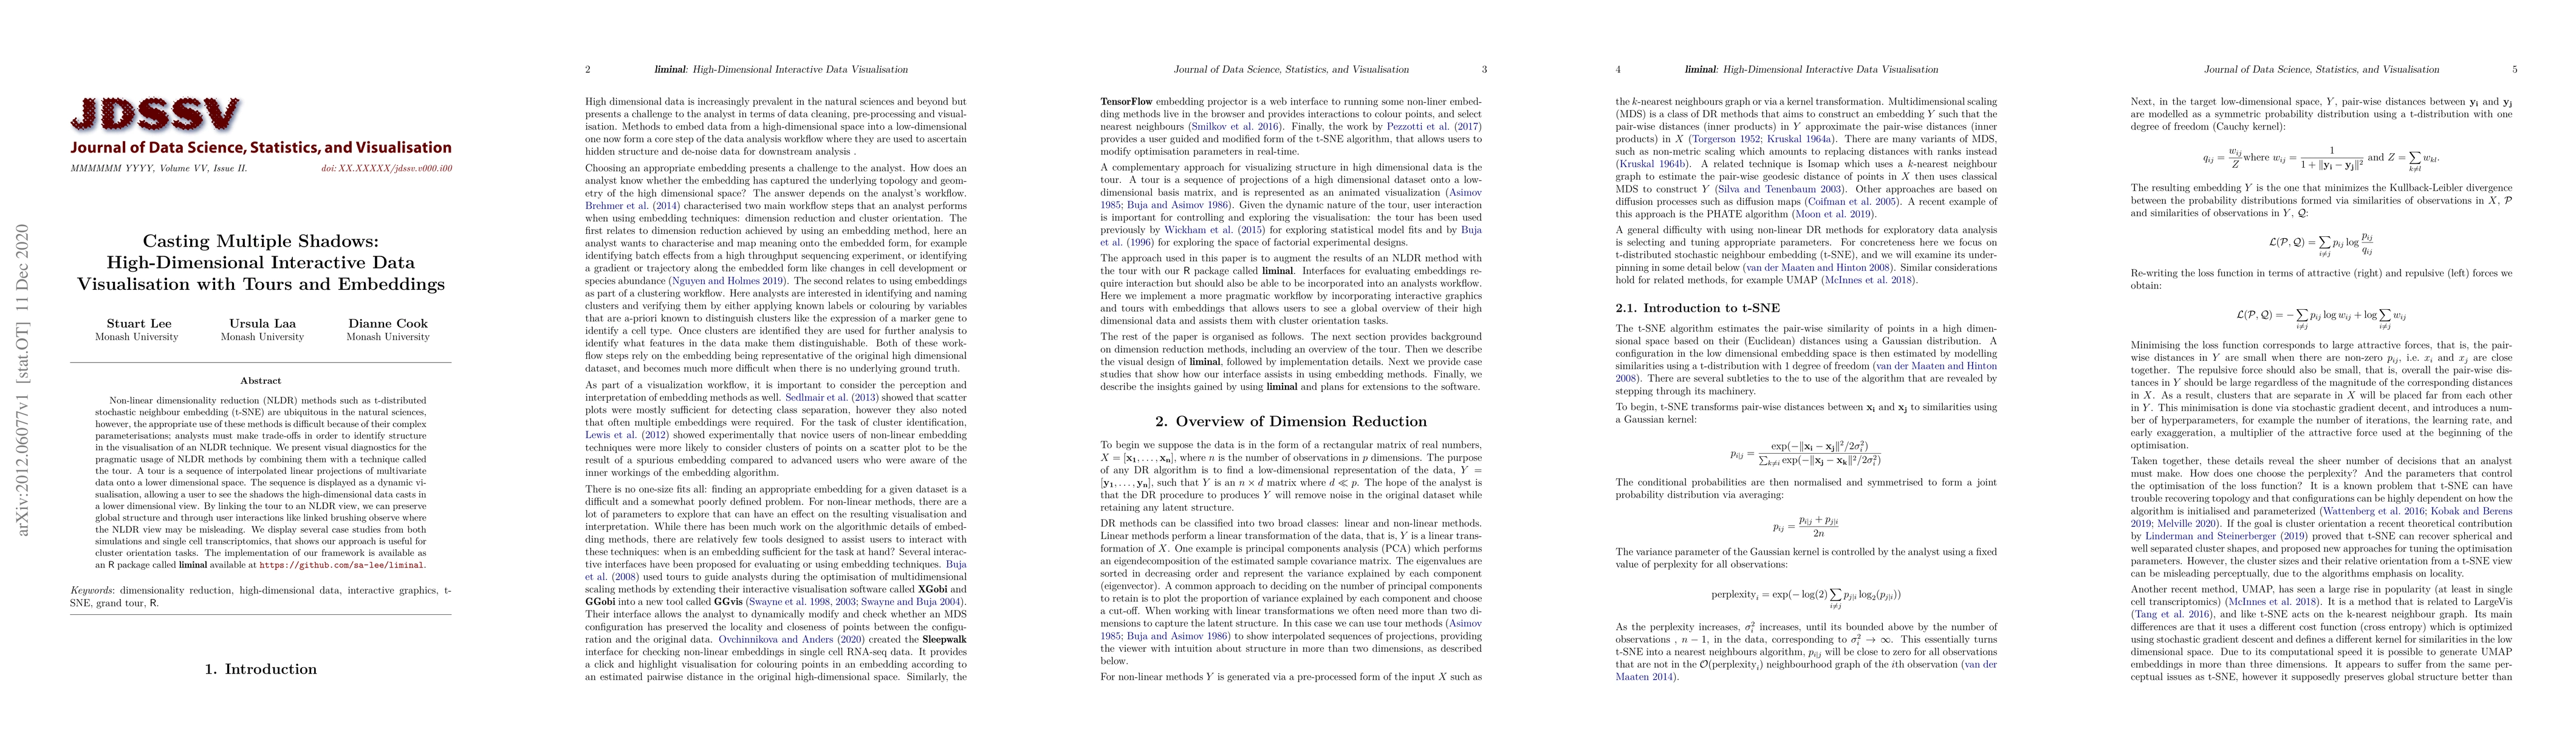
Non-linear dimensionality reduction (NLDR) methods such as t-distributed stochastic neighbour embedding (t-SNE) are ubiquitous in the natural sciences, however, the appropriate use of these methods ...
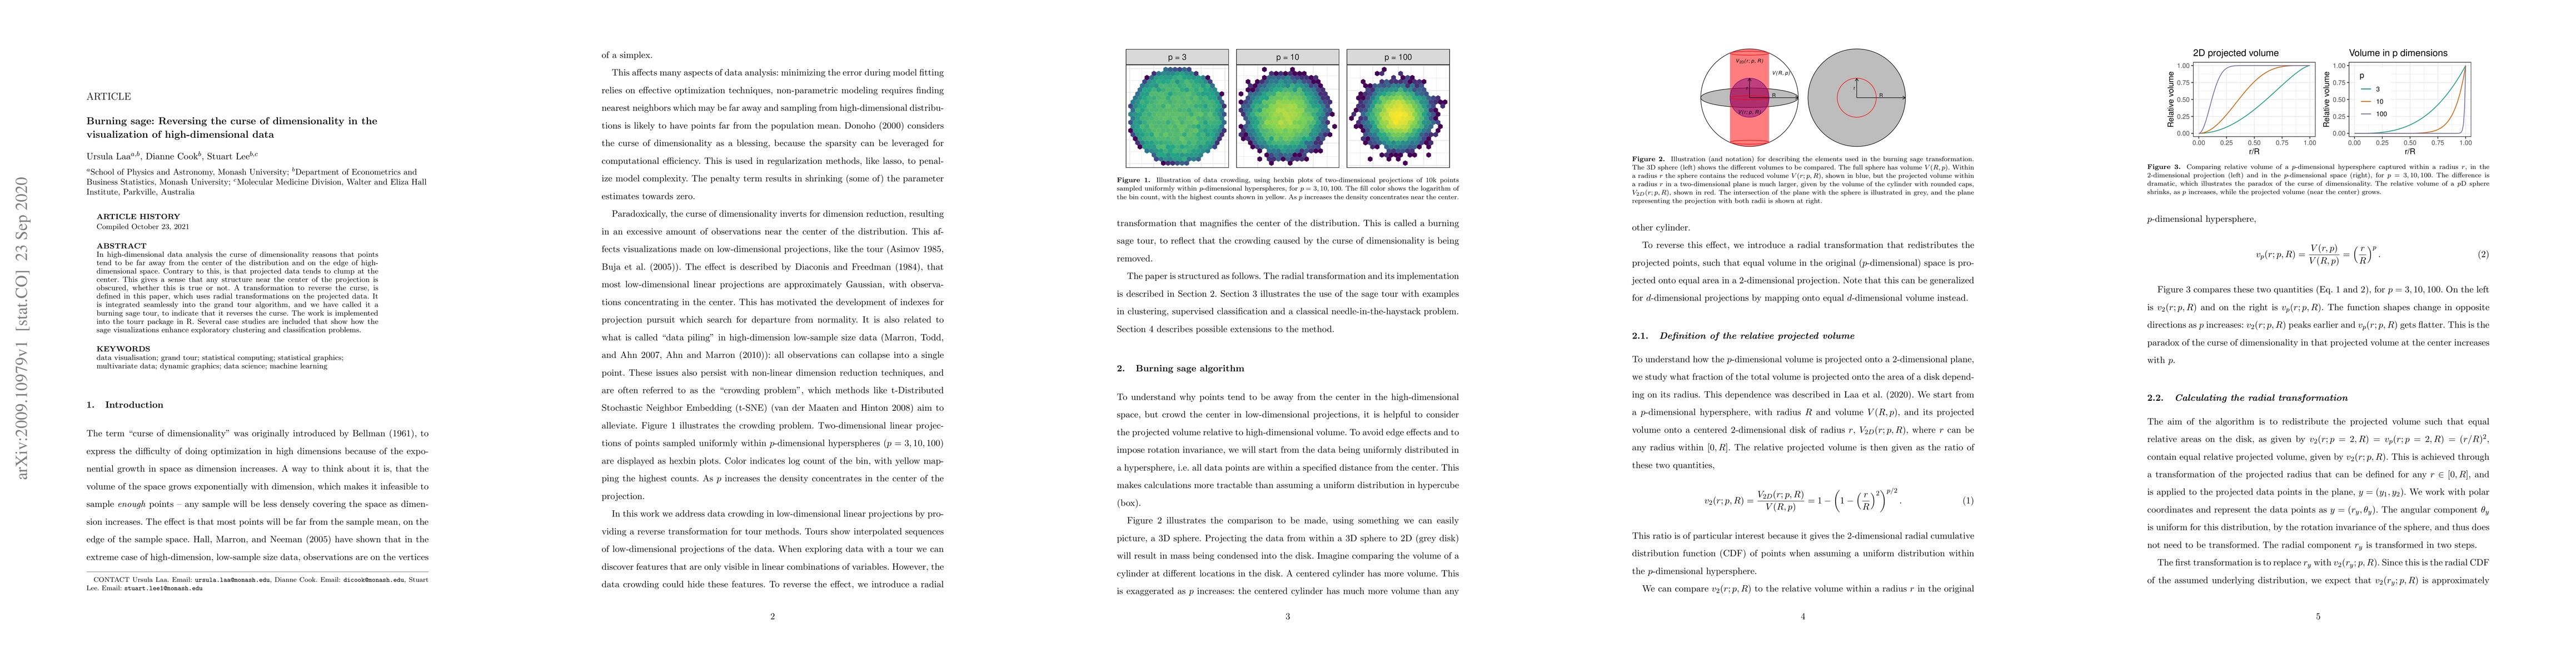
In high-dimensional data analysis the curse of dimensionality reasons that points tend to be far away from the center of the distribution and on the edge of high-dimensional space. Contrary to this,...
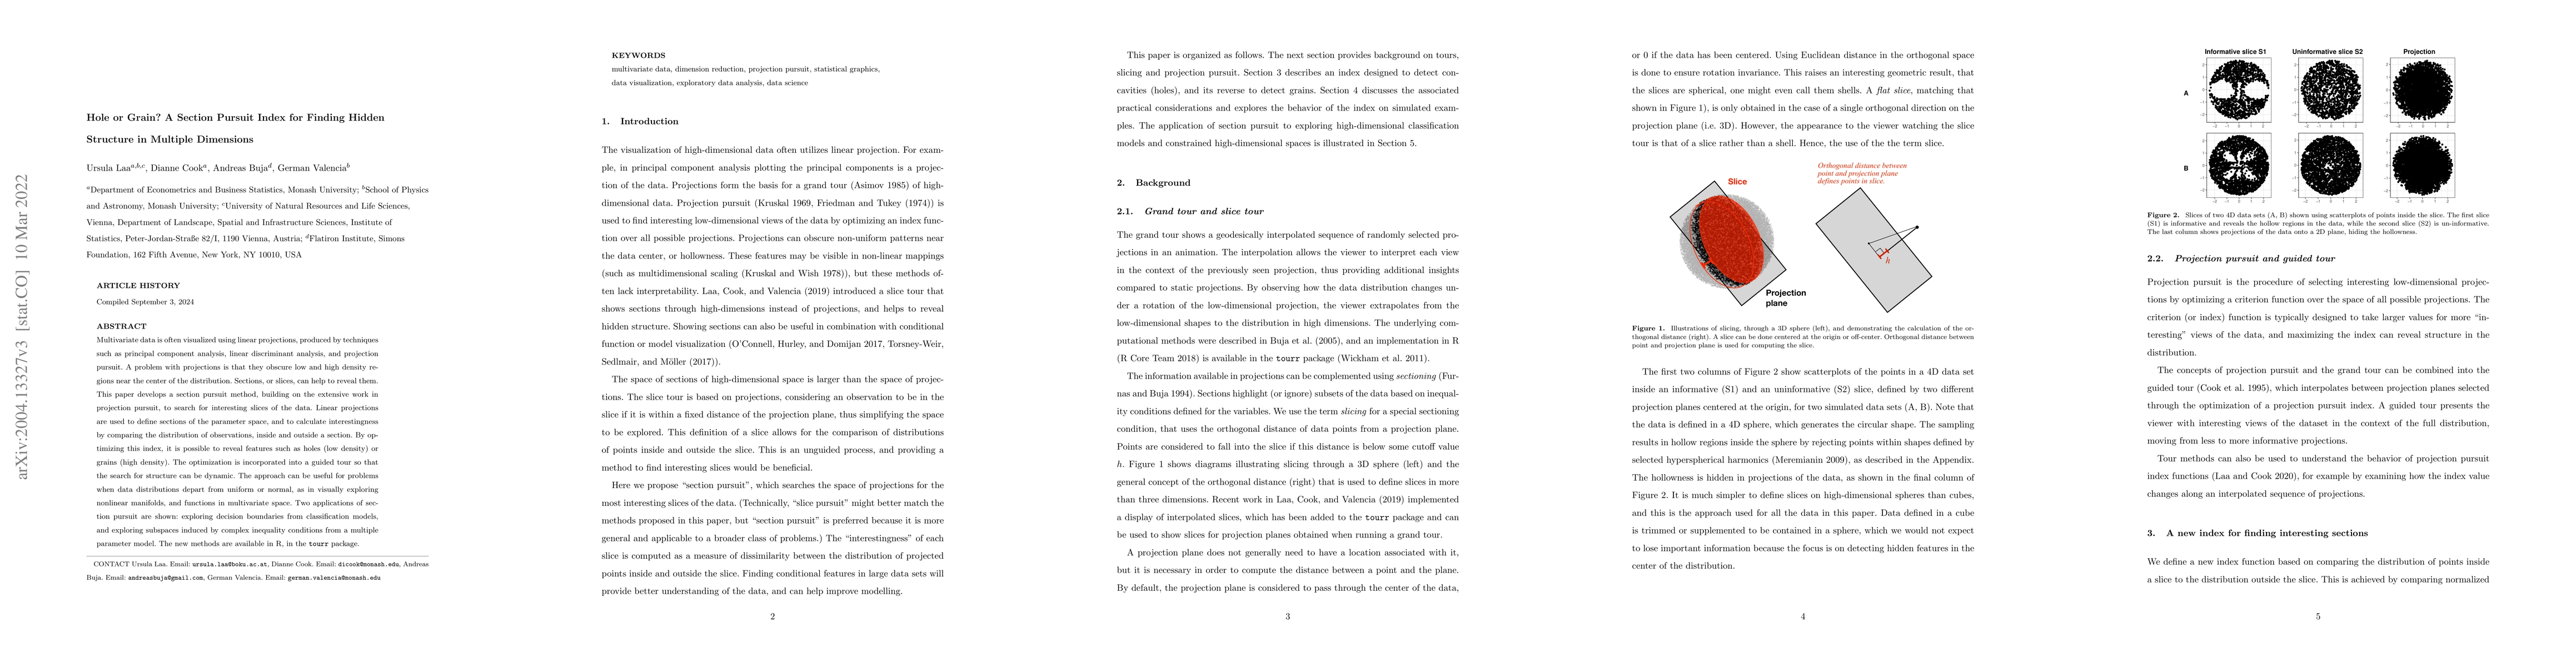
Multivariate data is often visualized using linear projections, produced by techniques such as principal component analysis, linear discriminant analysis, and projection pursuit. A problem with proj...
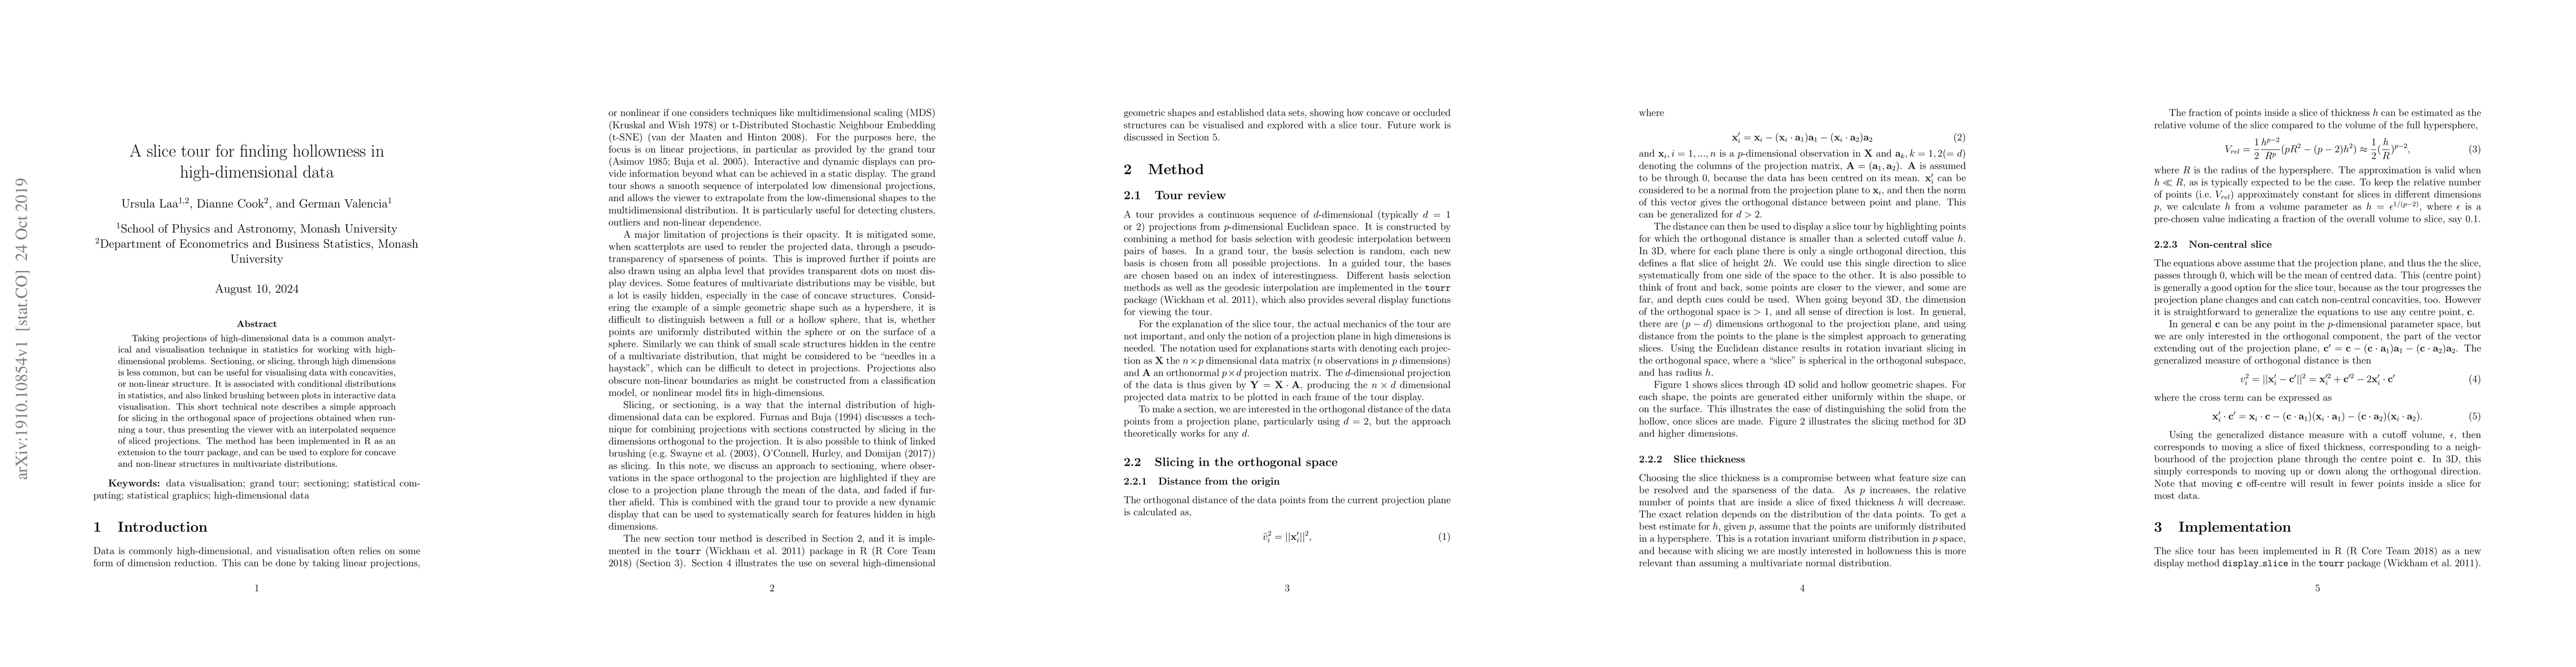
Taking projections of high-dimensional data is a common analytical and visualisation technique in statistics for working with high-dimensional problems. Sectioning, or slicing, through high dimensio...
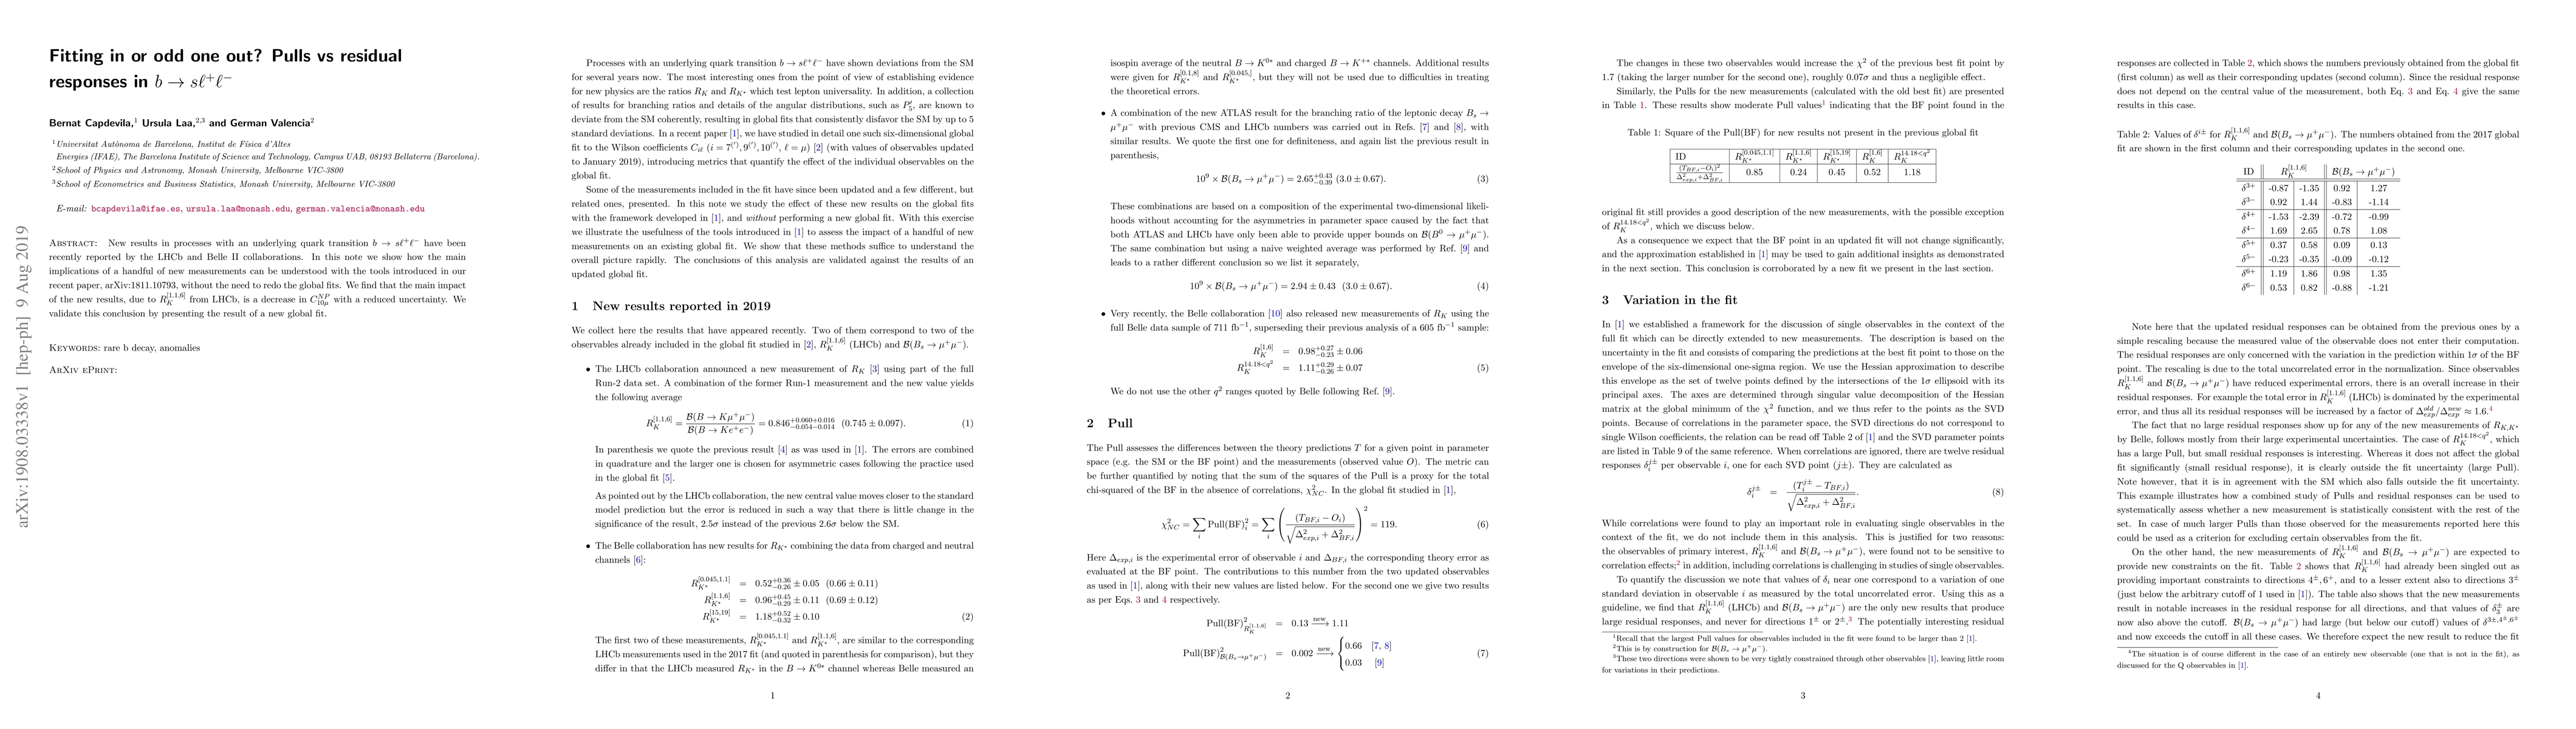
New results in processes with an underlying quark transition $b\to s \ell^+\ell^-$ have been recently reported by the LHCb and Belle II collaborations. In this note we show how the main implications...
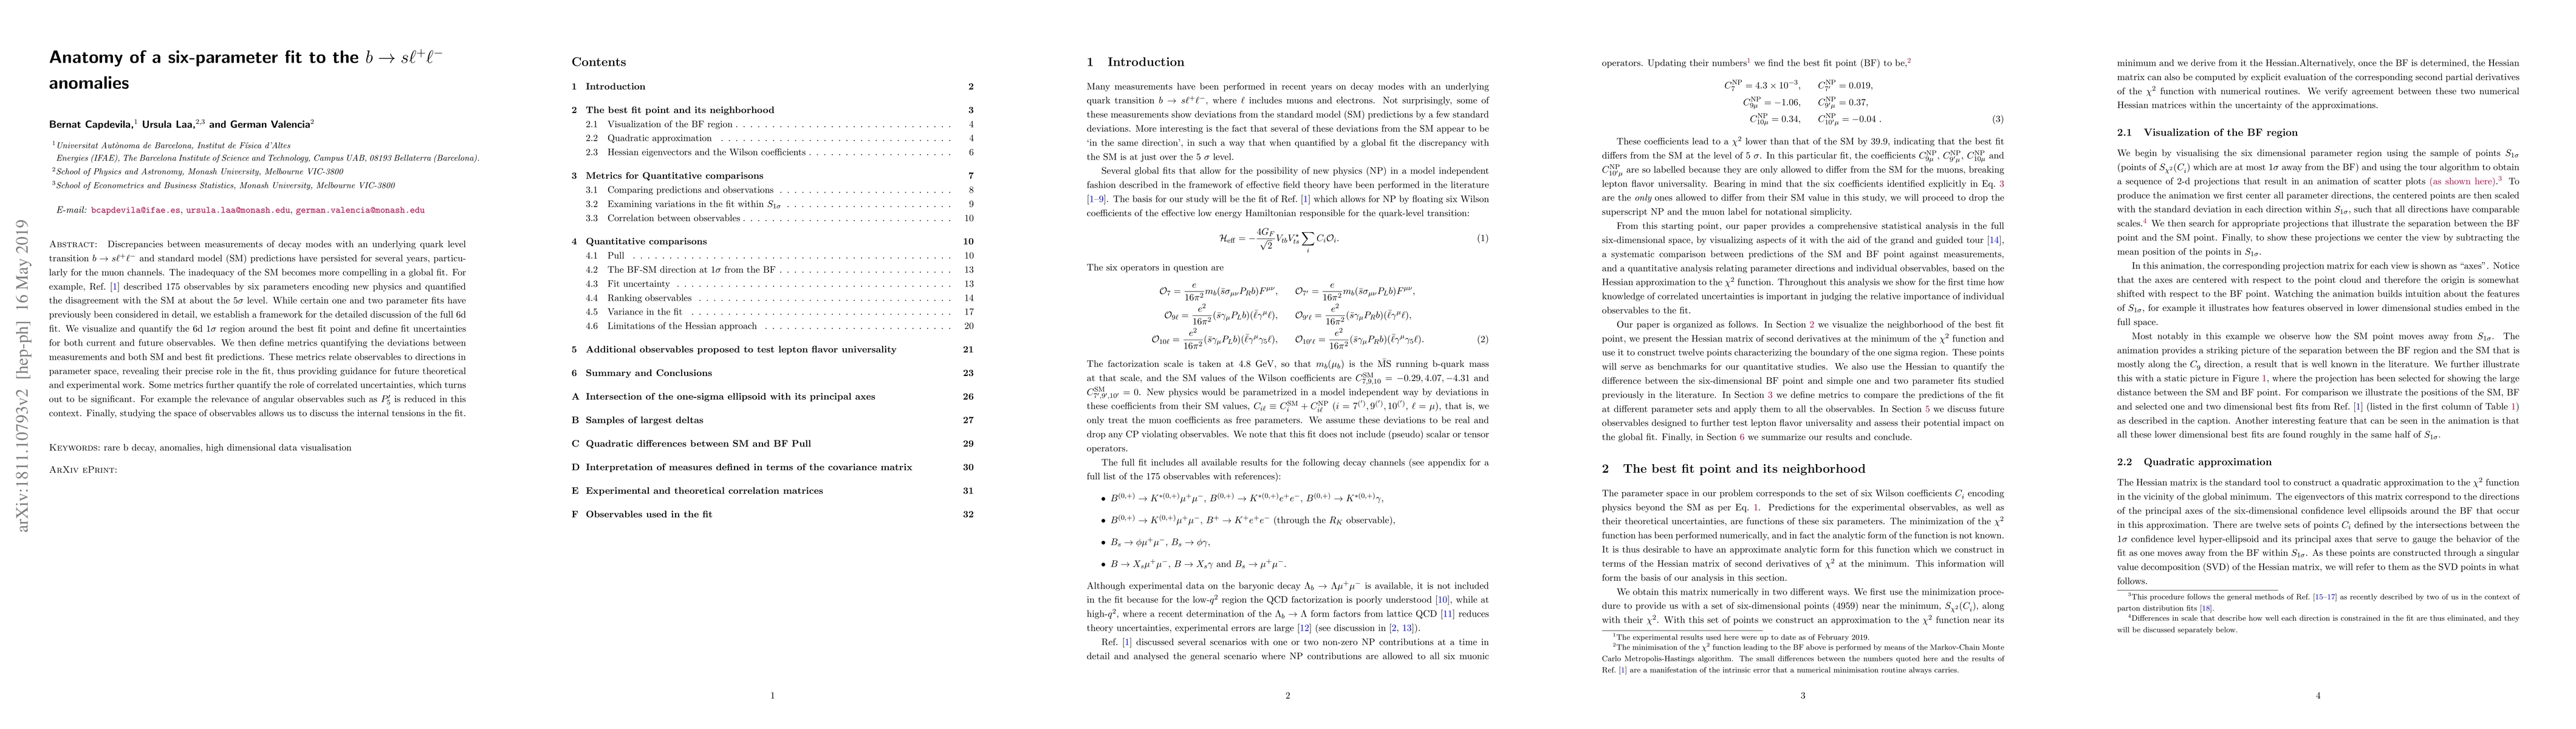
Discrepancies between measurements of decay modes with an underlying quark level transition $b\to s \ell^+\ell^-$ and standard model (SM) predictions have persisted for several years, particularly f...
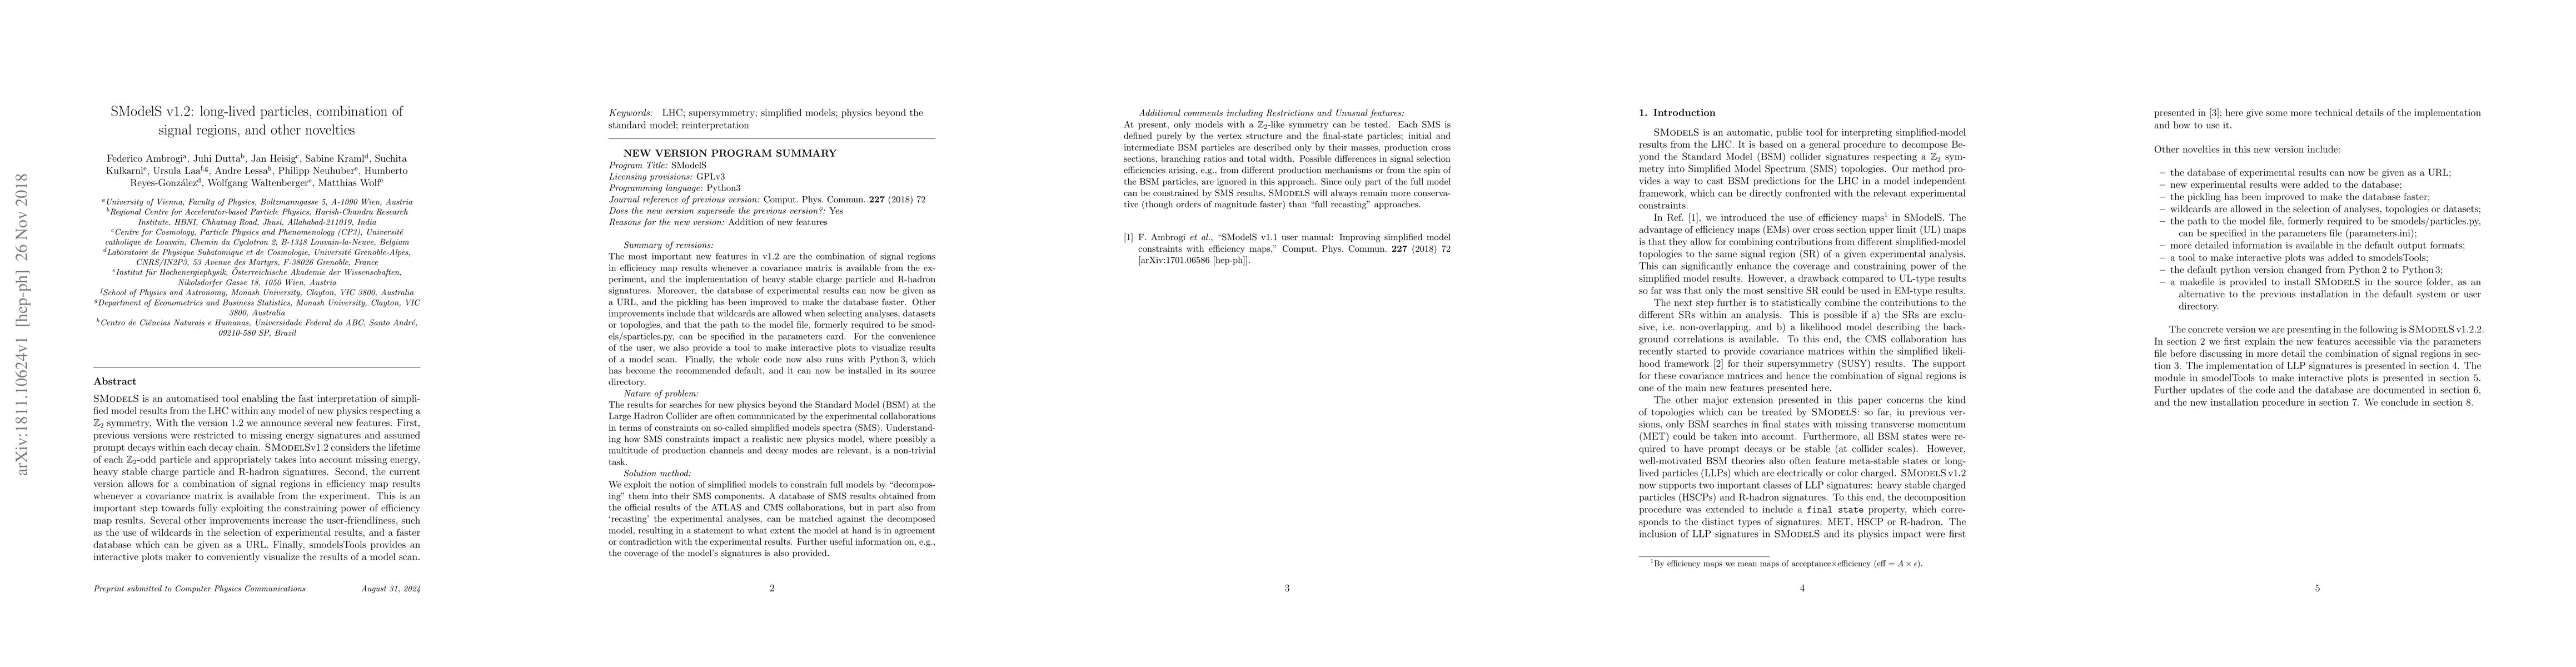
SModelS is an automatised tool enabling the fast interpretation of simplified model results from the LHC within any model of new physics respecting a $\mathbb{Z}_2$ symmetry. With the version 1.2 we...
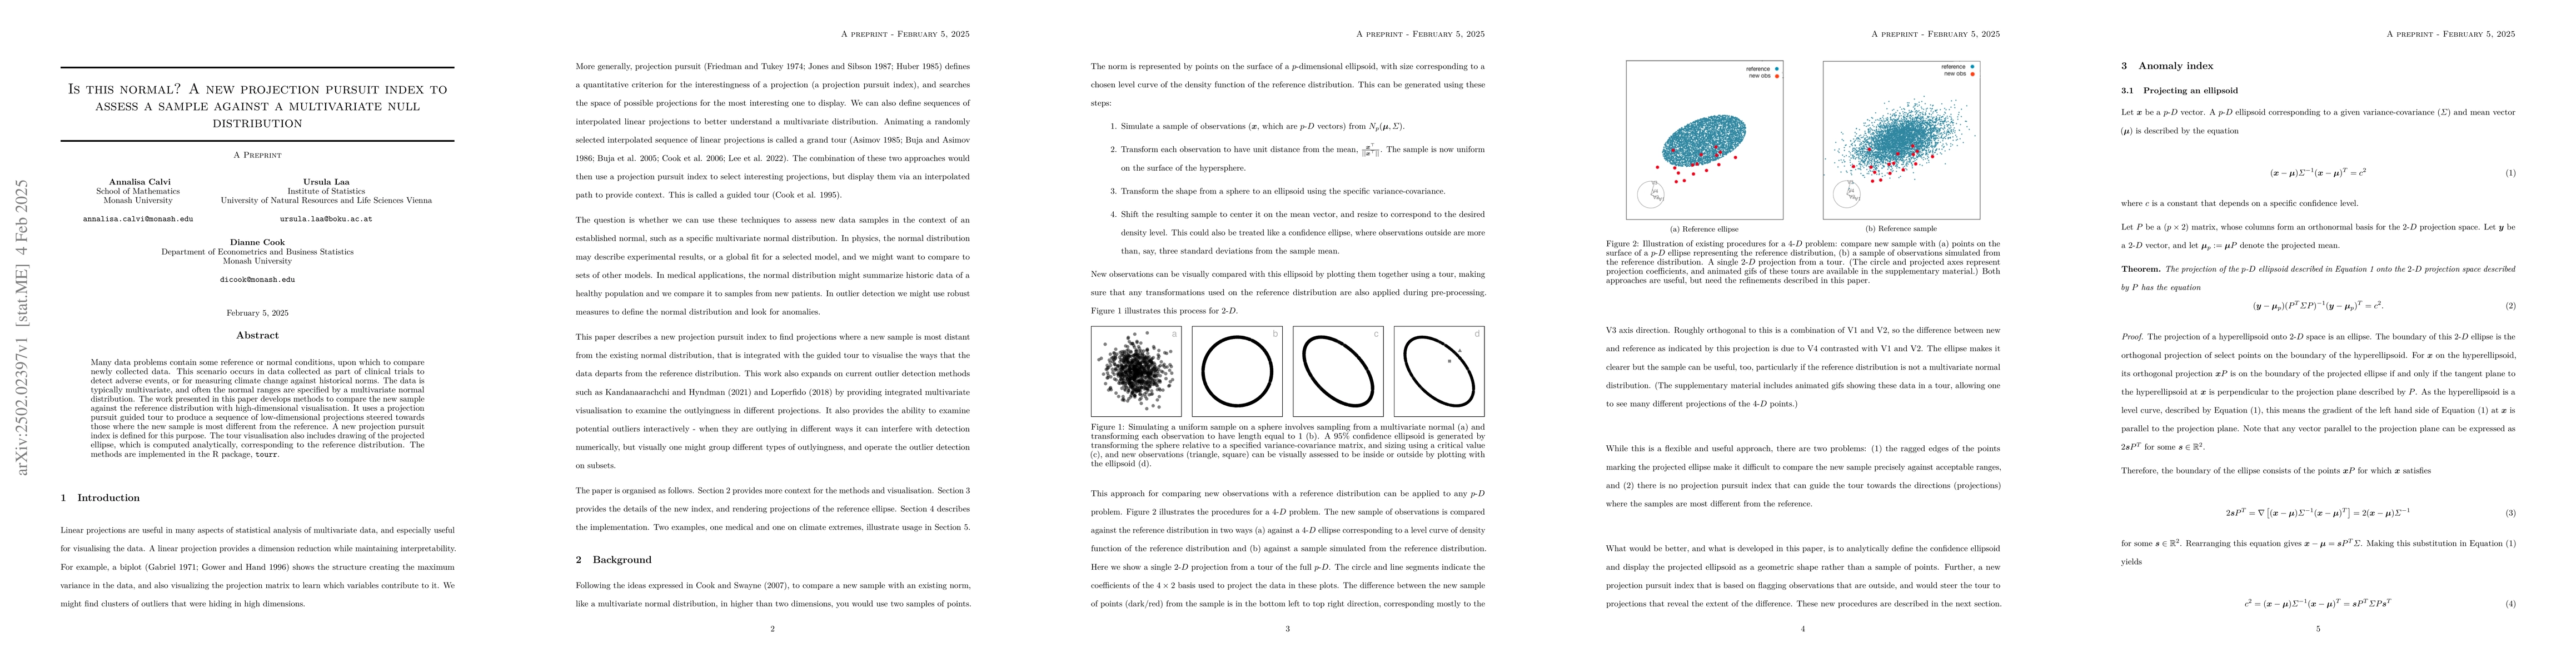
Many data problems contain some reference or normal conditions, upon which to compare newly collected data. This scenario occurs in data collected as part of clinical trials to detect adverse events, ...
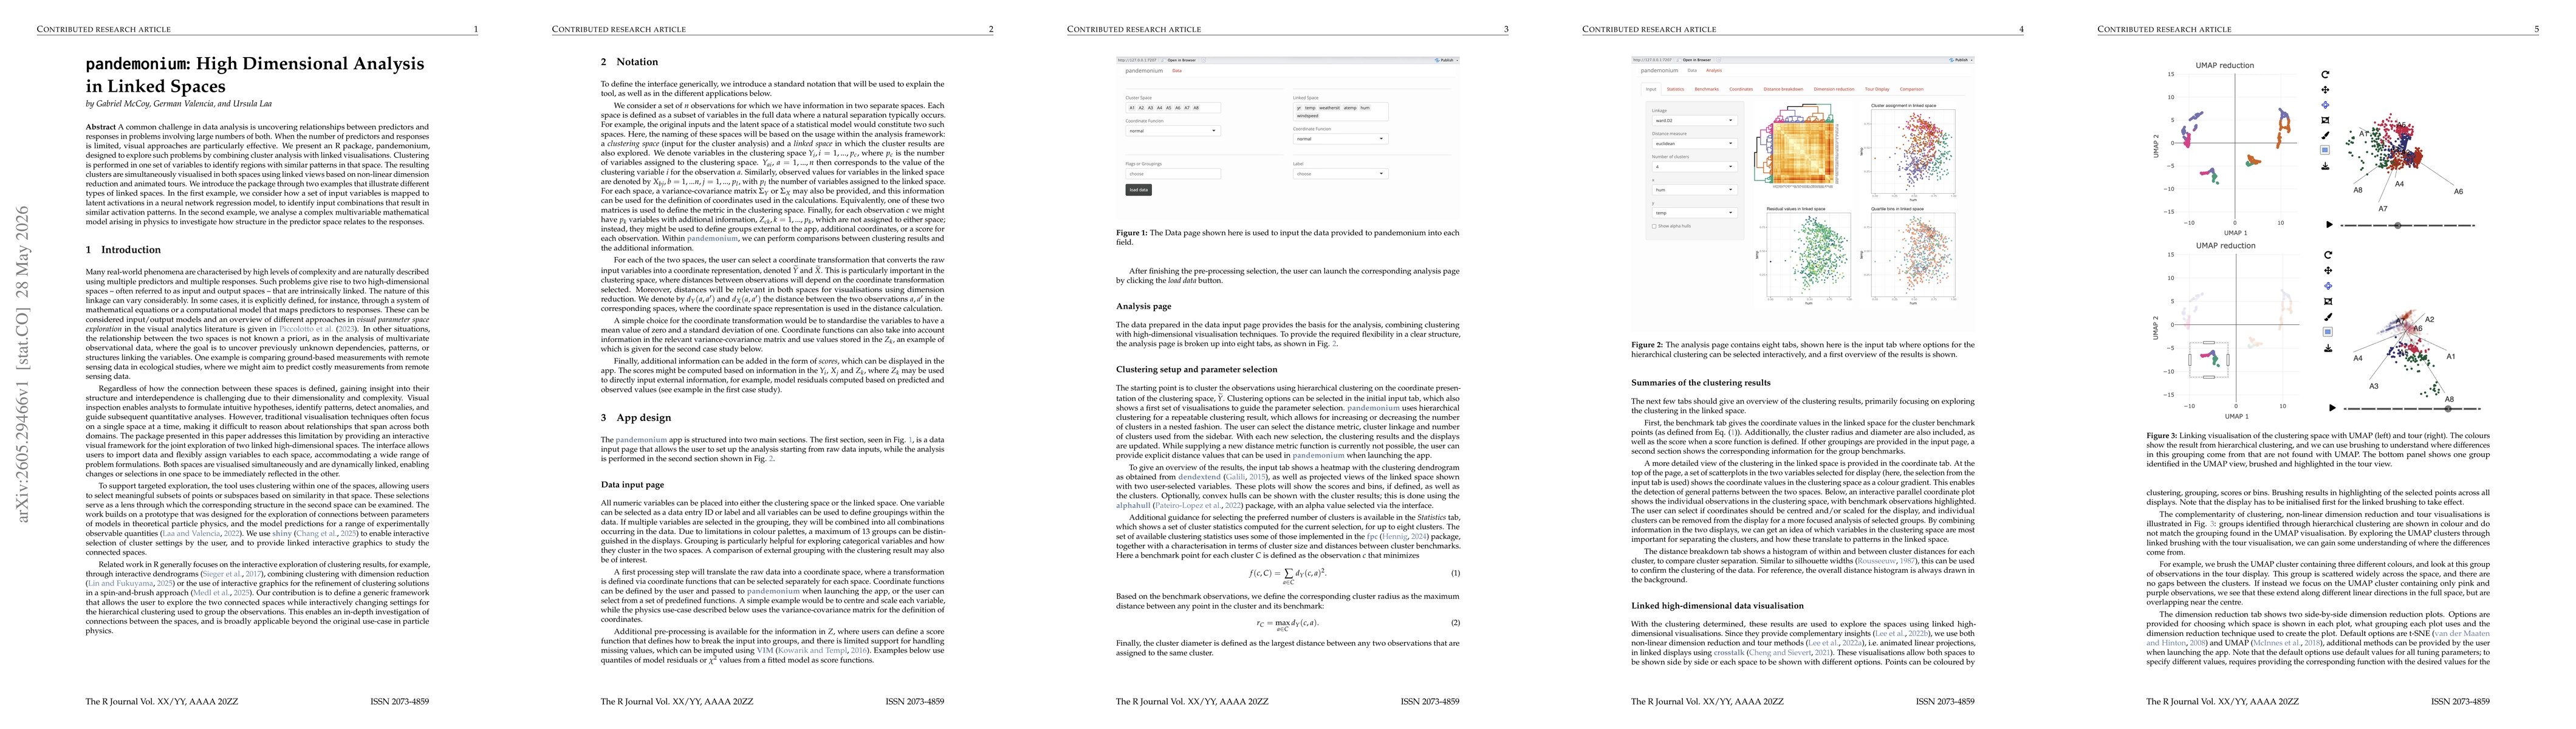
A common challenge in data analysis is uncovering relationships between predictors and responses in problems involving large numbers of both. When the number of predictors and responses is limited, vi...