Clustering and visualization tools to study high dimensional parameter spaces: B anomalies example
Publication
Metrics
AI Quick Summary
This paper explores the use of clustering and visualization techniques to analyze high-dimensional parameter spaces, using neutral B anomalies as a case study. The methods partition parameter spaces and reveal the collective dependence of observables, highlighting correlations and tensions in global fits.
Paper Preview
Abstract
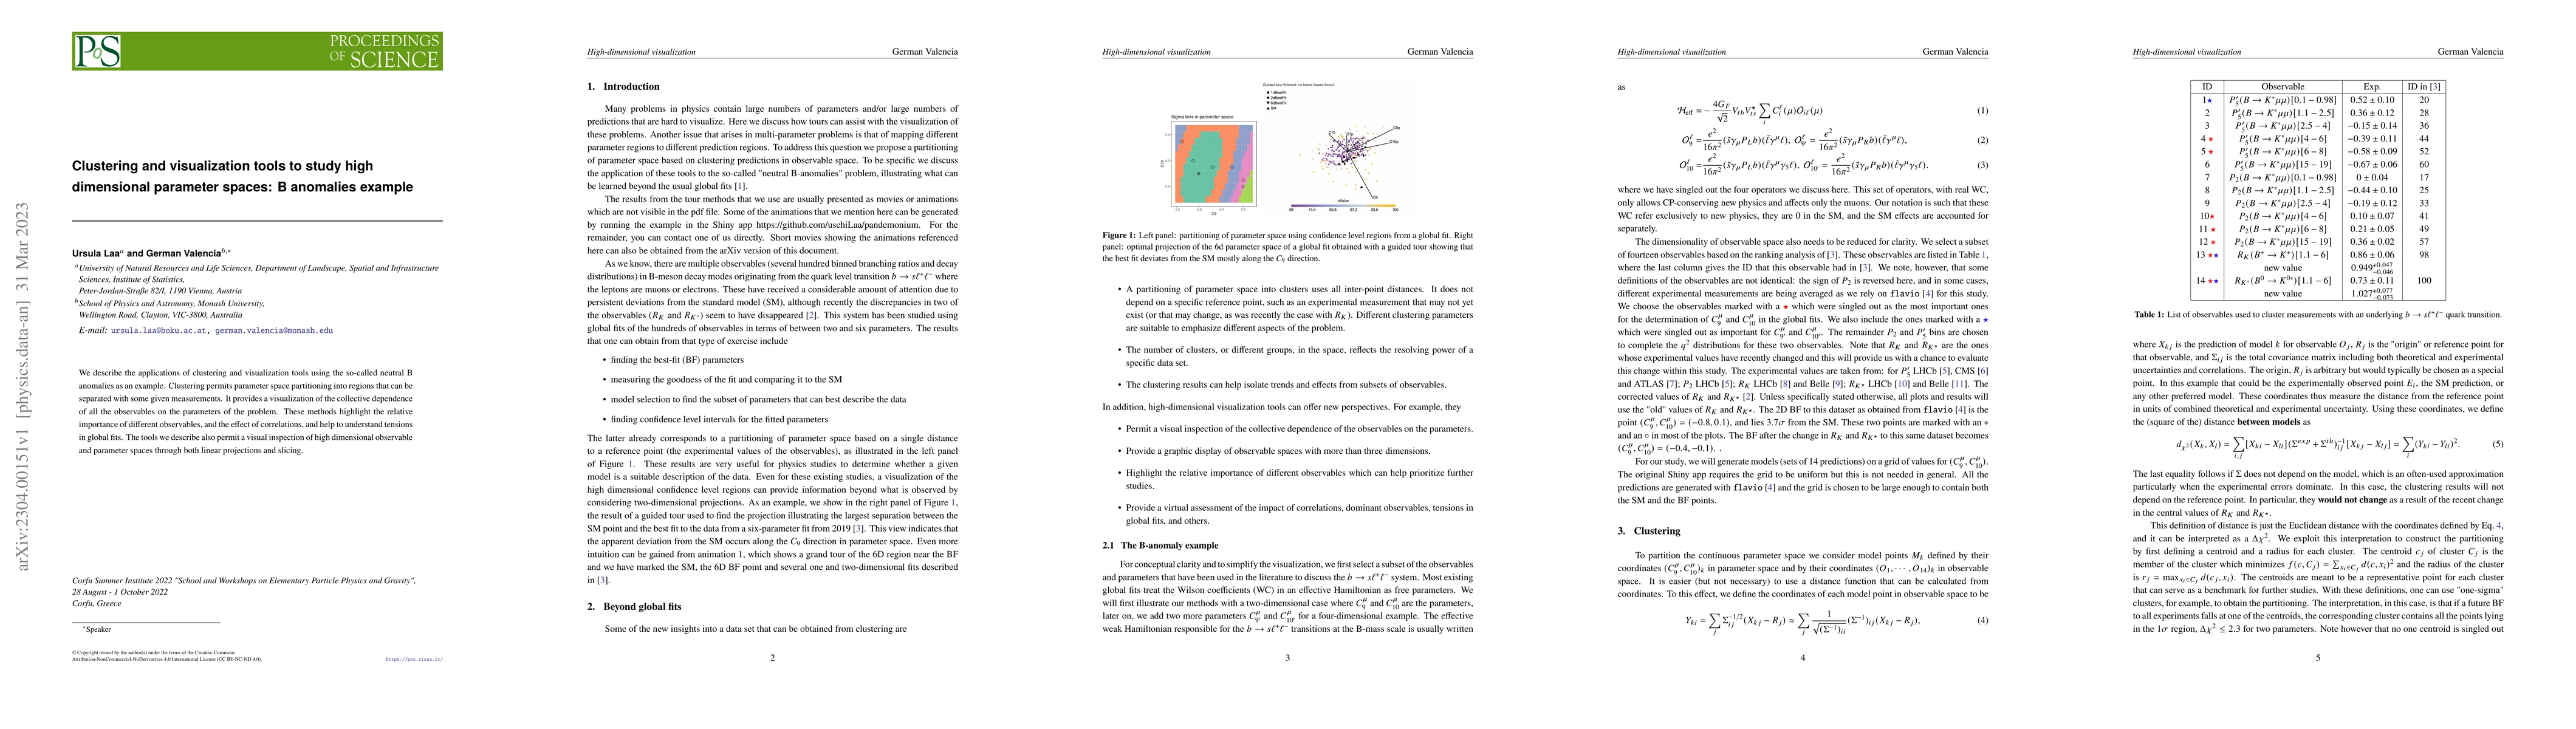
We describe the applications of clustering and visualization tools using the so-called neutral B anomalies as an example. Clustering permits parameter space partitioning into regions that can be separated with some given measurements. It provides a visualization of the collective dependence of all the observables on the parameters of the problem. These methods highlight the relative importance of different observables, and the effect of correlations, and help to understand tensions in global fits. The tools we describe also permit a visual inspection of high dimensional observable and parameter spaces through both linear projections and slicing.
AI Key Findings
Get AI-generated insights about this paper's methodology, results, significance, and more — seven facets brought into focus.
Impact
Paper Details
Authors
PDF Preview
Key Terms
Citation Network
Current paper (gray), citations (green), references (blue)
Display is limited for performance on very large graphs.
Discussion 0