This paper introduces a method to visualize high-dimensional data with concavities or non-linear structure by 'slicing' through projections, allowing for exploratory analysis of multivariate distributions.
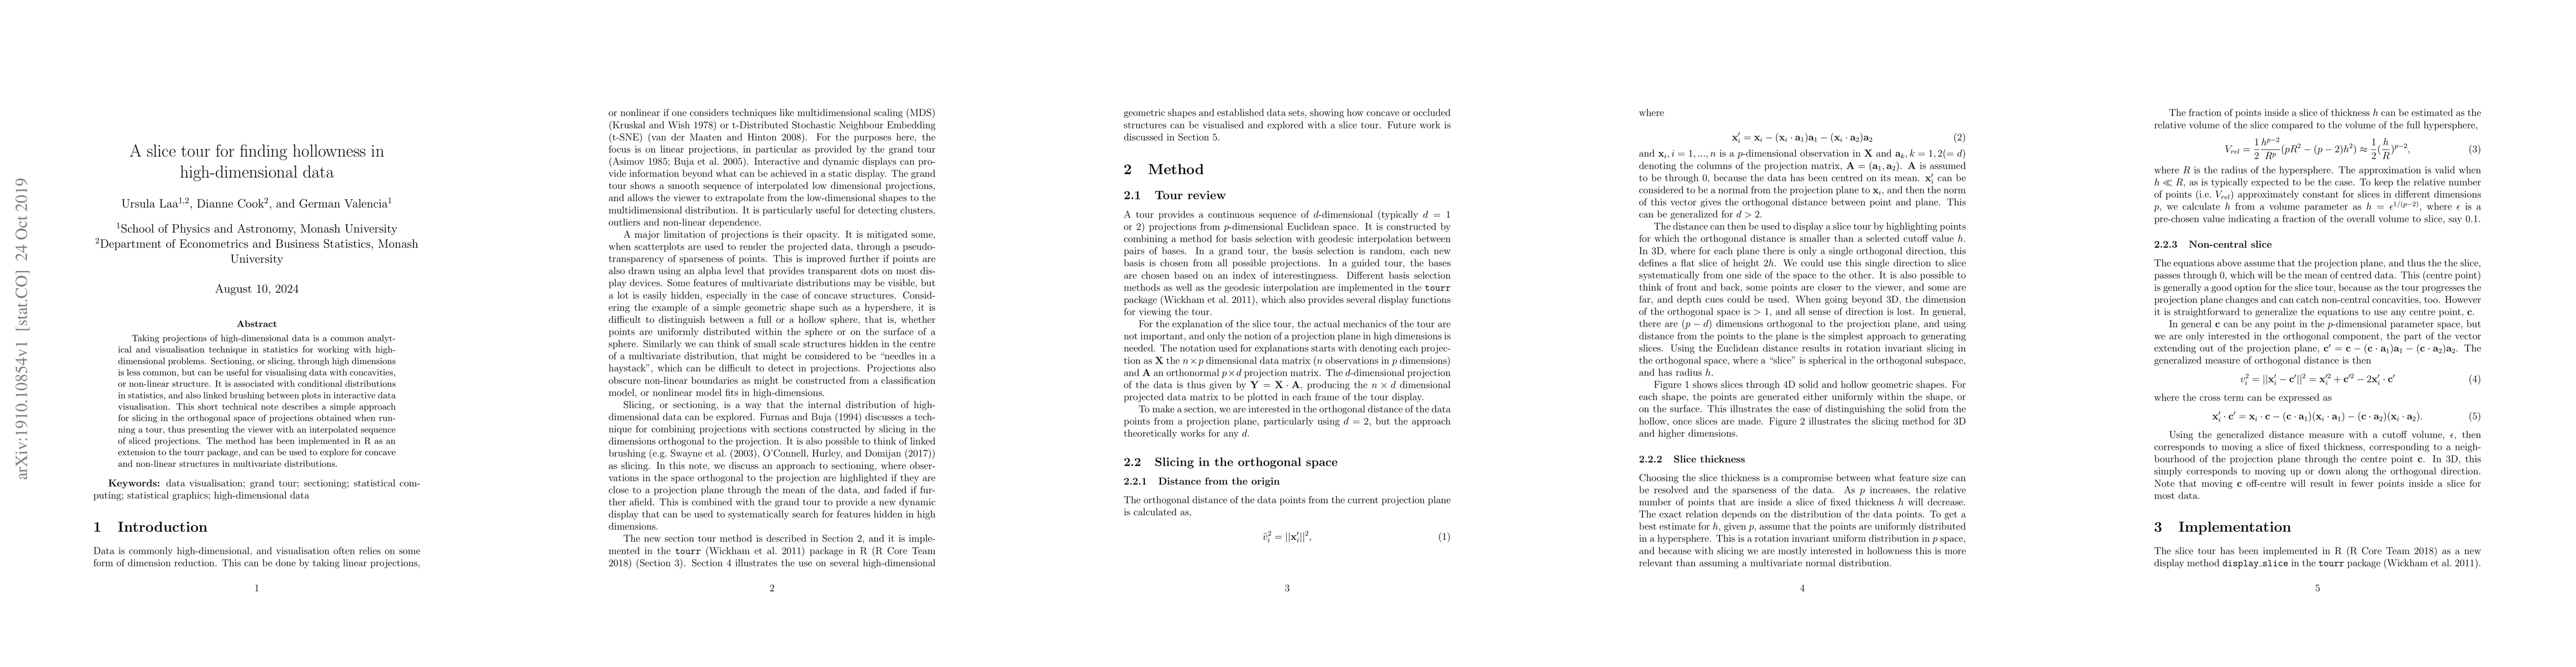
Taking projections of high-dimensional data is a common analytical and visualisation technique in statistics for working with high-dimensional problems. Sectioning, or slicing, through high dimensions is less common, but can be useful for visualising data with concavities, or non-linear structure. It is associated with conditional distributions in statistics, and also linked brushing between plots in interactive data visualisation. This short technical note describes a simple approach for slicing in the orthogonal space of projections obtained when running a tour, thus presenting the viewer with an interpolated sequence of sliced projections. The method has been implemented in R as an extension to the tourr package, and can be used to explore for concave and non-linear structures in multivariate distributions.
Get AI-generated insights about this paper's methodology, results, and significance.
Current paper (gray), citations (green), references (blue)
Dianne Cook, Kim Marriott, Nicholas Spyrison
Title | Authors | Year | Actions |
---|---|---|---|
Demonstrating the Capabilities of the lionfish Software for Interactive Visualization of Market Segmentation Partitions
|
Matthias Medl, Dianne Cook, U. Laa
|
2025
|
View Paper |
Revisiting models that enhance
<mml:math xmlns:mml="http://www.w3.org/1998/Math/MathML" display="inline"><mml:msup><mml:mi>B</mml:mi><mml:mo>+</mml:mo></mml:msup><mml:mo stretchy="false">→</mml:mo><mml:msup><mml:mi>K</mml:mi><mml:mo>+</mml:mo></mml:msup><mml:mi>ν</mml:mi><mml:mover accent="true"><m
|
Xiaoyan He, Xiao-Dong Ma, German Valencia
|
2024
|
View Paper |
Clustering and visualization tools to study high dimensional parameter spaces: B anomalies example
|
U. Laa, G. Valencia
|
2023
|
View Paper |
New and Simplified Manual Controls for Projection and Slice Tours, With Application to Exploring Classification Boundaries in High Dimensions
|
U. Laa, Alex Aumann, D. Cook, G. Valencia
|
2022
|
View Paper |
The state‐of‐the‐art on tours for dynamic visualization of high‐dimensional data
|
Stuart Lee, Dianne Cook, N. Silva, U. Laa, N. Spyrison, Earo Wang, H. S. Zhang
|
2021
|
View Paper |
A Review of the State-of-the-Art on Tours for Dynamic Visualization of High-dimensional Data
|
Stuart Lee, D. Cook, N. Silva, U. Laa, Earo Wang, N. Spyrison, H. S. Zhang
|
2021
|
View Paper |
Pandemonium: a clustering tool to partition parameter space—application to the B anomalies
|
U. Laa, G. Valencia
|
2021
|
View Paper |
Computationally Efficient Learning of Statistical Manifolds
|
Fan Cheng, Anastasios Panagiotelis, Rob J Hyndman
|
2021
|
View Paper |
Interactive Slice Visualization for Exploring Machine Learning Models
|
C. Hurley, Mark O'Connell, Katarina Domijan
|
2021
|
View Paper |
Burning Sage: Reversing the Curse of Dimensionality in the Visualization of High-Dimensional Data
|
U. Laa, D. Cook, Stuart Lee
|
2020
|
View Paper |
Hole or Grain? A Section Pursuit Index for Finding Hidden Structure in Multiple Dimensions
|
U. Laa, D. Cook, A. Buja, G. Valencia
|
2020
|
View Paper |
Comments (0)