Publication
Metrics
AI Quick Summary
This paper introduces Mystique, a tool for deconstructing SVG charts into reusable components, focusing on rectangle-based layouts. It achieves high accuracy in extracting axes, legends, and deconstructing layouts into semantic components, enabling effective chart reuse on new datasets.
Paper Preview
Abstract
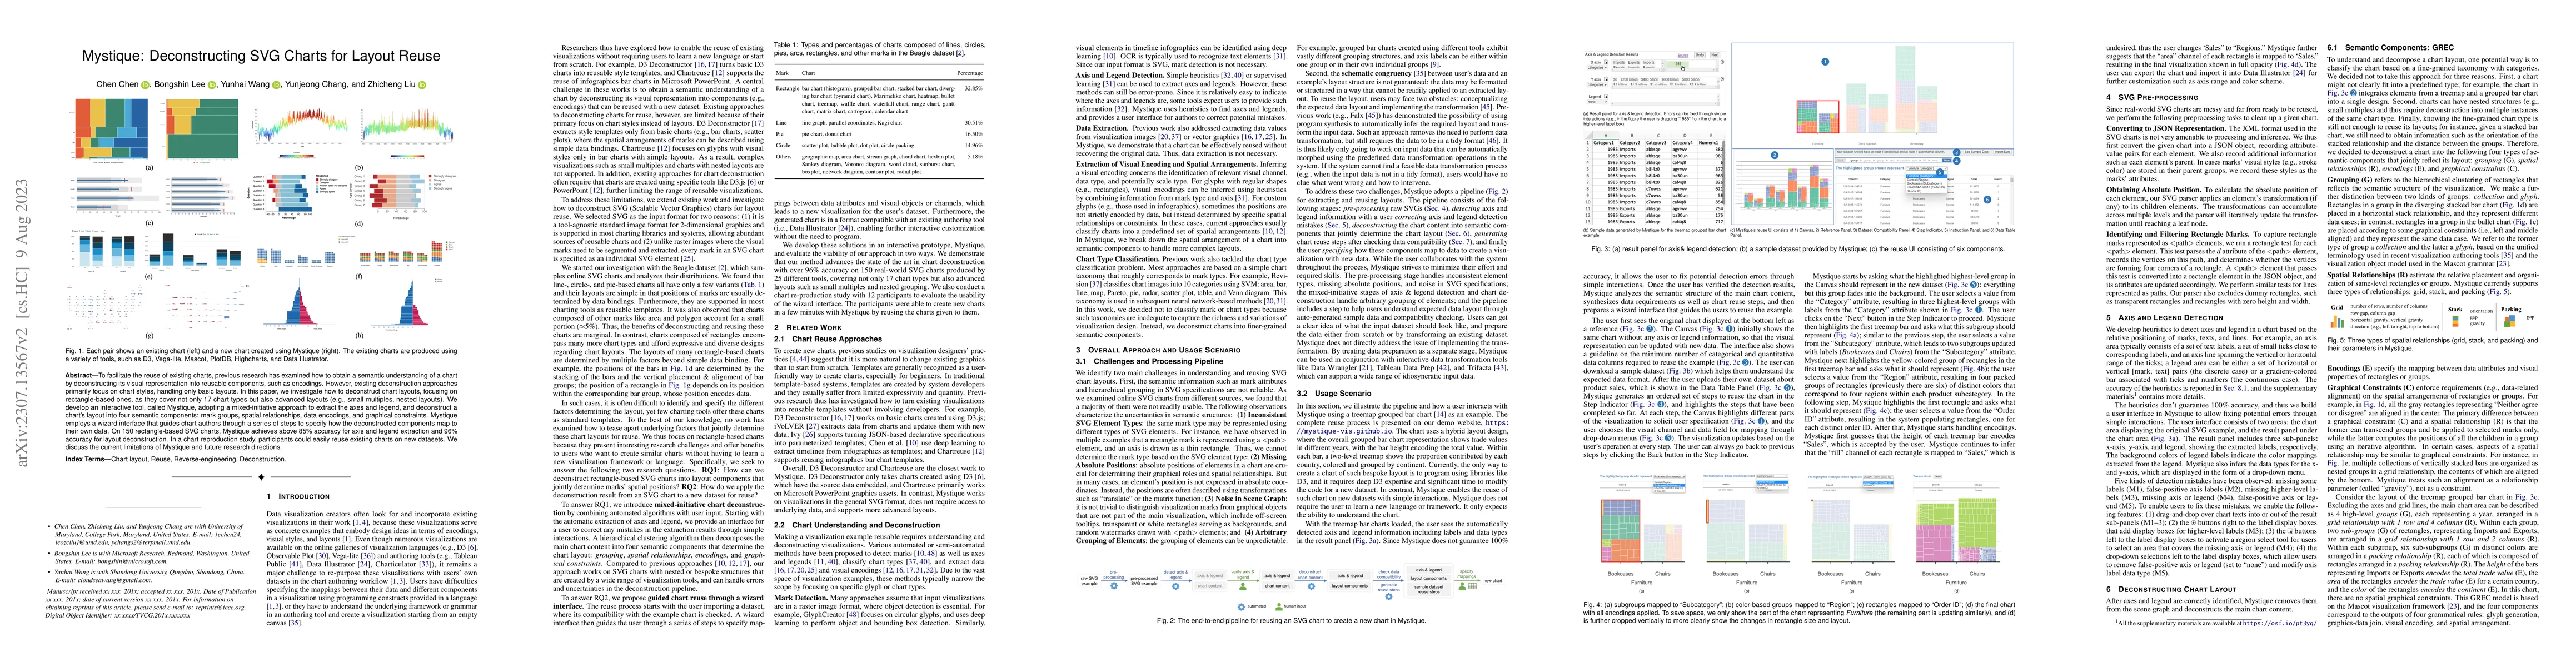
To facilitate the reuse of existing charts, previous research has examined how to obtain a semantic understanding of a chart by deconstructing its visual representation into reusable components, such as encodings. However, existing deconstruction approaches primarily focus on chart styles, handling only basic layouts. In this paper, we investigate how to deconstruct chart layouts, focusing on rectangle-based ones, as they cover not only 17 chart types but also advanced layouts (e.g., small multiples, nested layouts). We develop an interactive tool, called Mystique, adopting a mixed-initiative approach to extract the axes and legend, and deconstruct a chart's layout into four semantic components: mark groups, spatial relationships, data encodings, and graphical constraints. Mystique employs a wizard interface that guides chart authors through a series of steps to specify how the deconstructed components map to their own data. On 150 rectangle-based SVG charts, Mystique achieves above 85% accuracy for axis and legend extraction and 96% accuracy for layout deconstruction. In a chart reproduction study, participants could easily reuse existing charts on new datasets. We discuss the current limitations of Mystique and future research directions.
AI Key Findings — Failed
Key findings generation failed. Failed to start generation process
Impact
Paper Details
Authors
PDF Preview
Key Terms
Citation Network
Current paper (gray), citations (green), references (blue)
Display is limited for performance on very large graphs.
Discussion 0