Academic Profile
Statistics
Similar Authors
Papers on arXiv
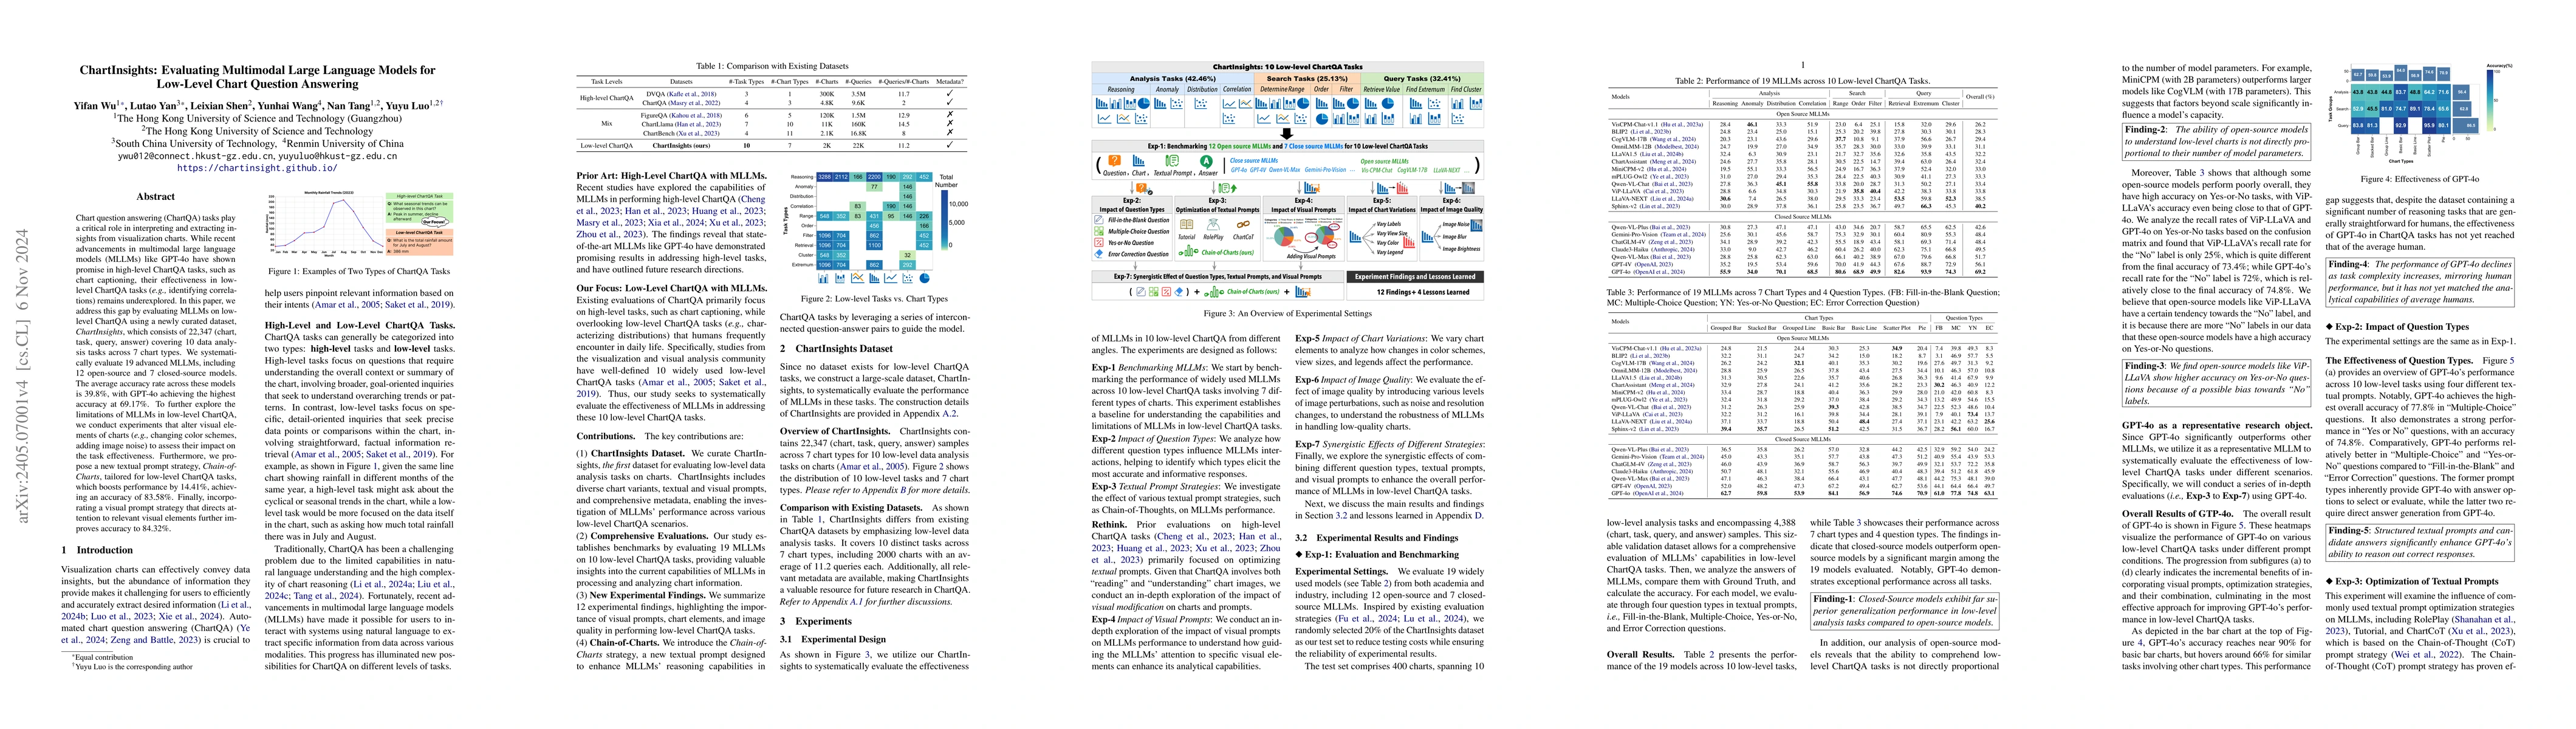
In this paper, we explore a forward-thinking question: Is GPT-4V effective at low-level data analysis tasks on charts? To this end, we first curate a large-scale dataset, named ChartInsights, consisti...

3D modeling of biological structures is an inherently complex process, necessitating both biological and geometric understanding. Additionally, the complexity of user interfaces of 3D modeling tools...
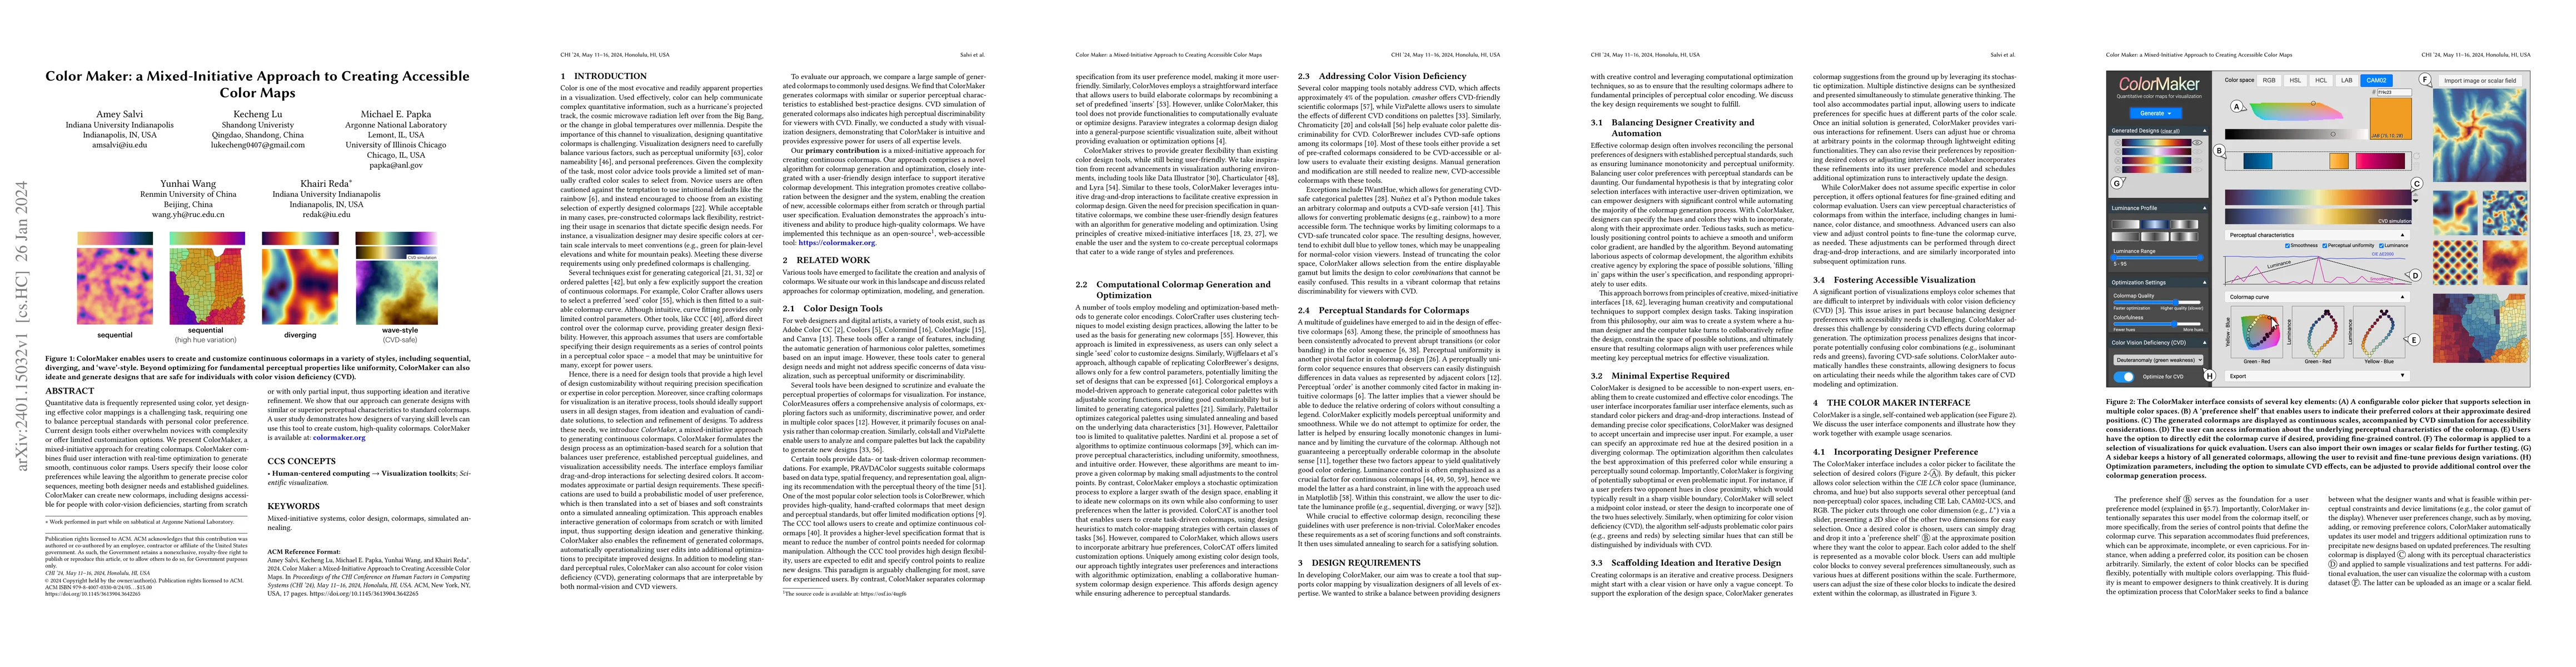
Quantitative data is frequently represented using color, yet designing effective color mappings is a challenging task, requiring one to balance perceptual standards with personal color preference. C...
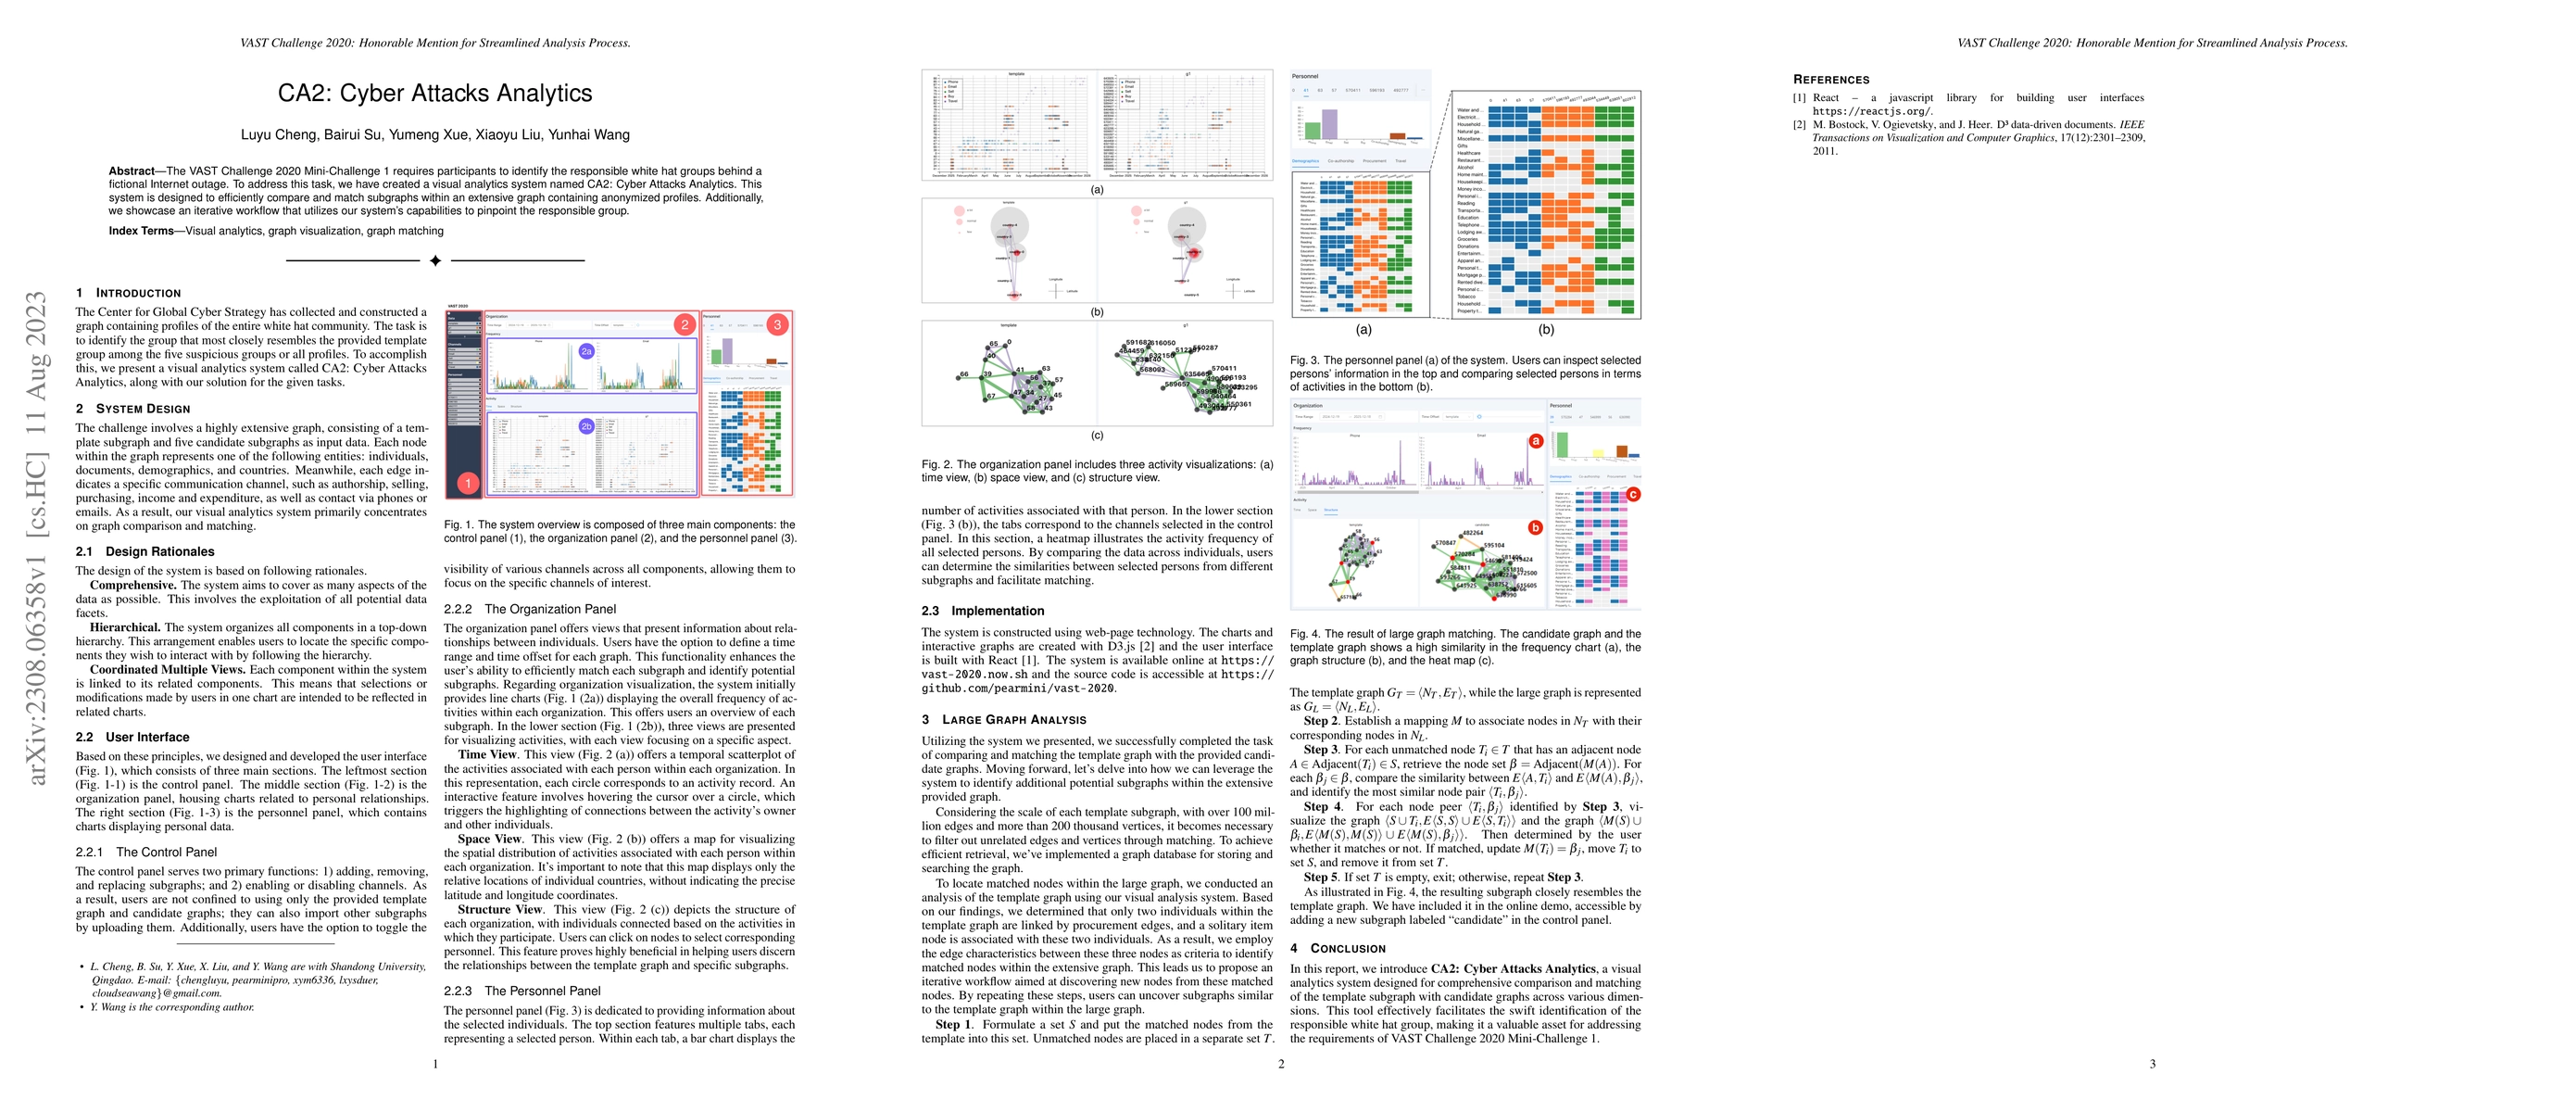
The VAST Challenge 2020 Mini-Challenge 1 requires participants to identify the responsible white hat groups behind a fictional Internet outage. To address this task, we have created a visual analyti...
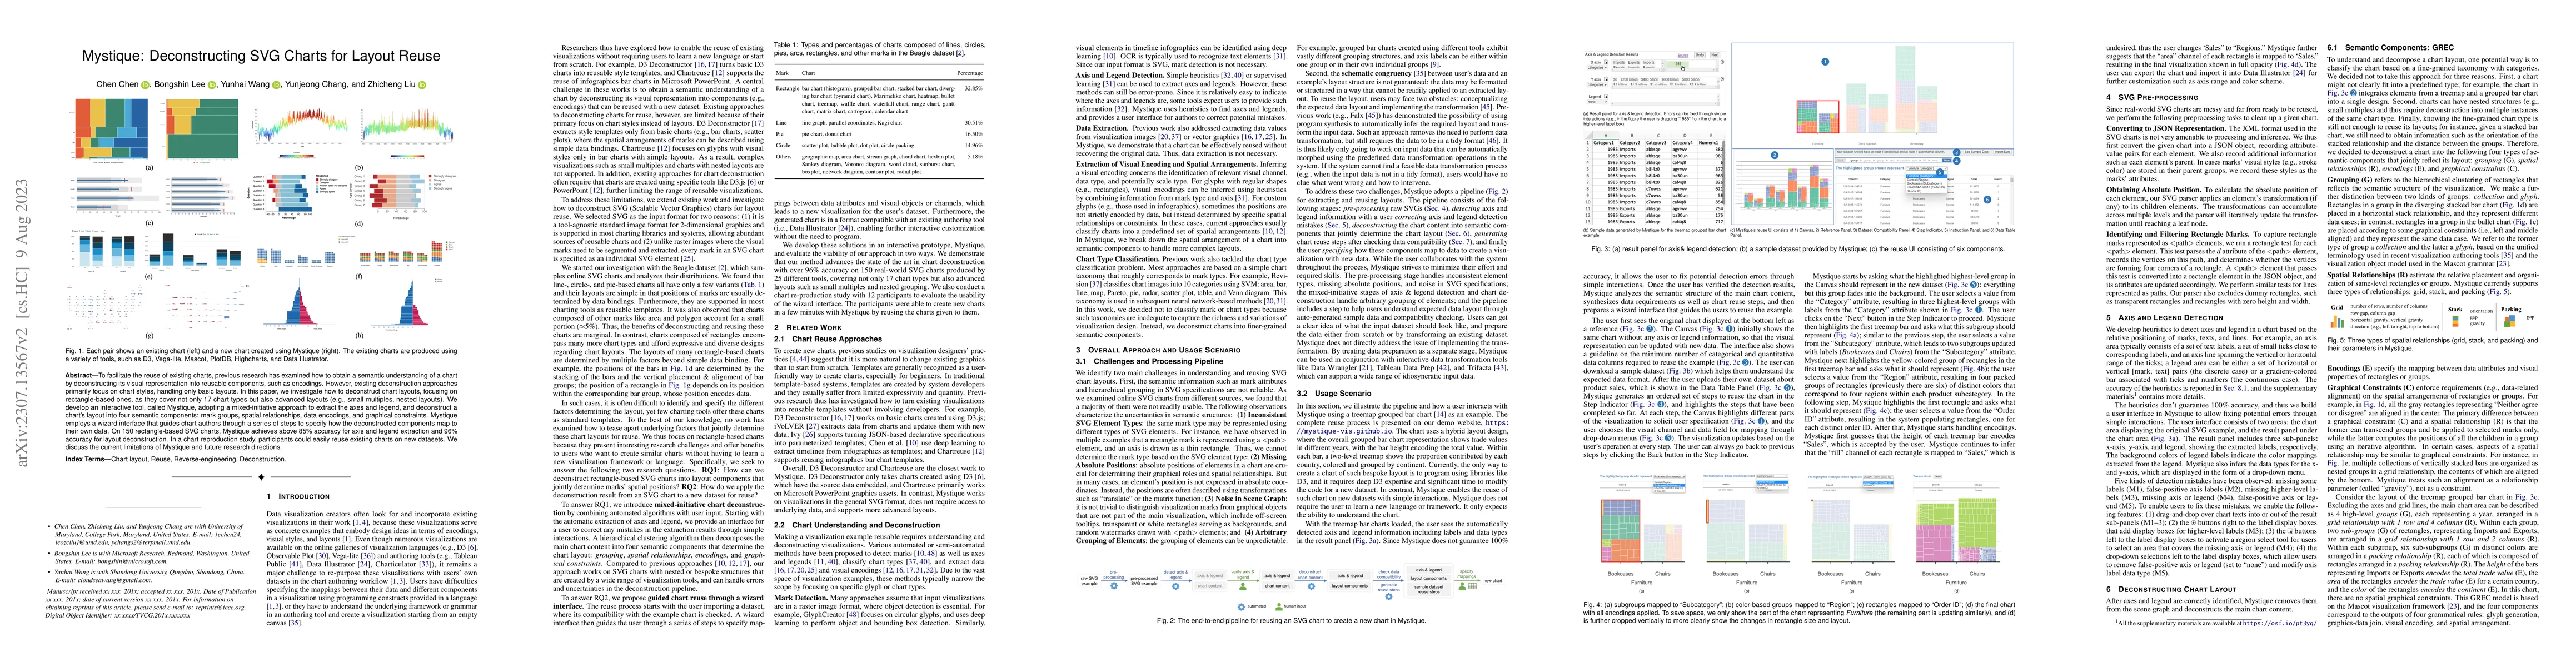
To facilitate the reuse of existing charts, previous research has examined how to obtain a semantic understanding of a chart by deconstructing its visual representation into reusable components, suc...
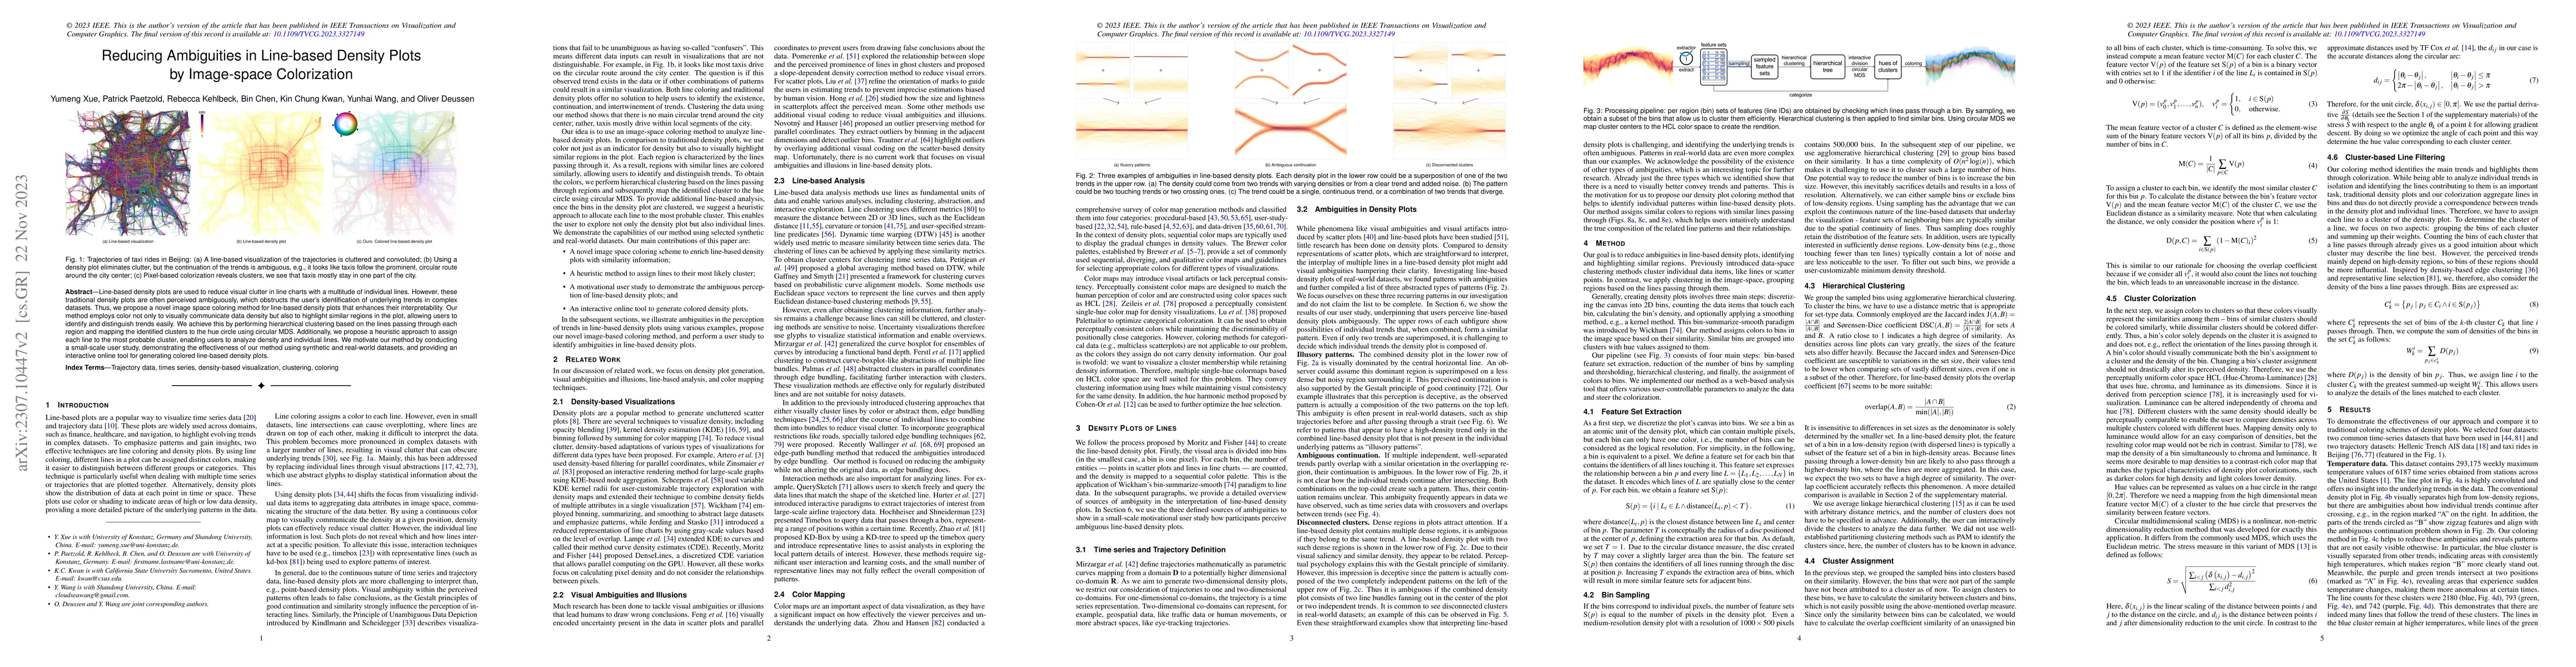
Line-based density plots are used to reduce visual clutter in line charts with a multitude of individual lines. However, these traditional density plots are often perceived ambiguously, which obstru...
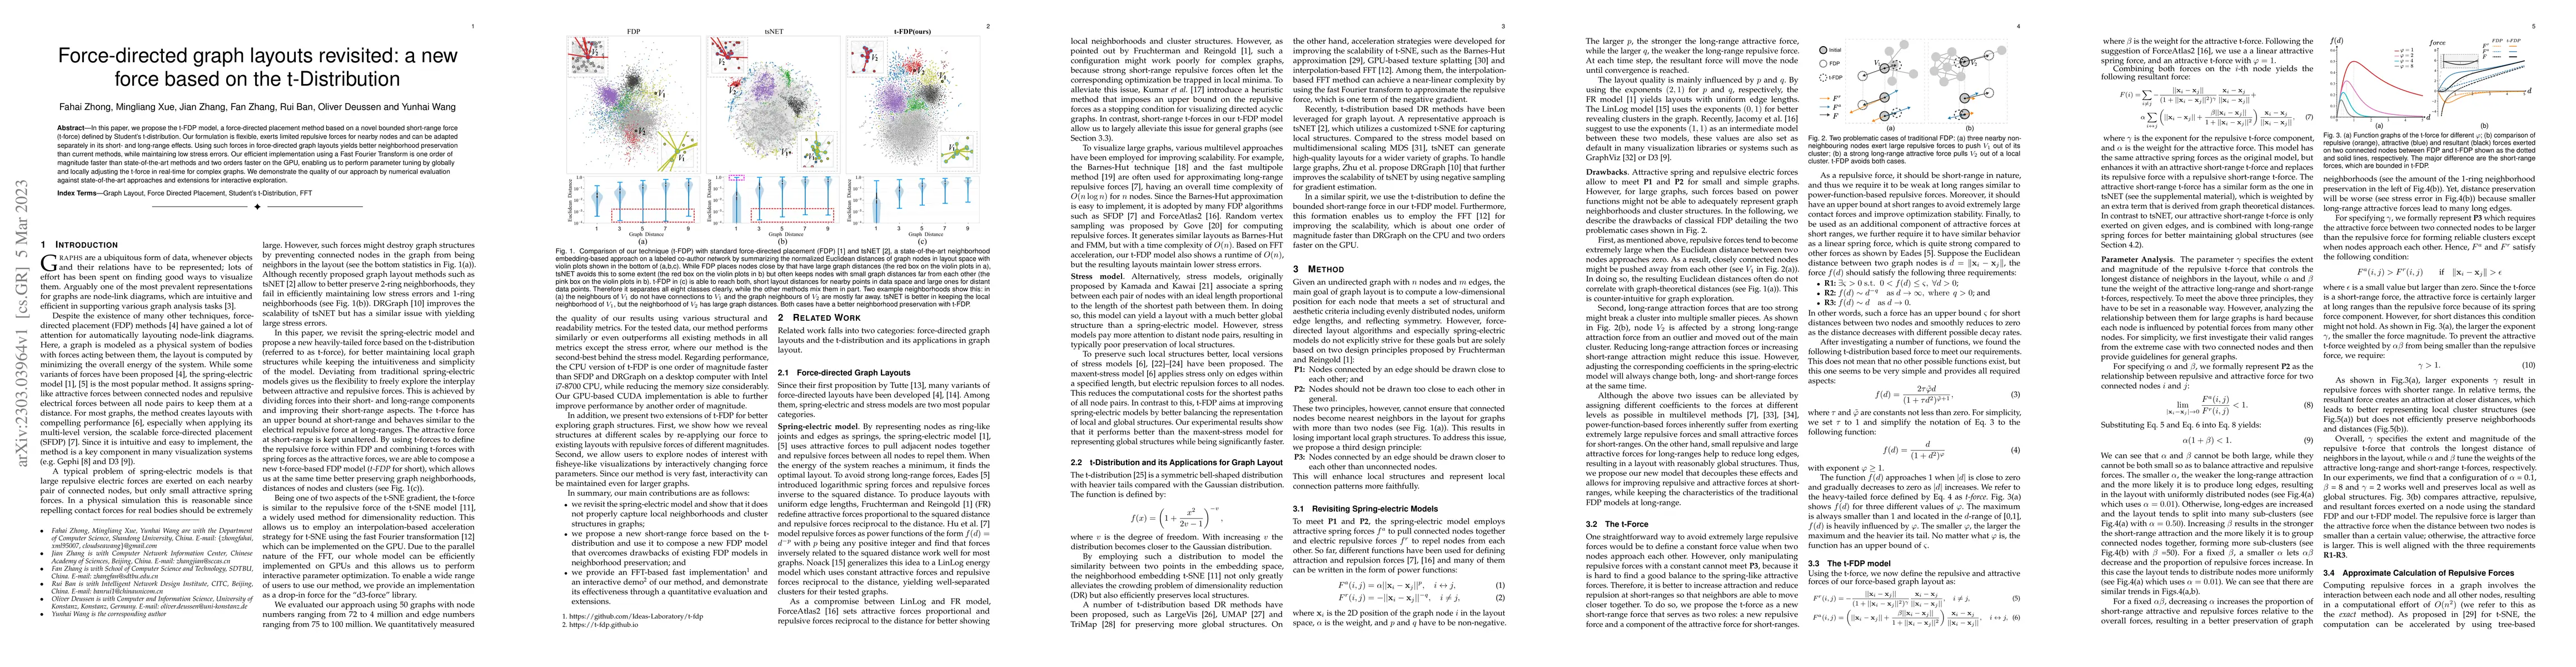
In this paper, we propose the t-FDP model, a force-directed placement method based on a novel bounded short-range force (t-force) defined by Student's t-distribution. Our formulation is flexible, ex...
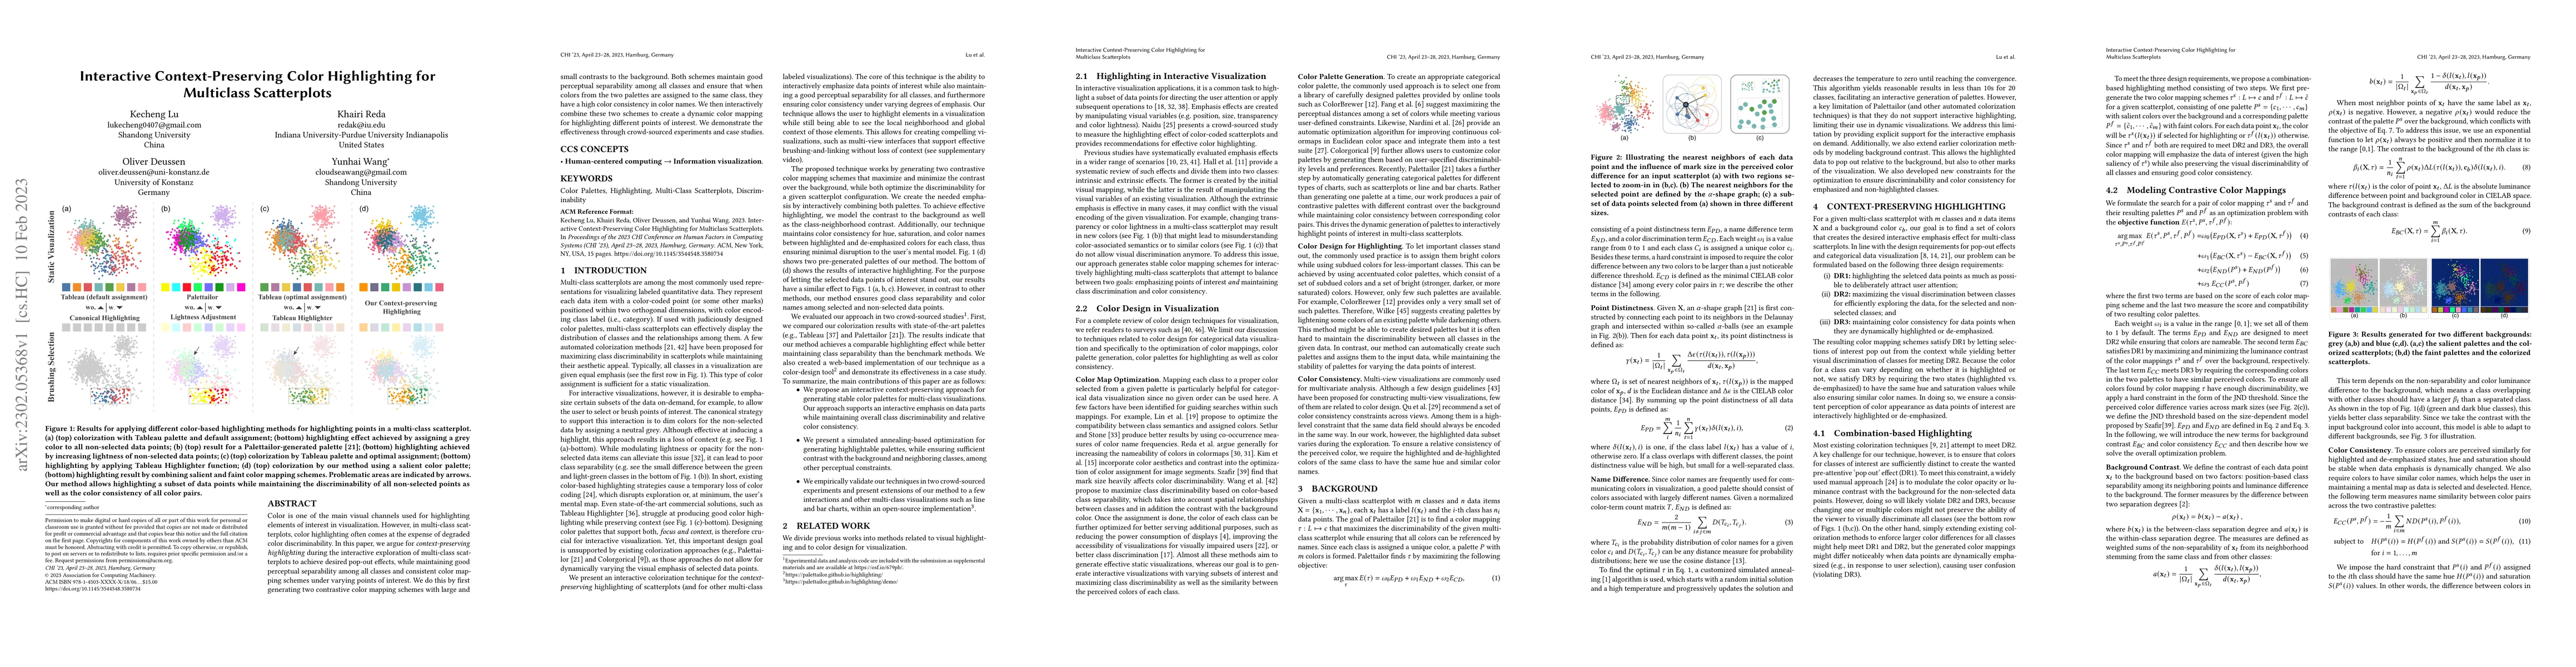
Color is one of the main visual channels used for highlighting elements of interest in visualization. However, in multi-class scatterplots, color highlighting often comes at the expense of degraded ...
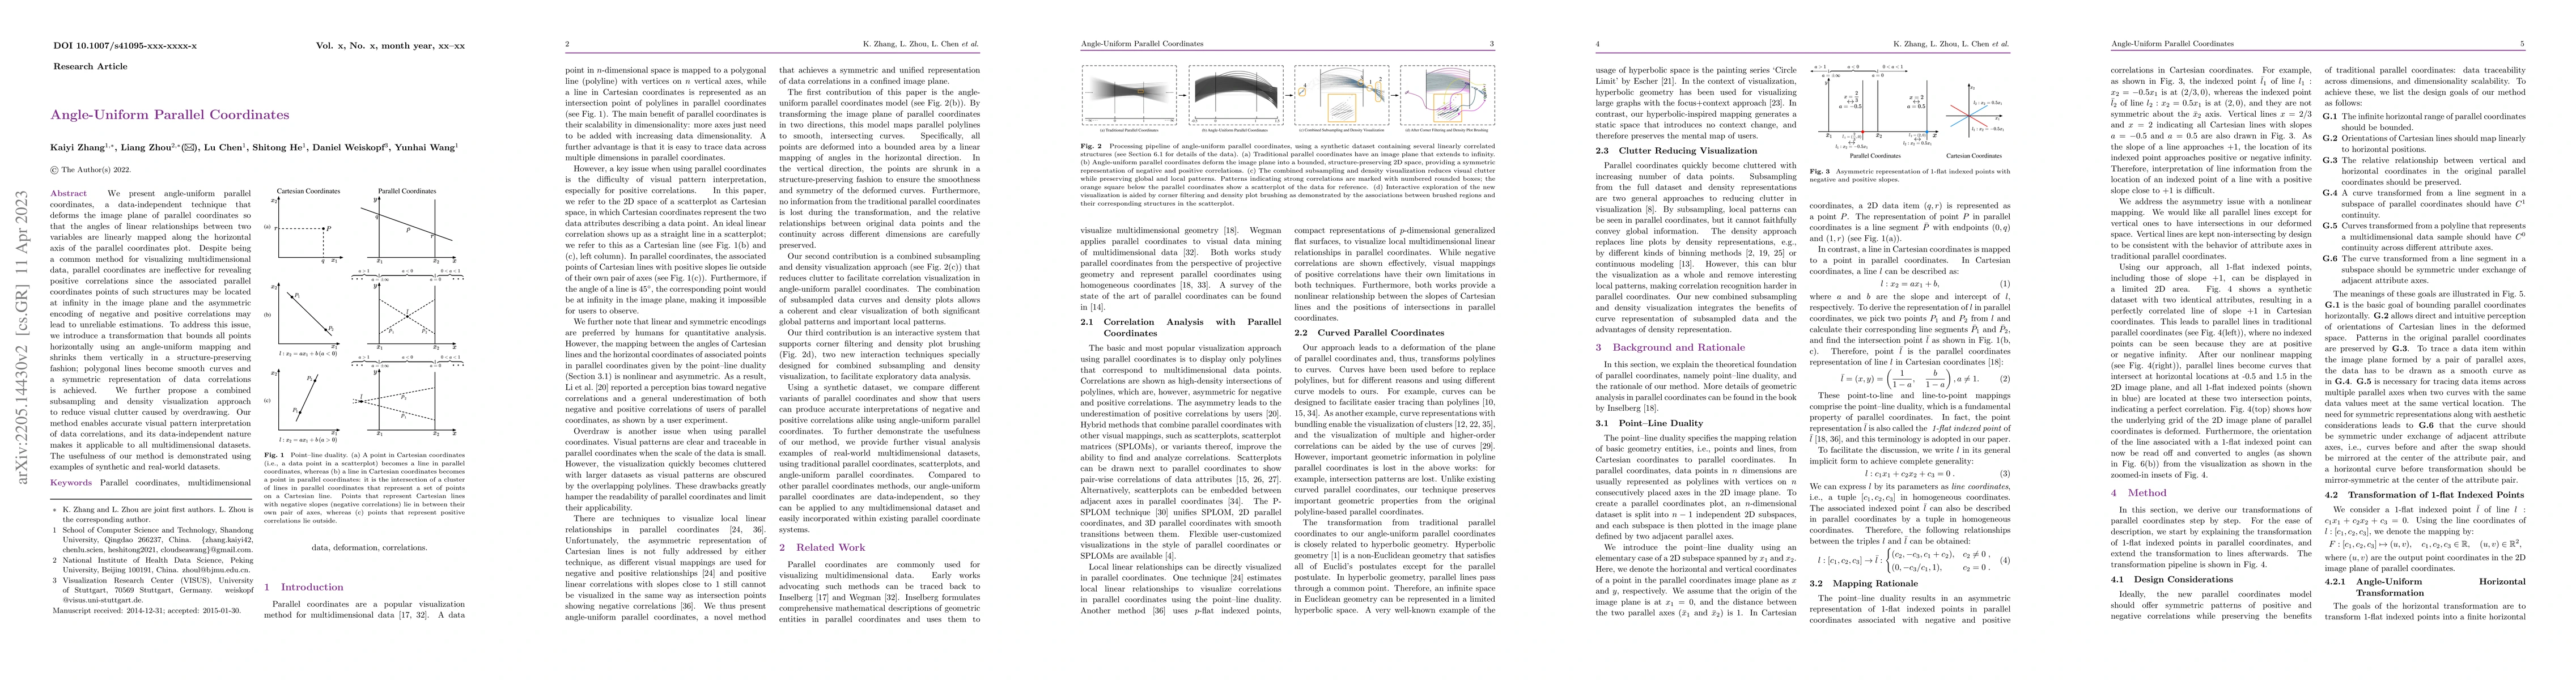
We present angle-uniform parallel coordinates, a data-independent technique that deforms the image plane of parallel coordinates so that the angles of linear relationships between two variables are ...
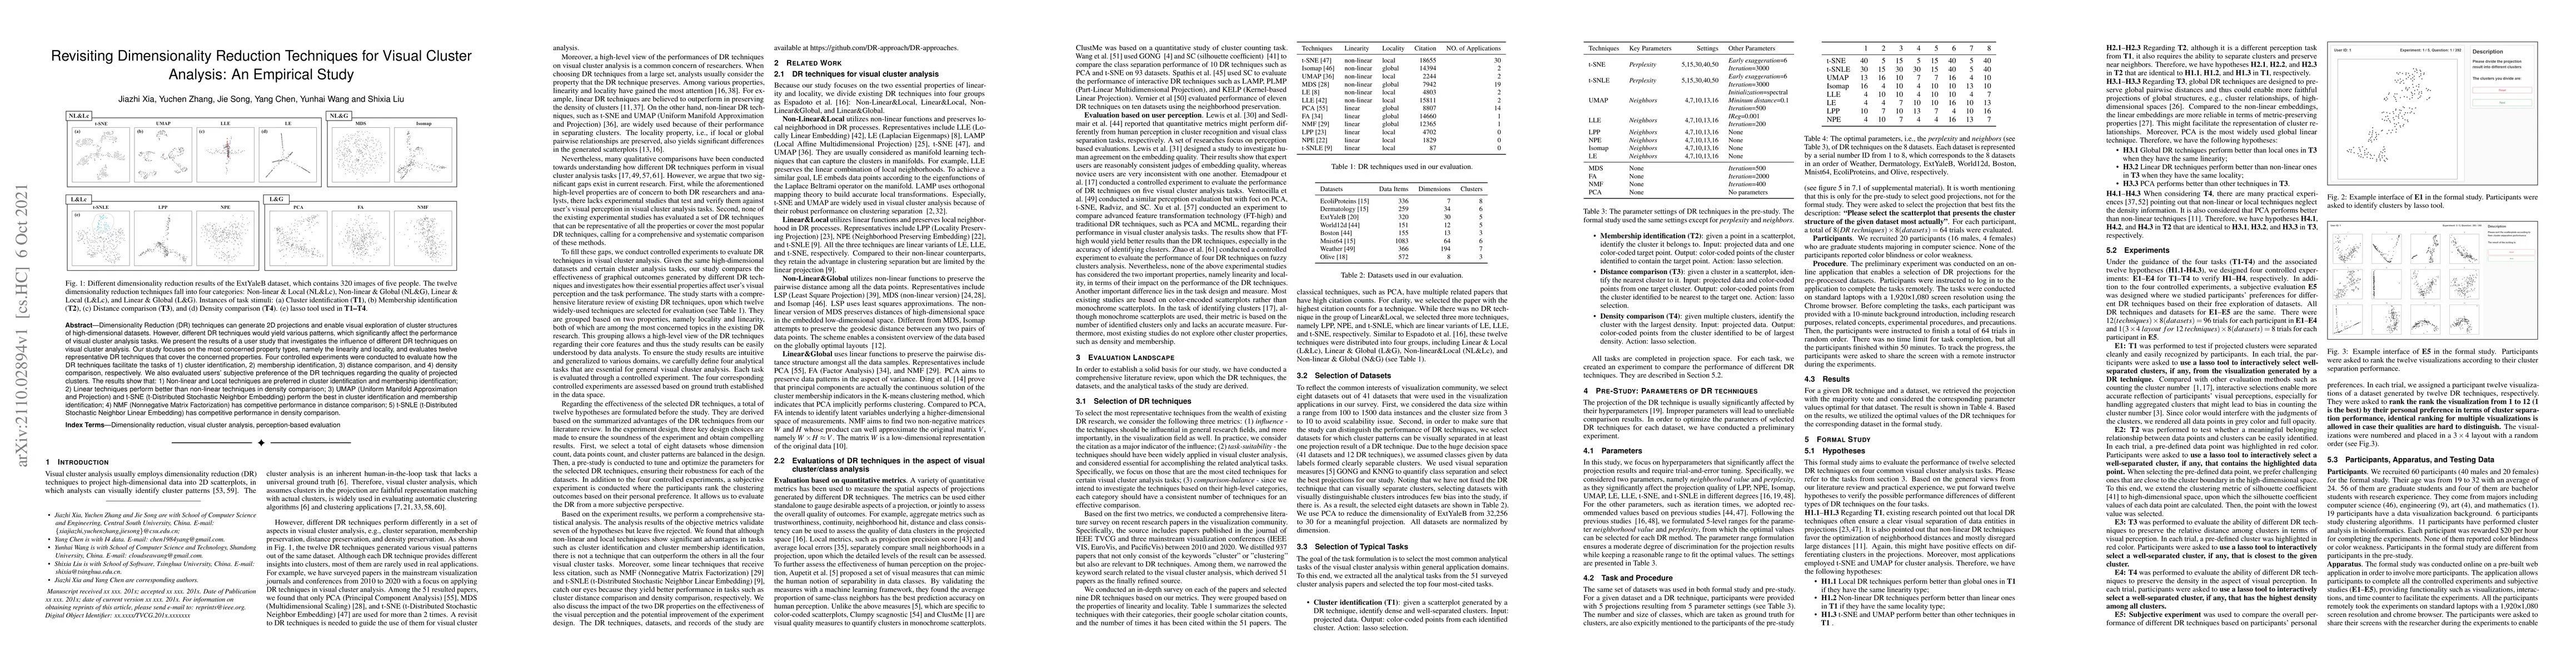
Dimensionality Reduction (DR) techniques can generate 2D projections and enable visual exploration of cluster structures of high-dimensional datasets. However, different DR techniques would yield va...
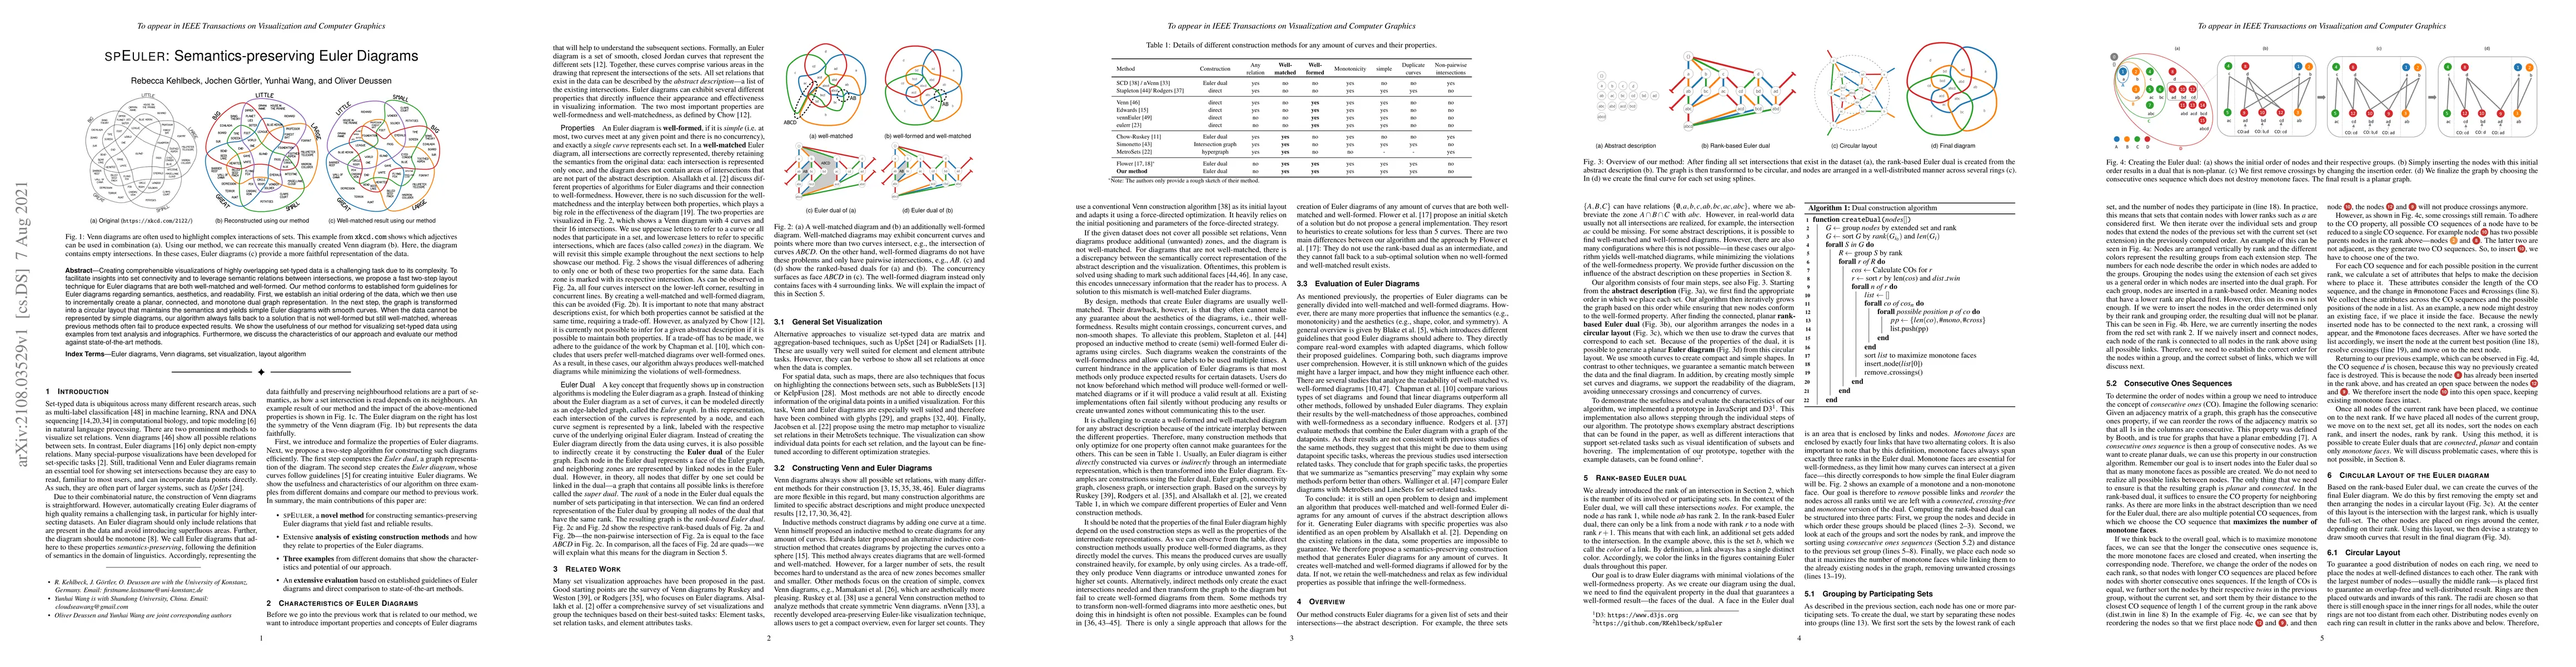
Creating comprehensible visualizations of highly overlapping set-typed data is a challenging task due to its complexity. To facilitate insights into set connectivity and to leverage semantic relatio...
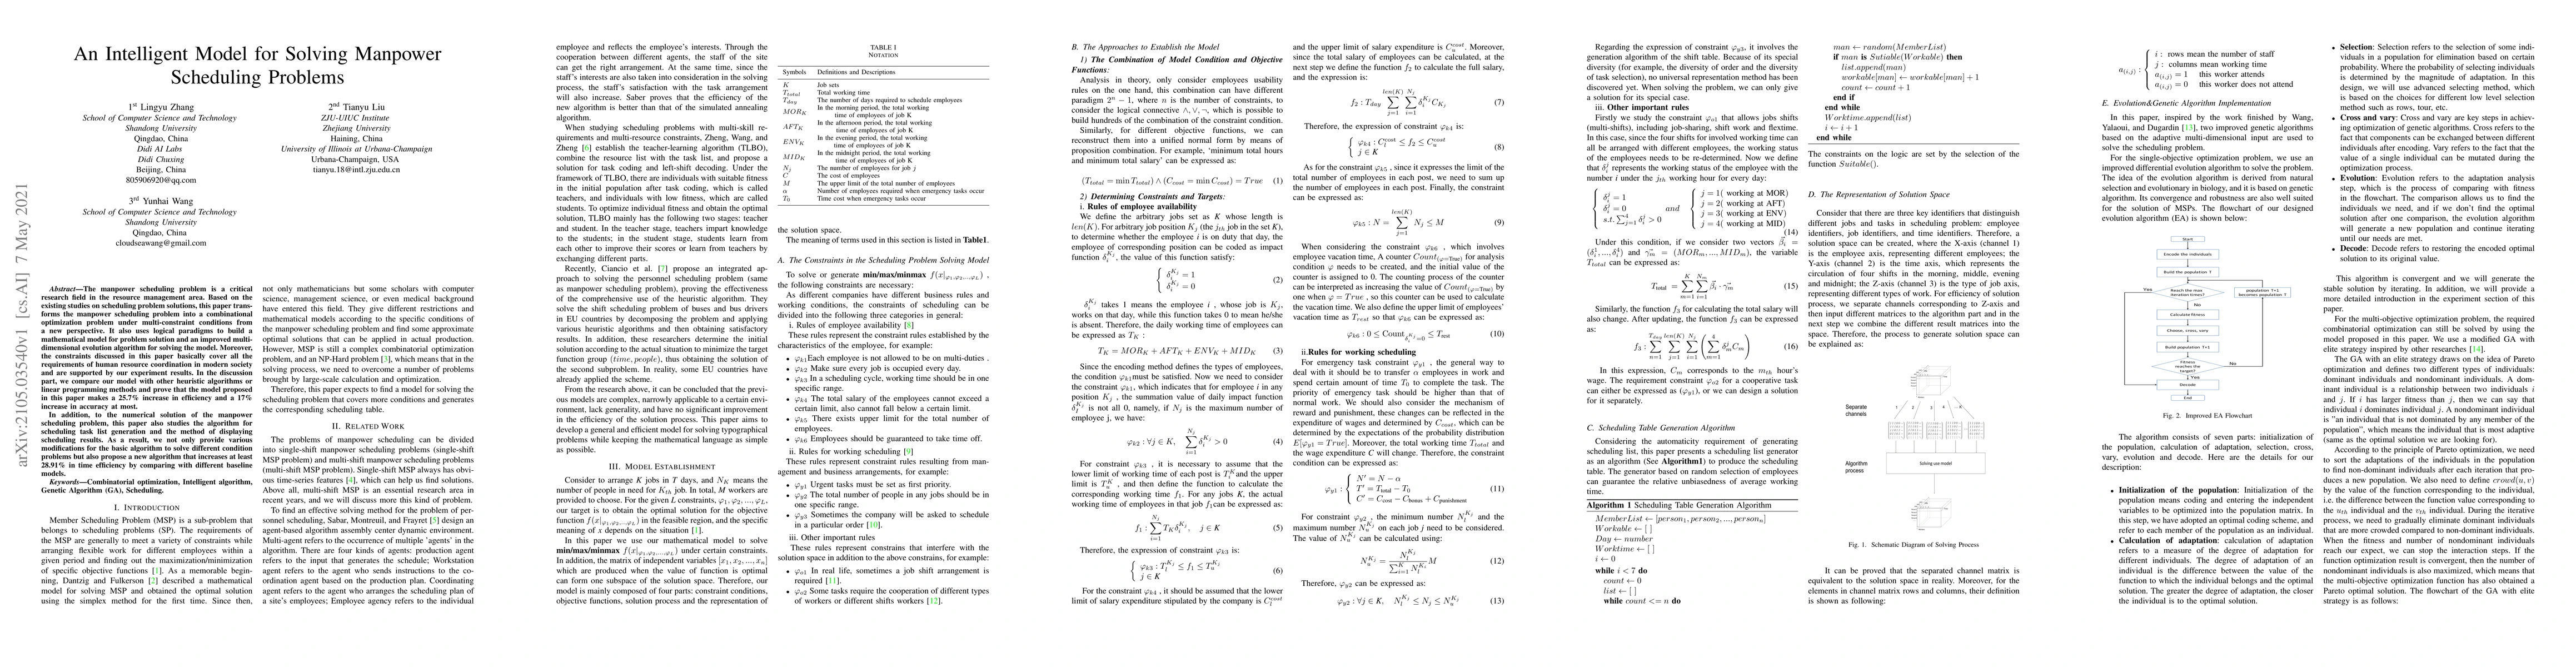
The manpower scheduling problem is a critical research field in the resource management area. Based on the existing studies on scheduling problem solutions, this paper transforms the manpower schedu...
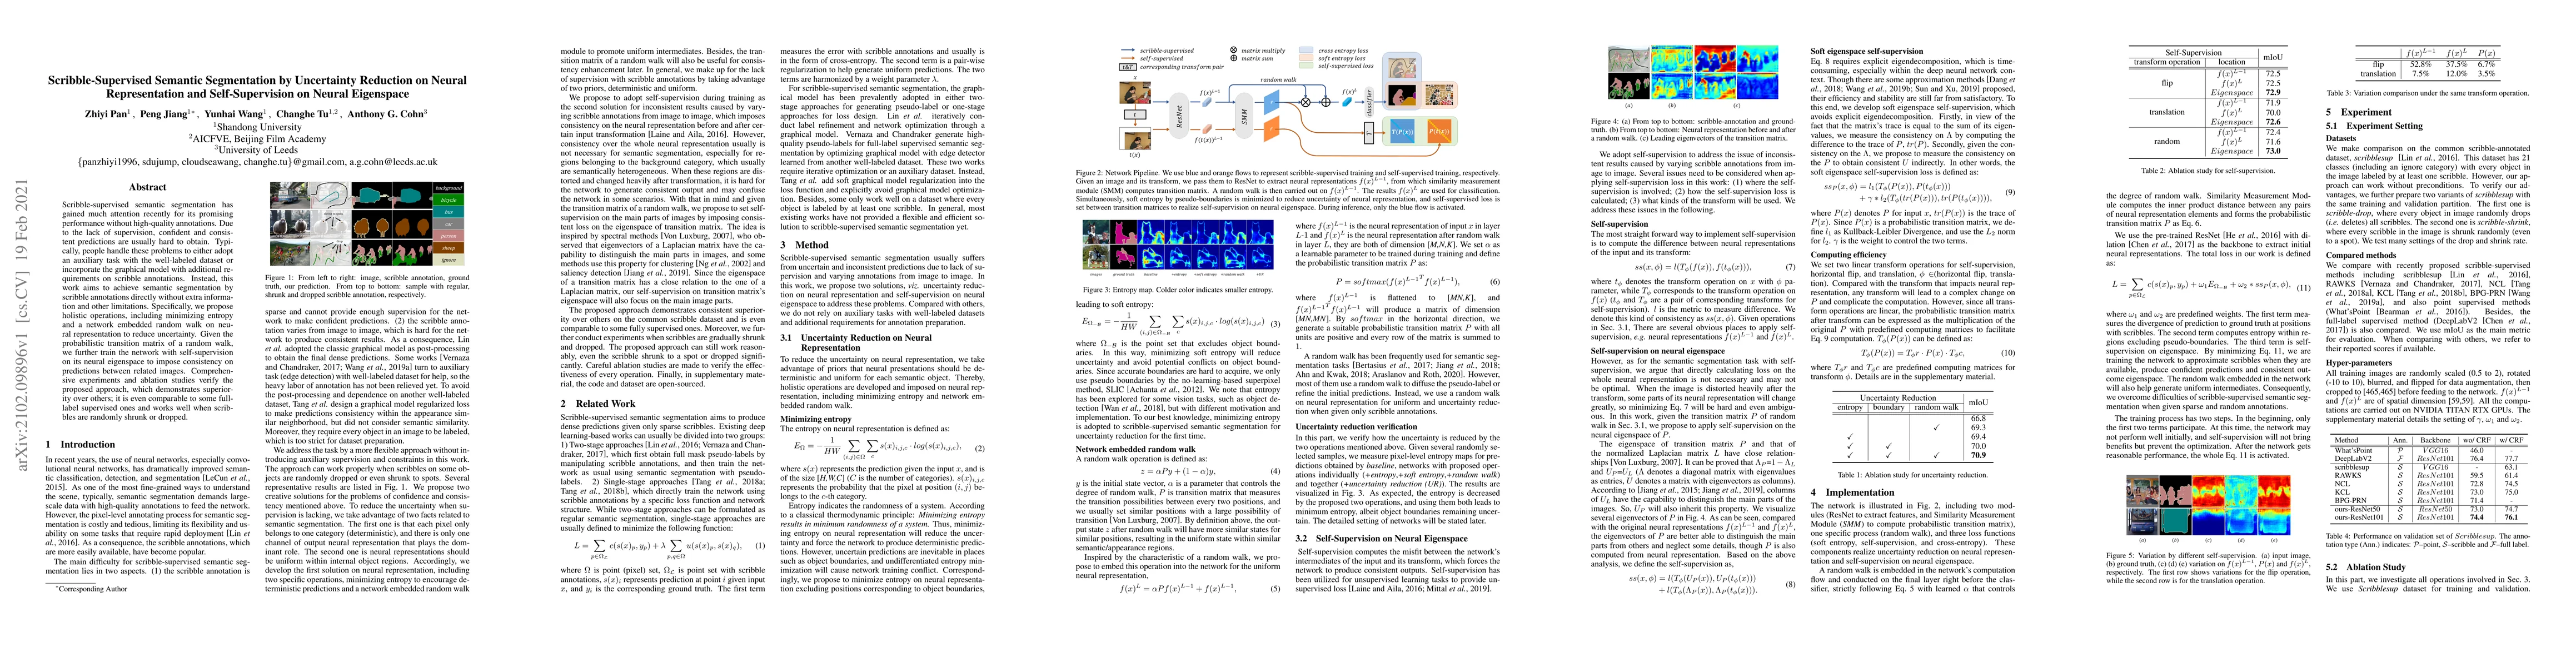
Scribble-supervised semantic segmentation has gained much attention recently for its promising performance without high-quality annotations. Due to the lack of supervision, confident and consistent ...
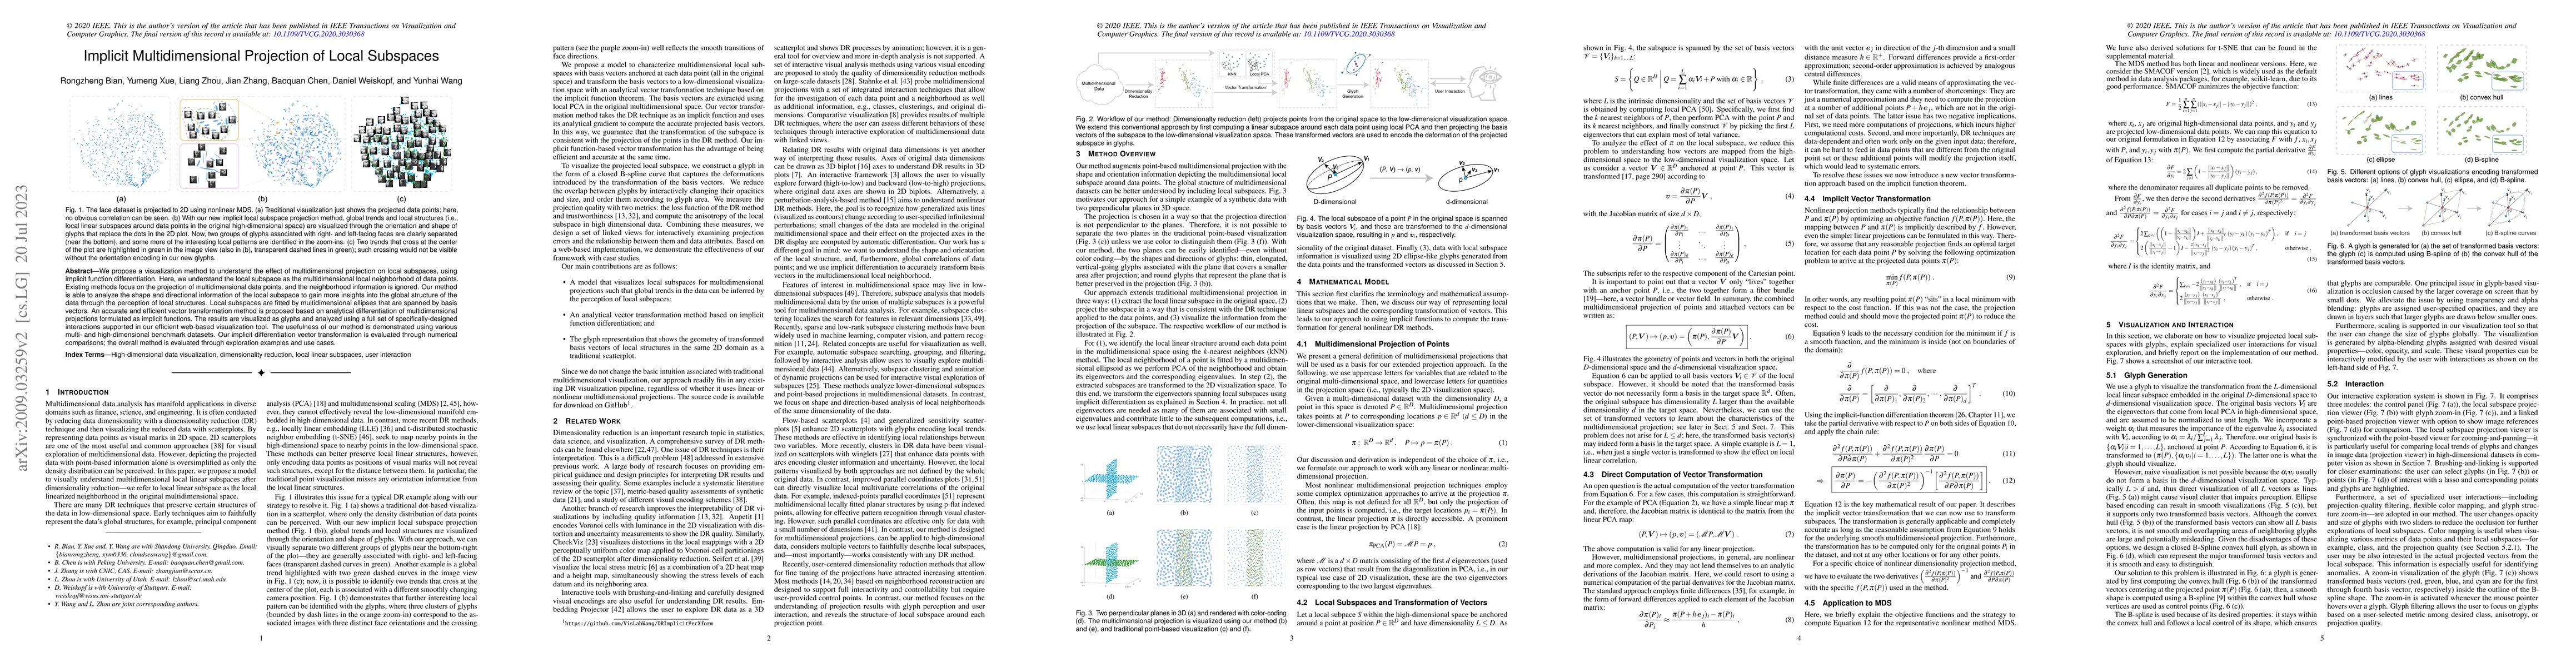
We propose a visualization method to understand the effect of multidimensional projection on local subspaces, using implicit function differentiation. Here, we understand the local subspace as the m...
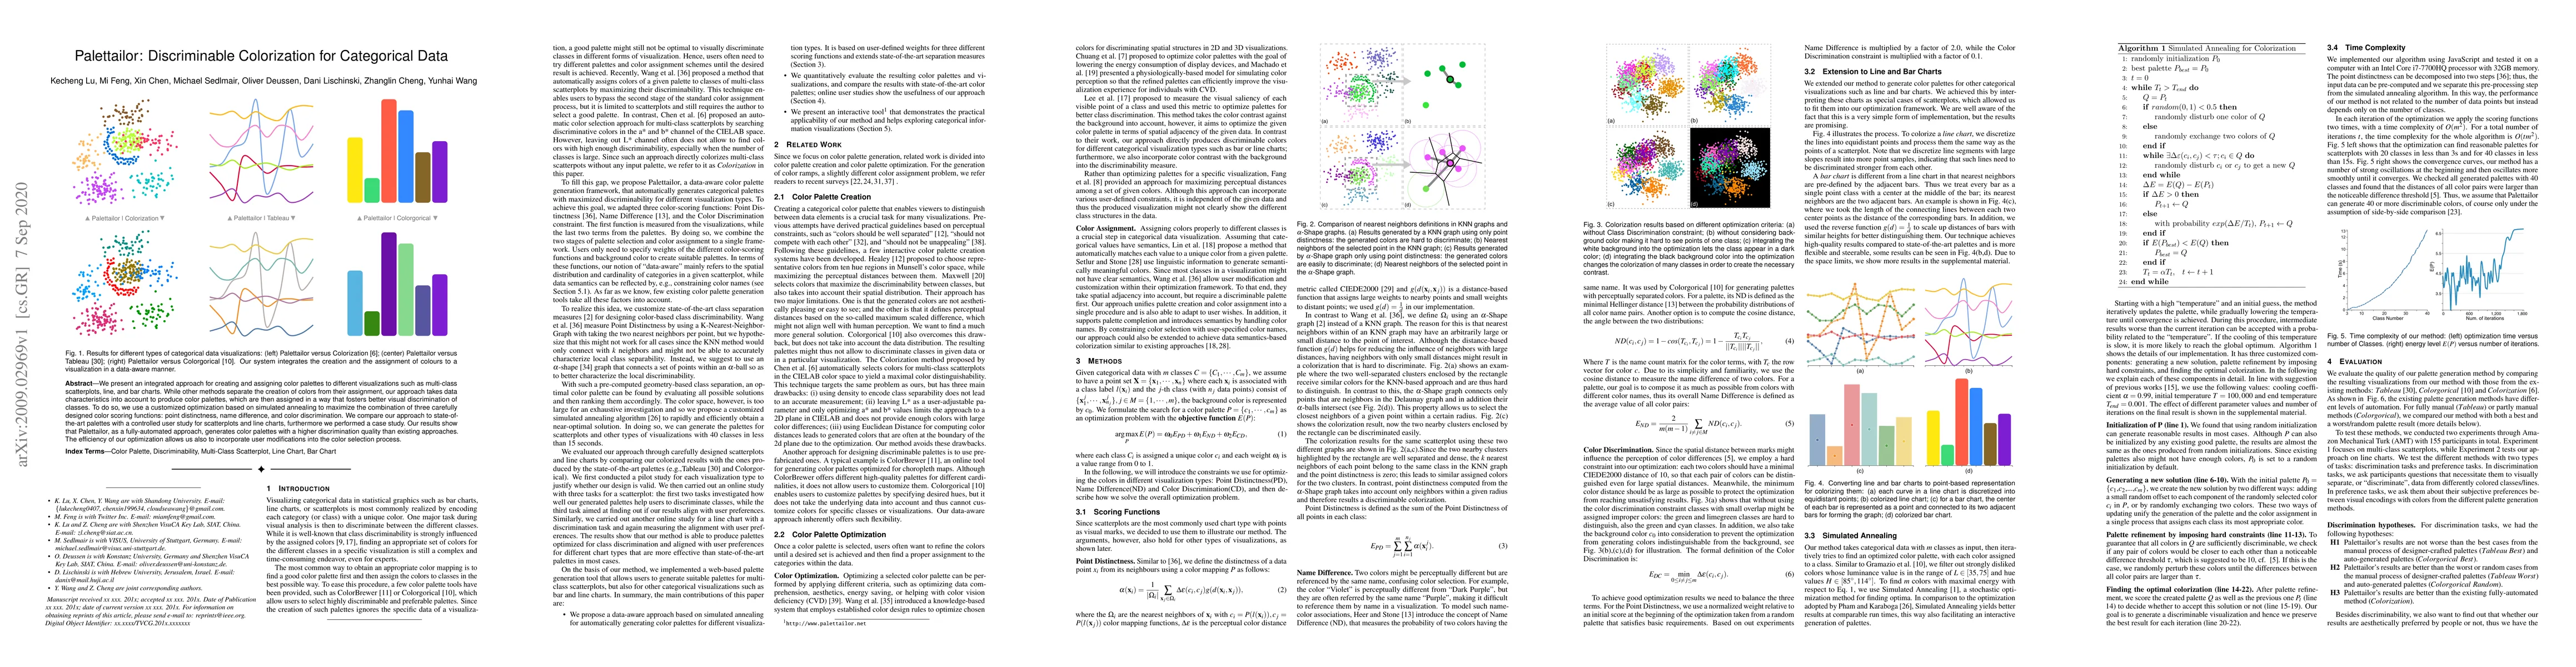
We present an integrated approach for creating and assigning color palettes to different visualizations such as multi-class scatterplots, line, and bar charts. While other methods separate the creat...
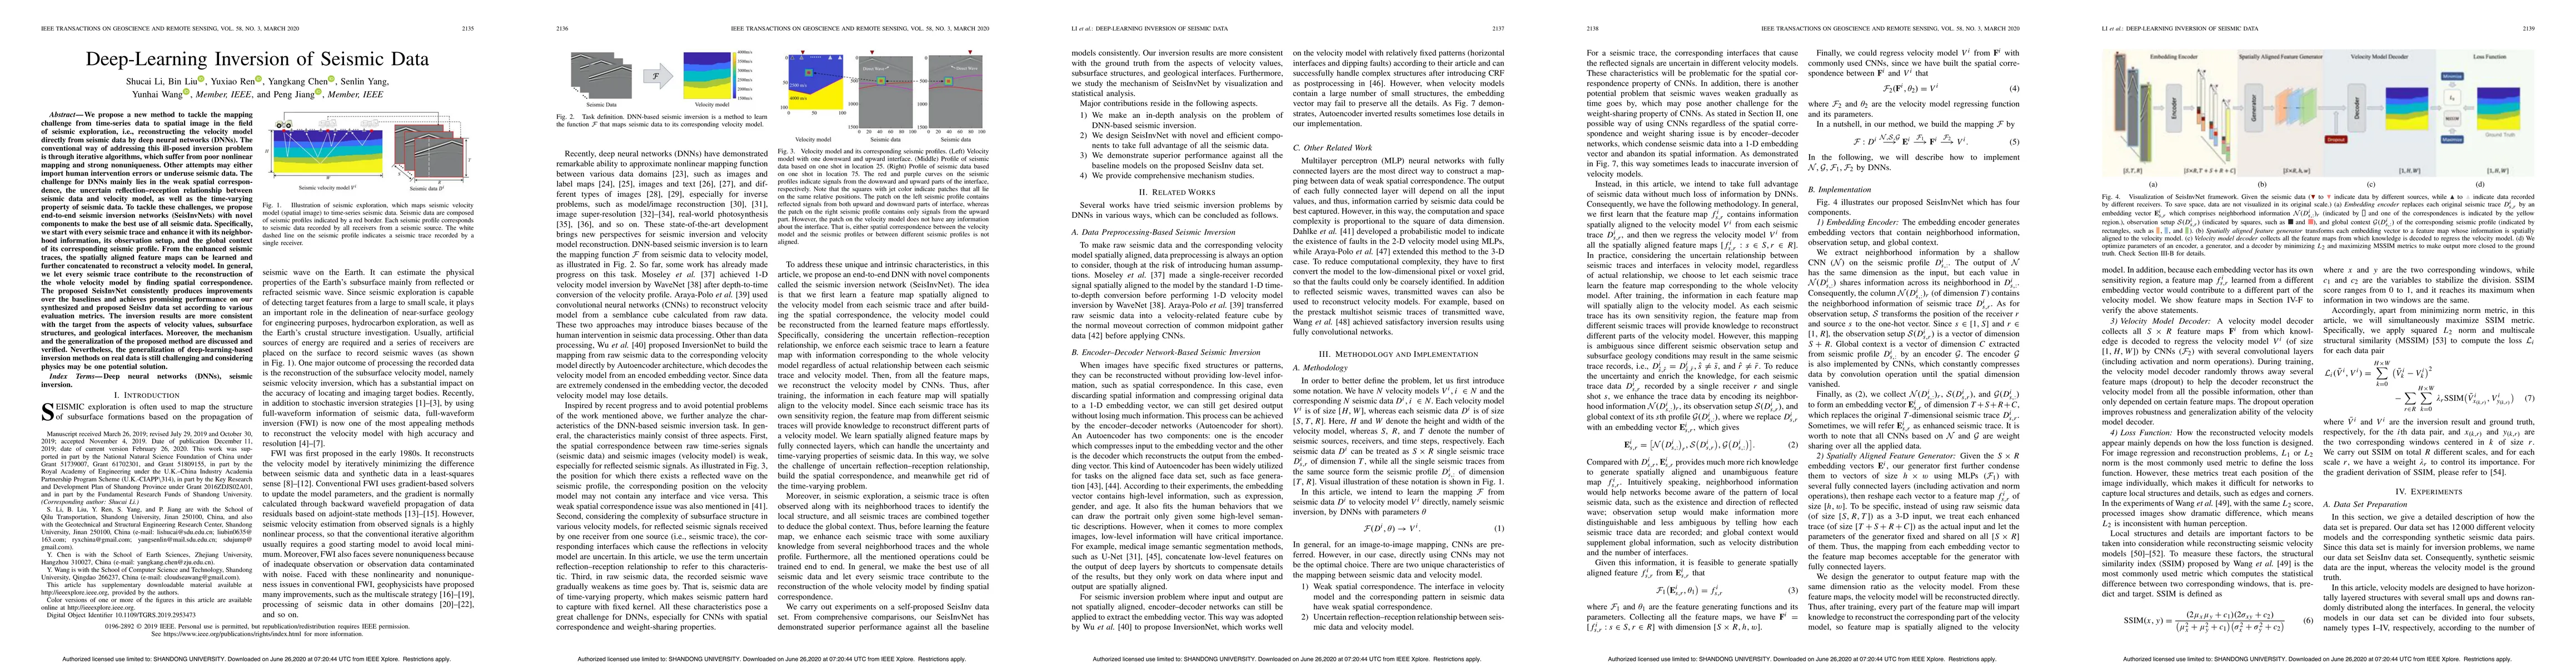
We propose a new method to tackle the mapping challenge from time-series data to spatial image in the field of seismic exploration, i.e., reconstructing the velocity model directly from seismic data...
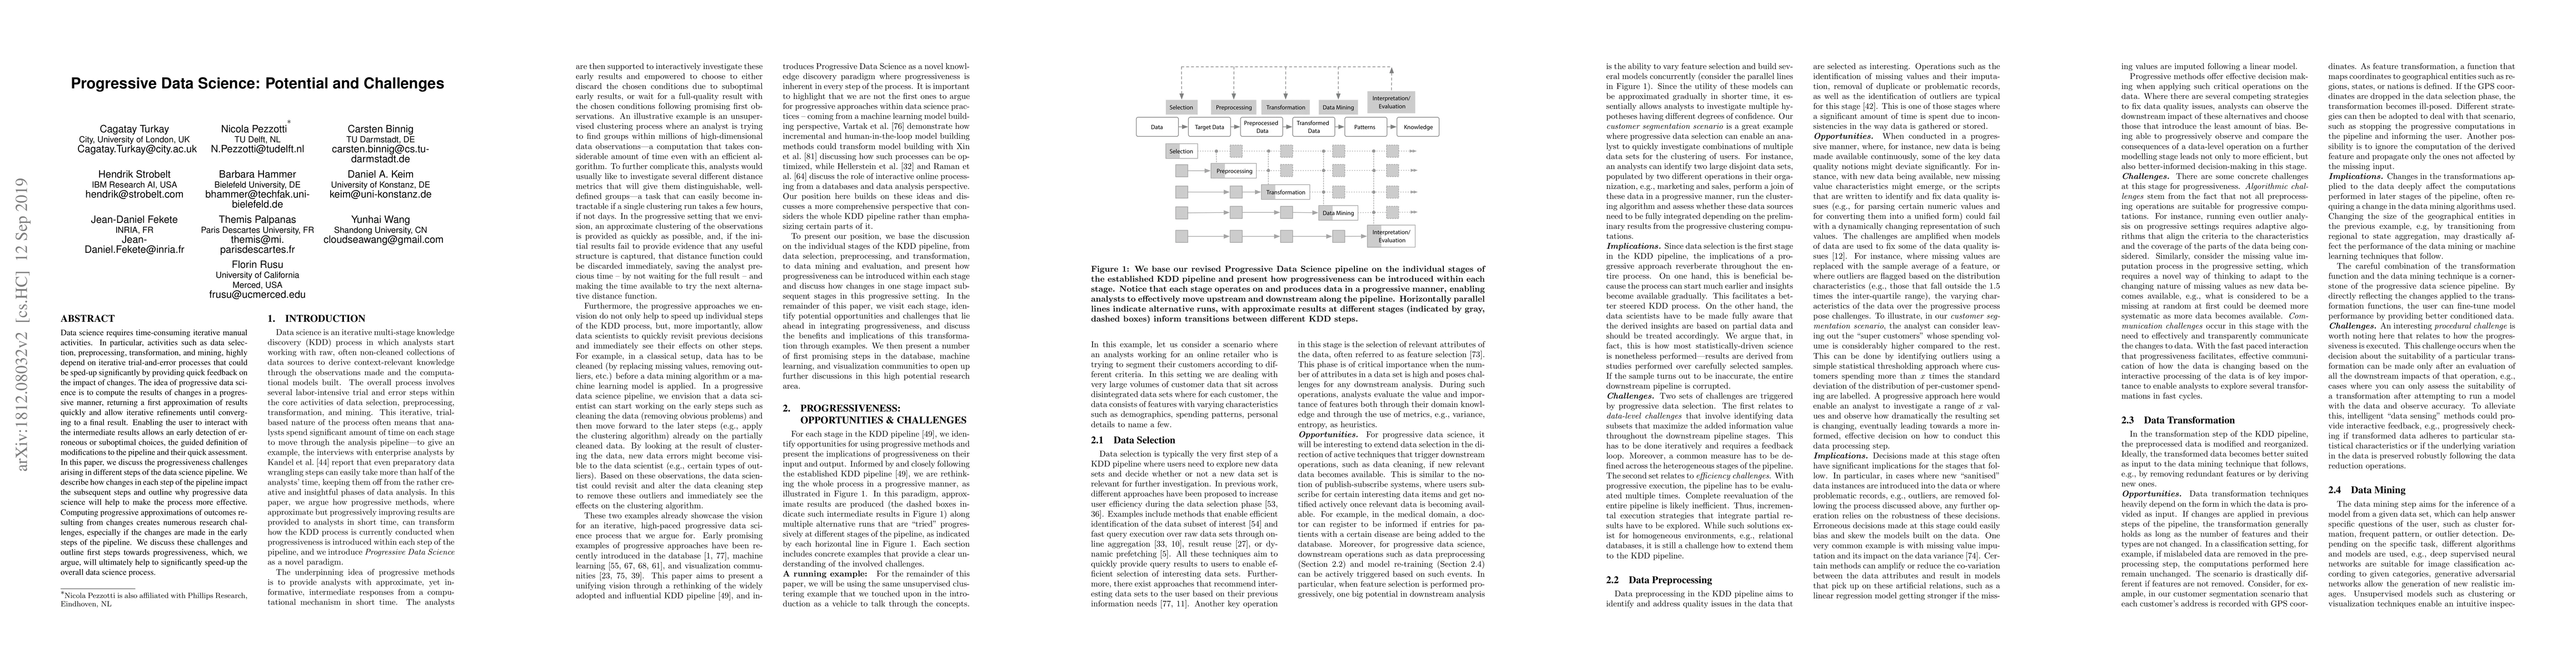
Data science requires time-consuming iterative manual activities. In particular, activities such as data selection, preprocessing, transformation, and mining, highly depend on iterative trial-and-er...
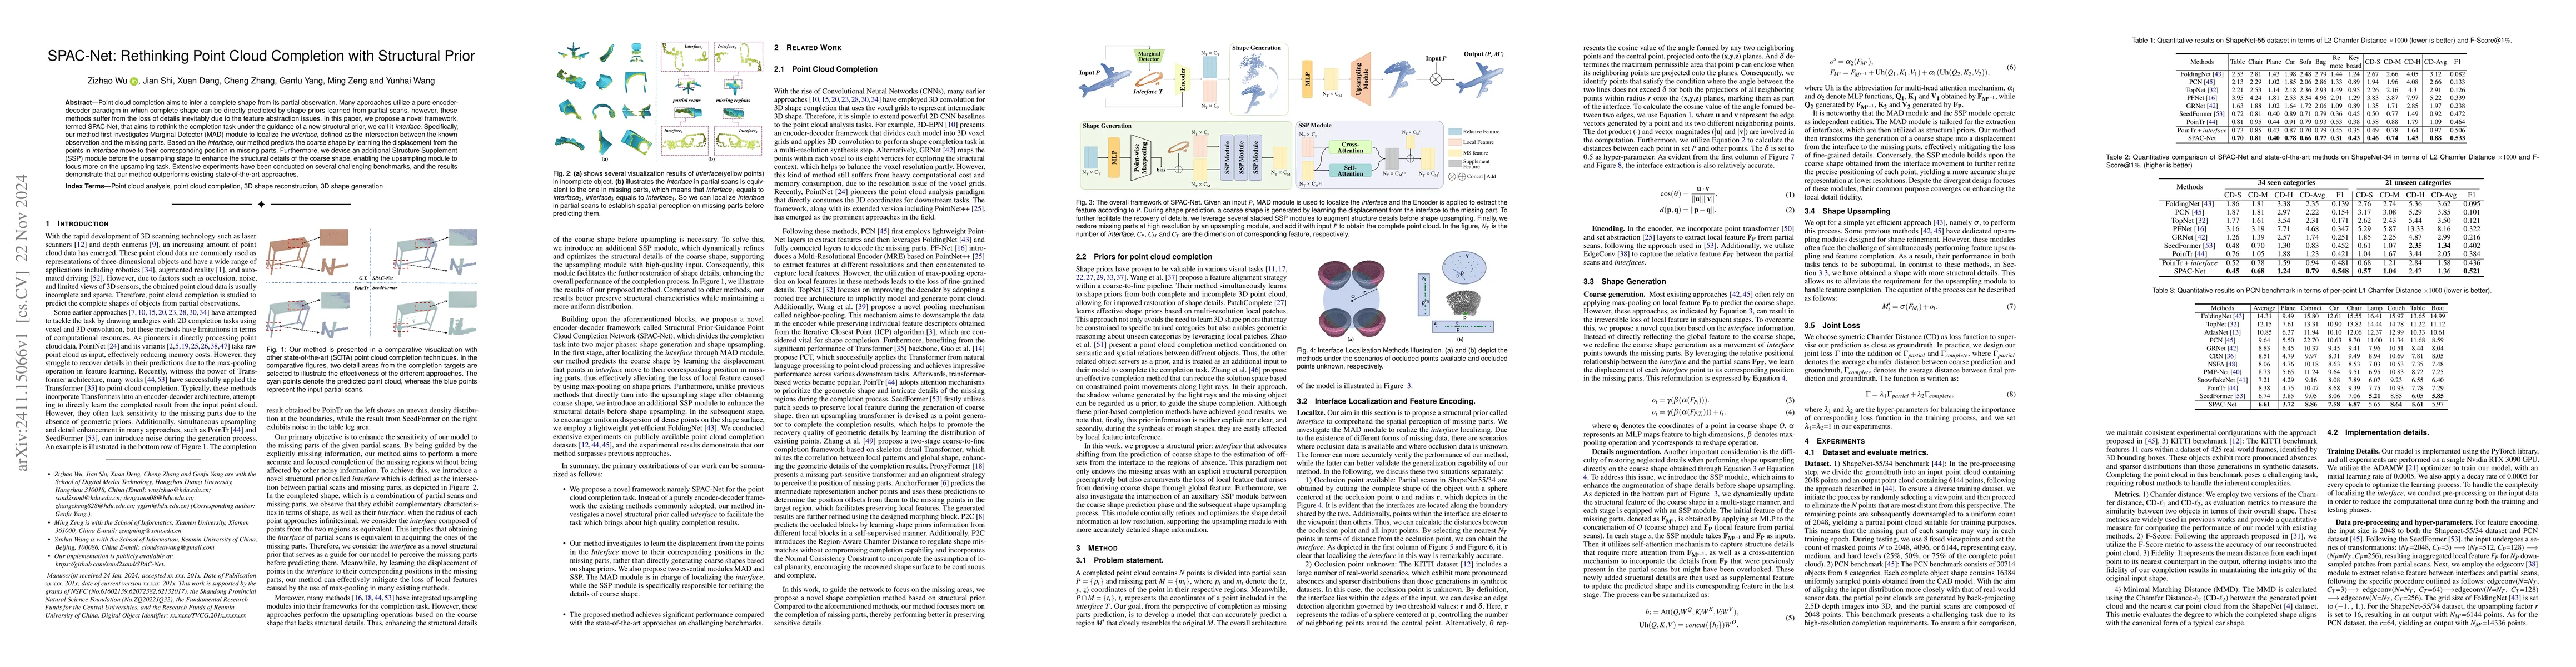
Point cloud completion aims to infer a complete shape from its partial observation. Many approaches utilize a pure encoderdecoder paradigm in which complete shape can be directly predicted by shape pr...
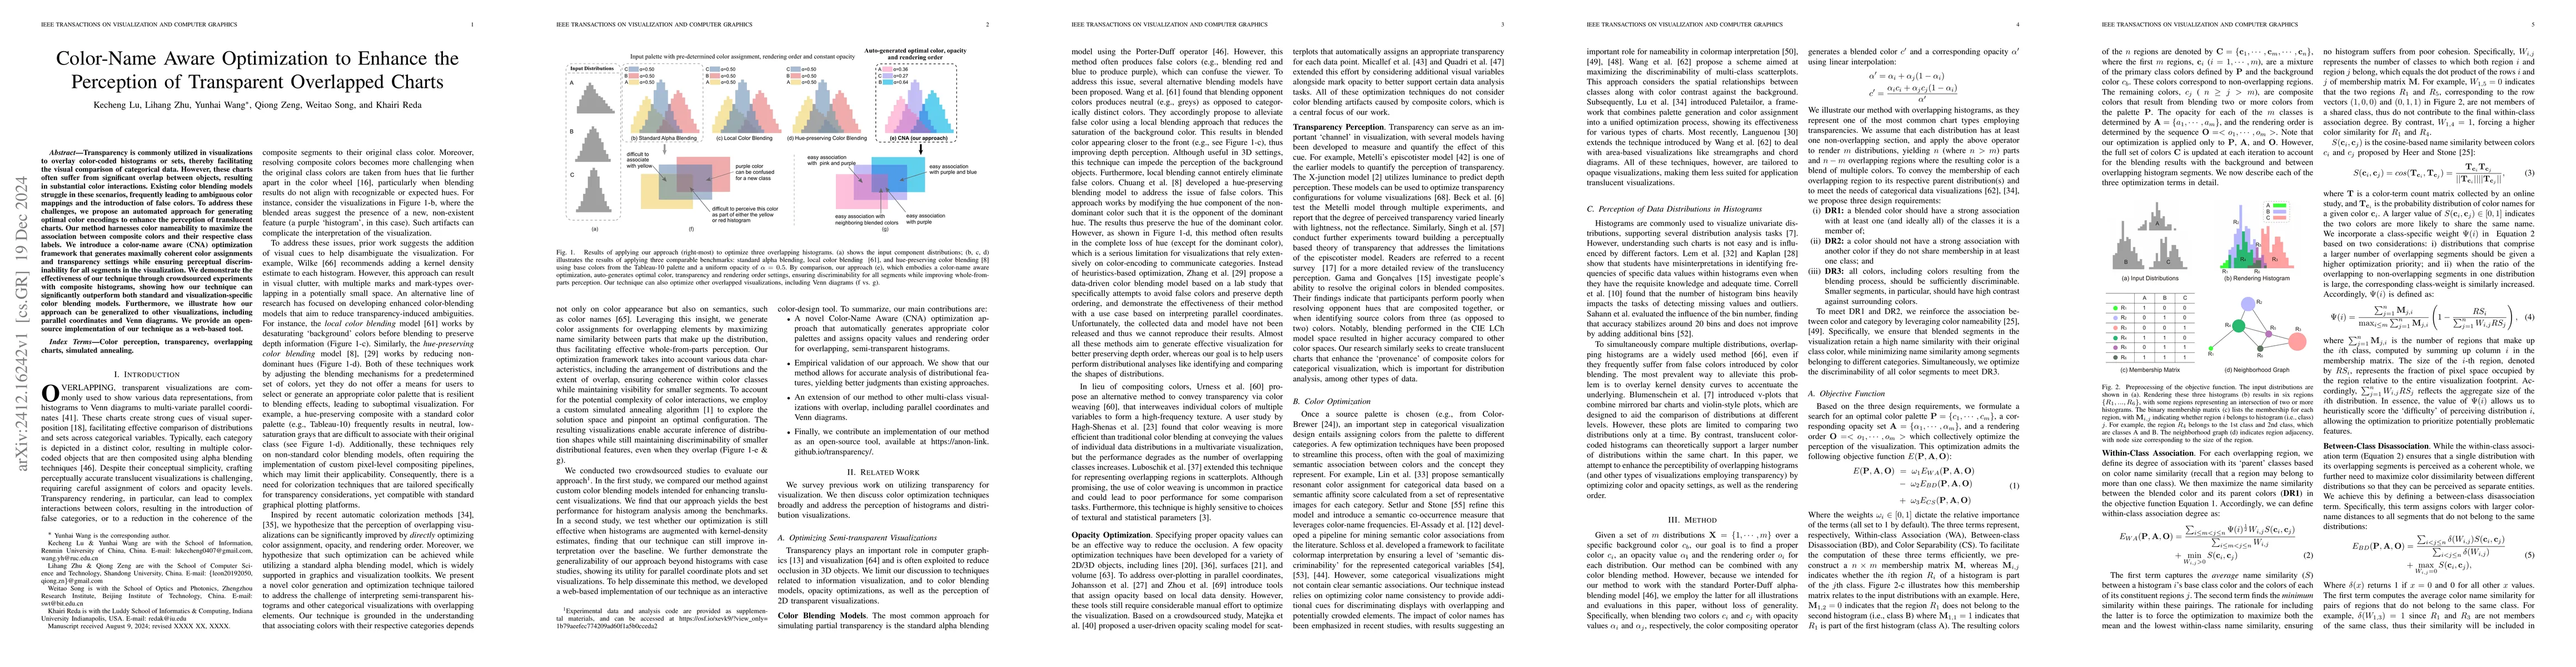
Transparency is commonly utilized in visualizations to overlay color-coded histograms or sets, thereby facilitating the visual comparison of categorical data. However, these charts often suffer from s...
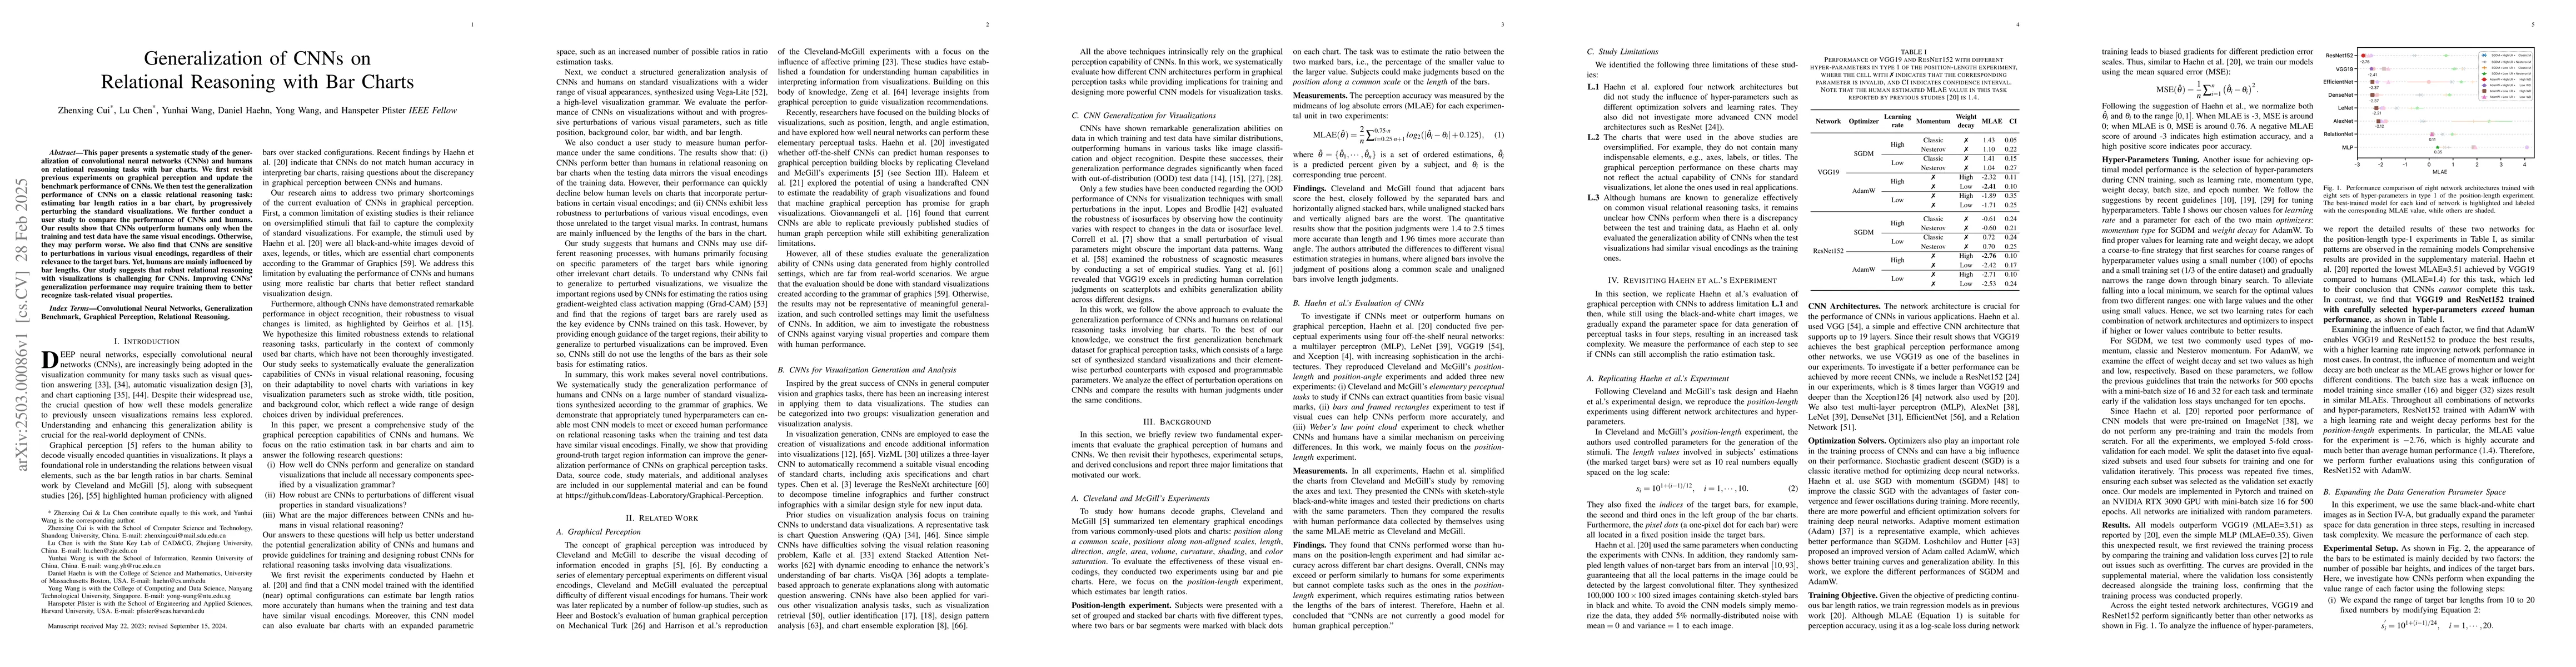
This paper presents a systematic study of the generalization of convolutional neural networks (CNNs) and humans on relational reasoning tasks with bar charts. We first revisit previous experiments on ...
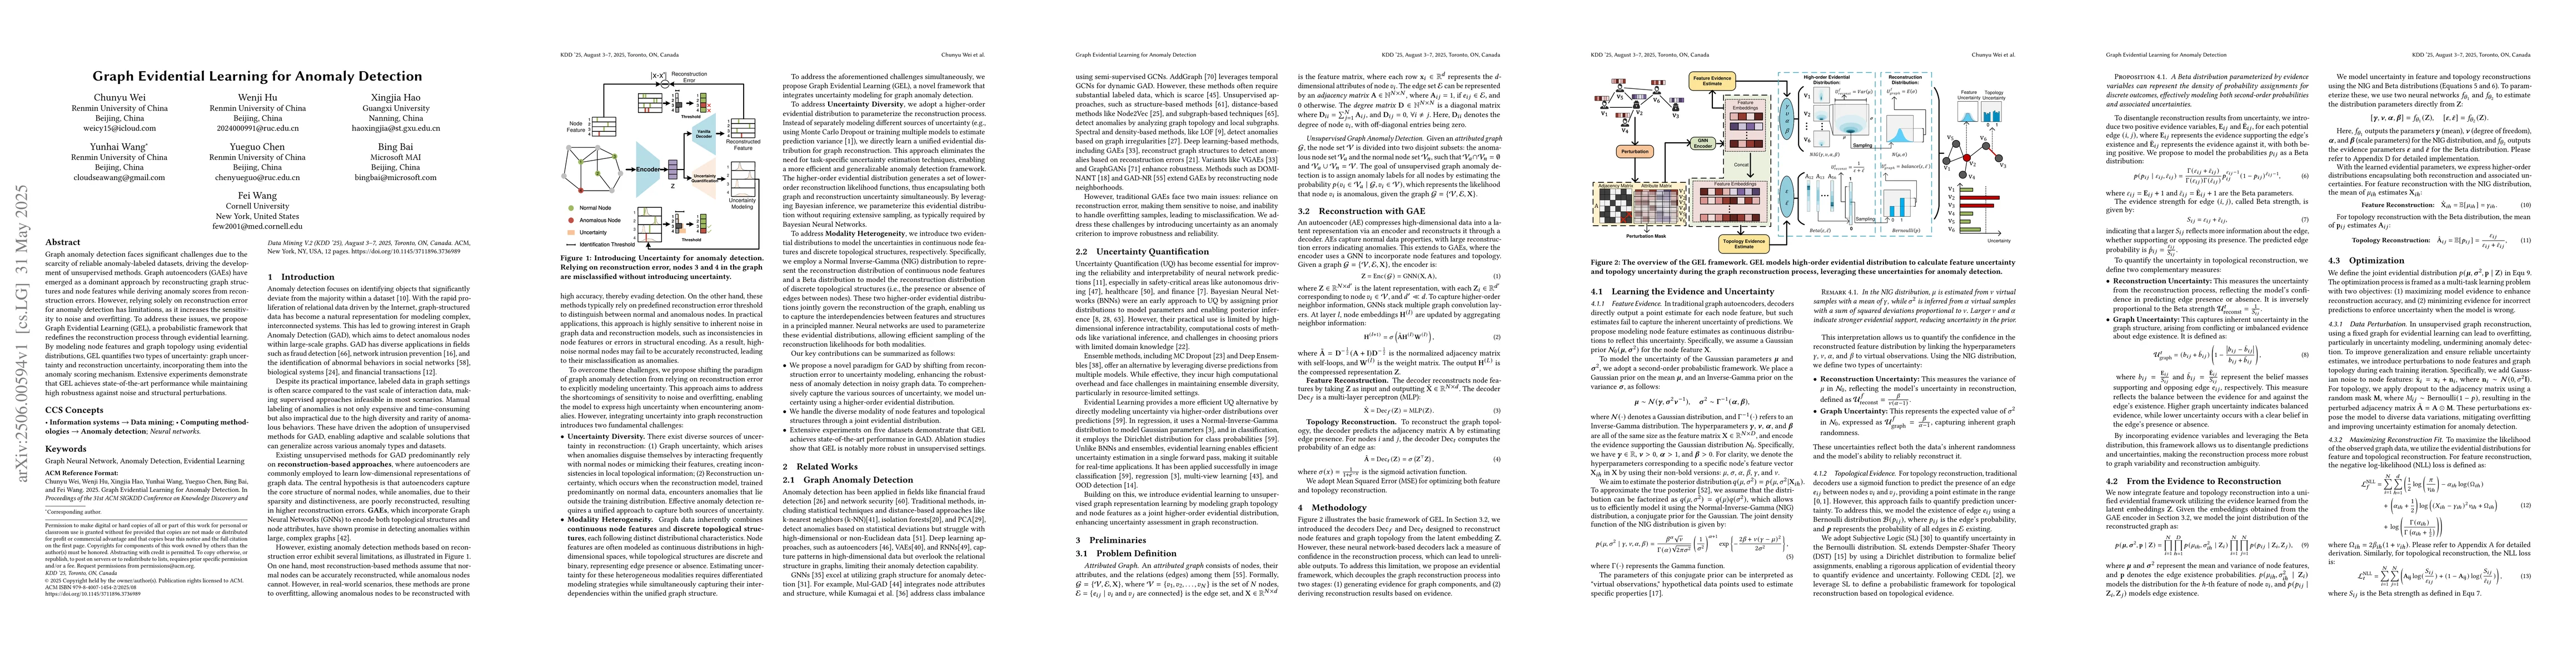
Graph anomaly detection faces significant challenges due to the scarcity of reliable anomaly-labeled datasets, driving the development of unsupervised methods. Graph autoencoders (GAEs) have emerged a...
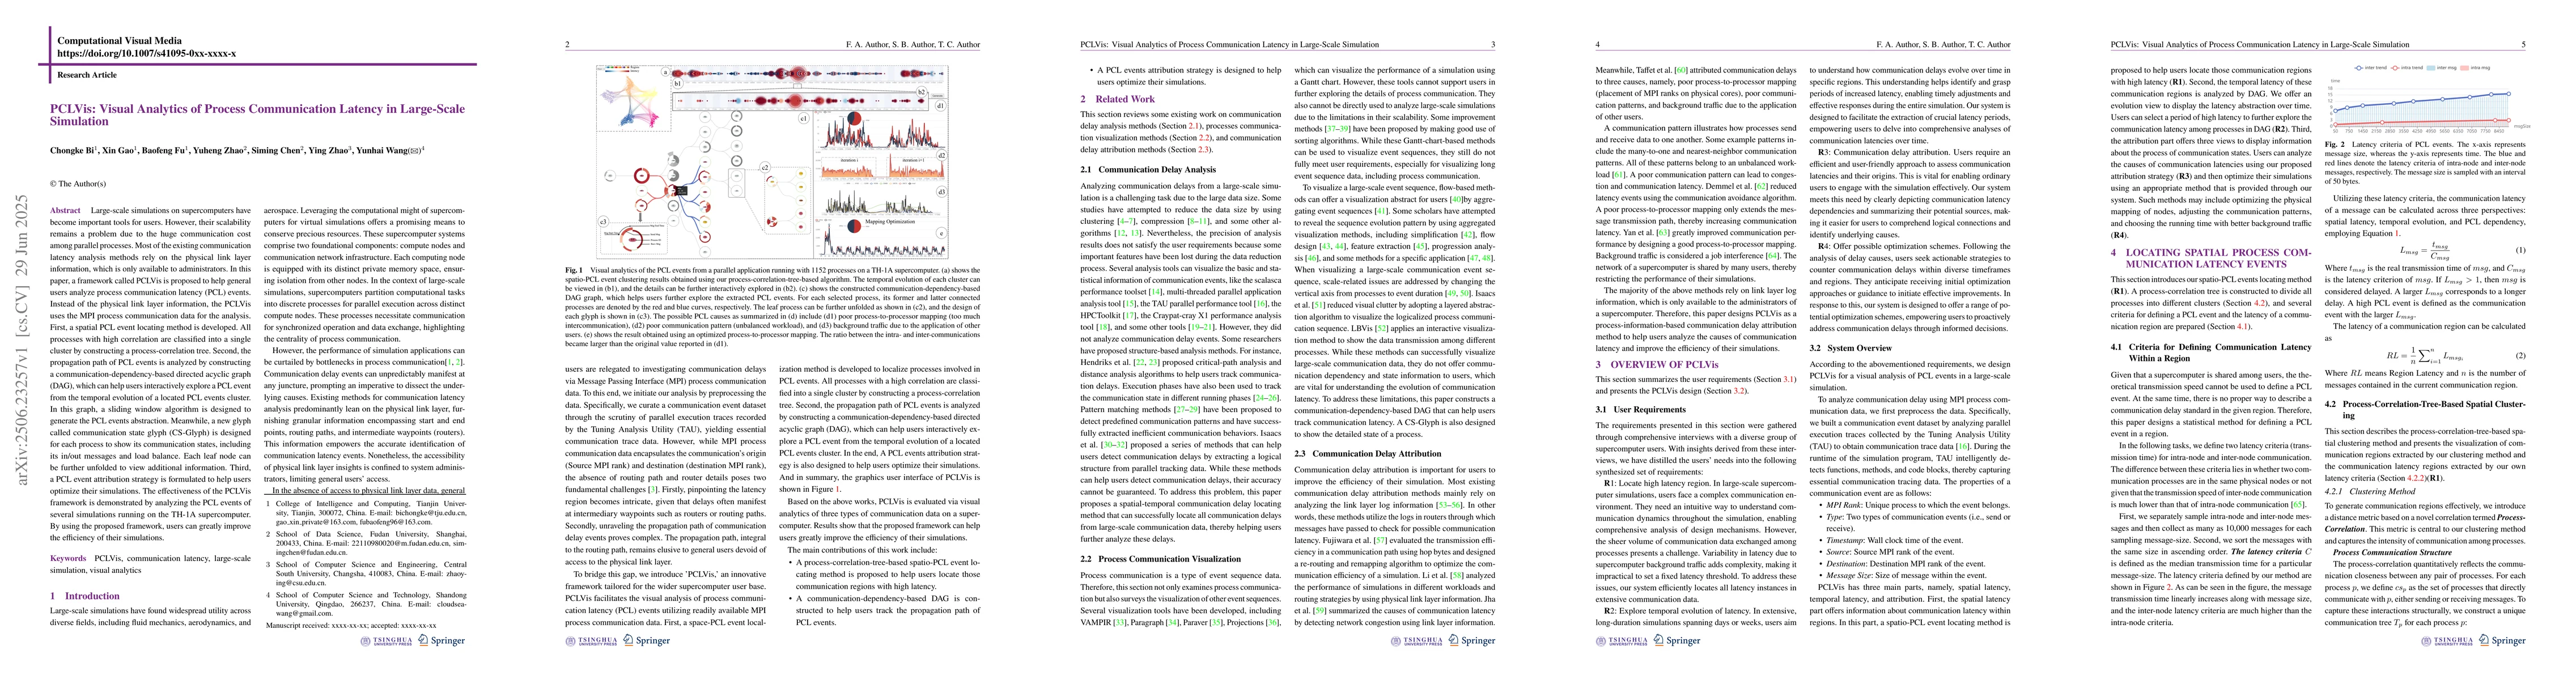
Large-scale simulations on supercomputers have become important tools for users. However, their scalability remains a problem due to the huge communication cost among parallel processes. Most of the e...
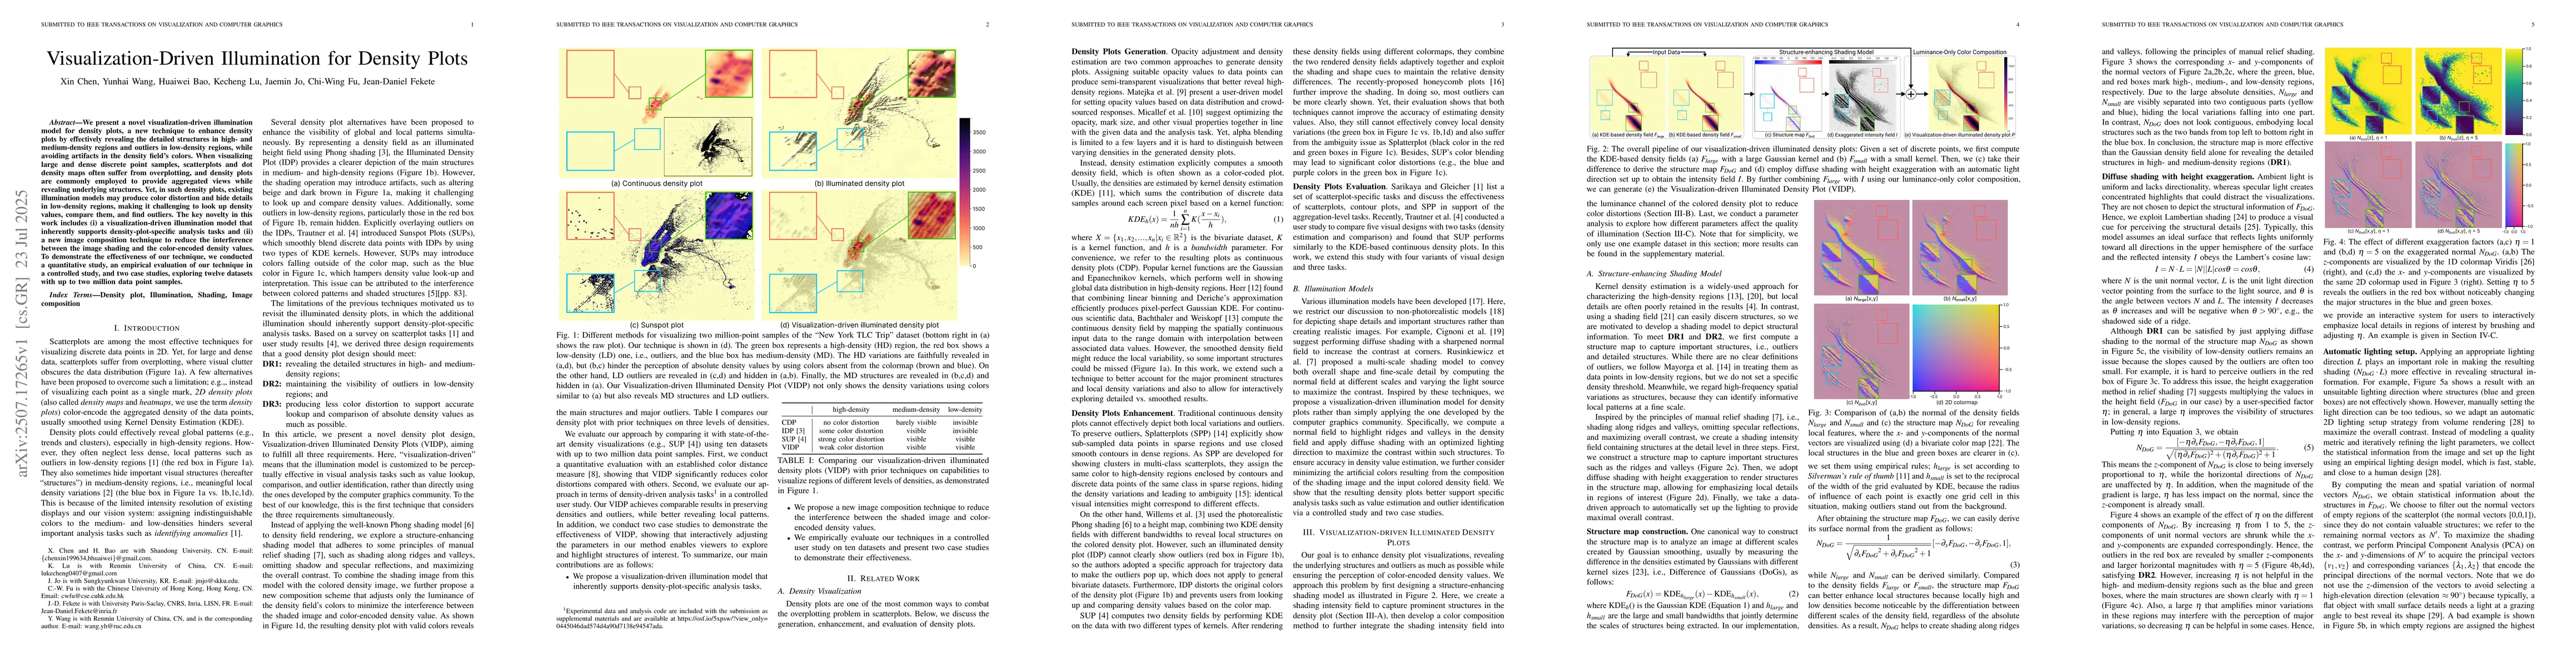
We present a novel visualization-driven illumination model for density plots, a new technique to enhance density plots by effectively revealing the detailed structures in high- and medium-density regi...
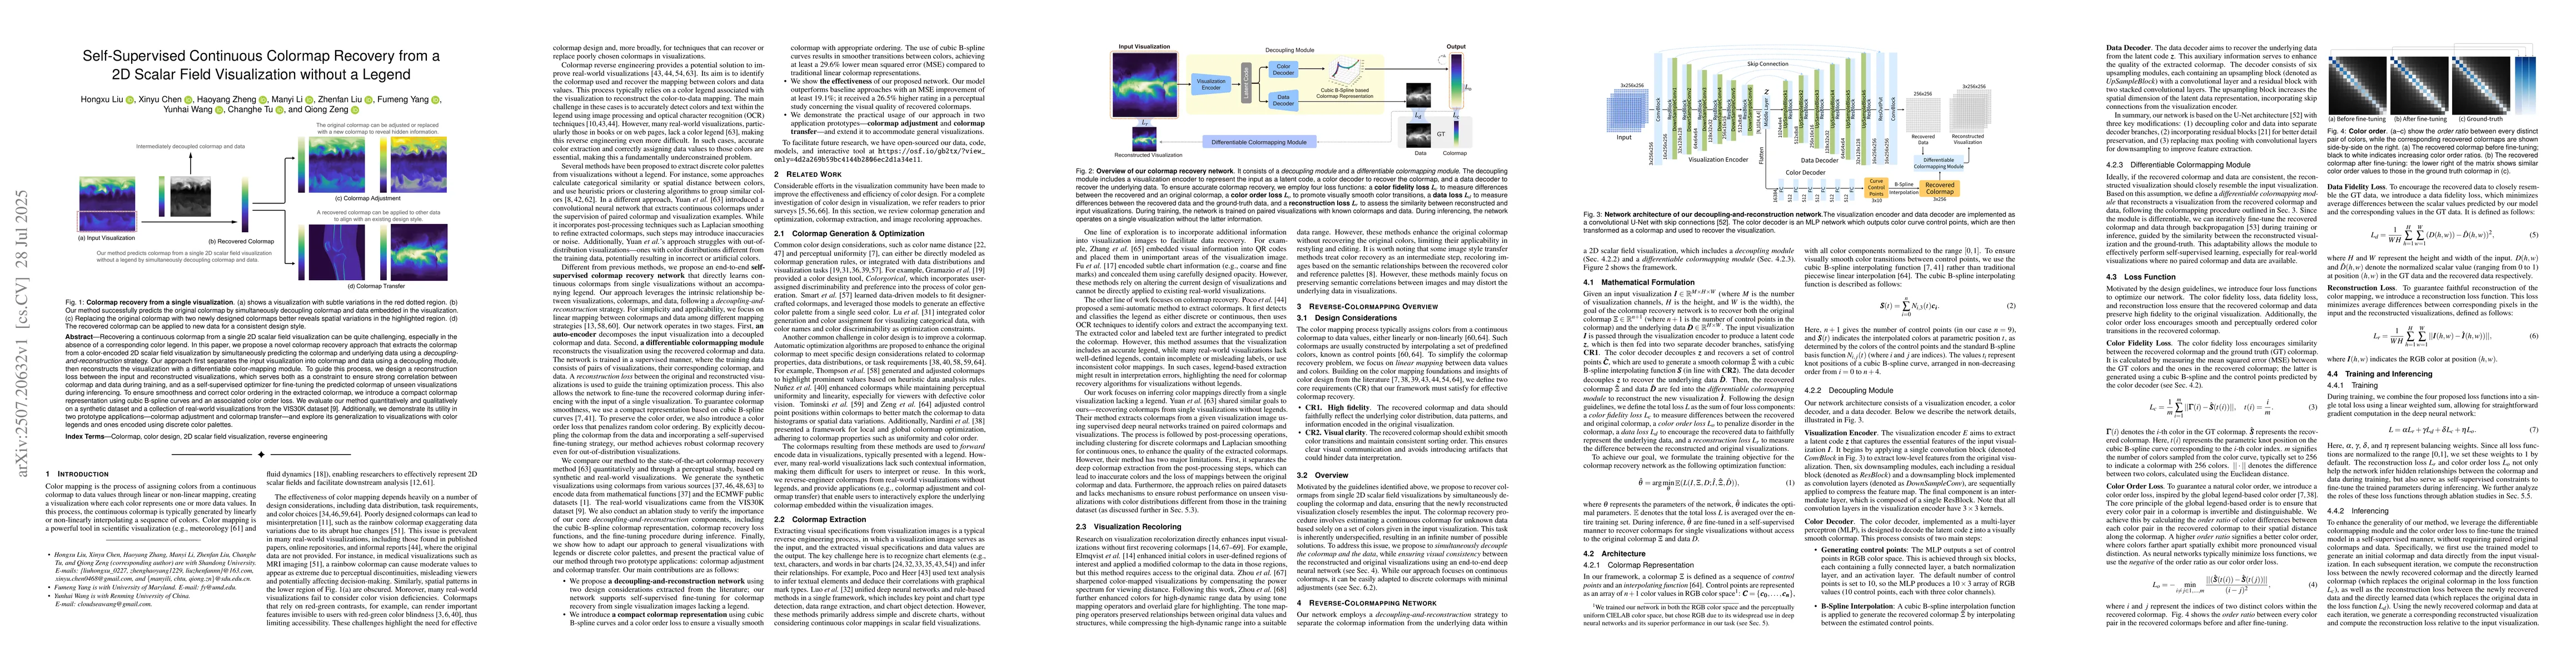
Recovering a continuous colormap from a single 2D scalar field visualization can be quite challenging, especially in the absence of a corresponding color legend. In this paper, we propose a novel colo...
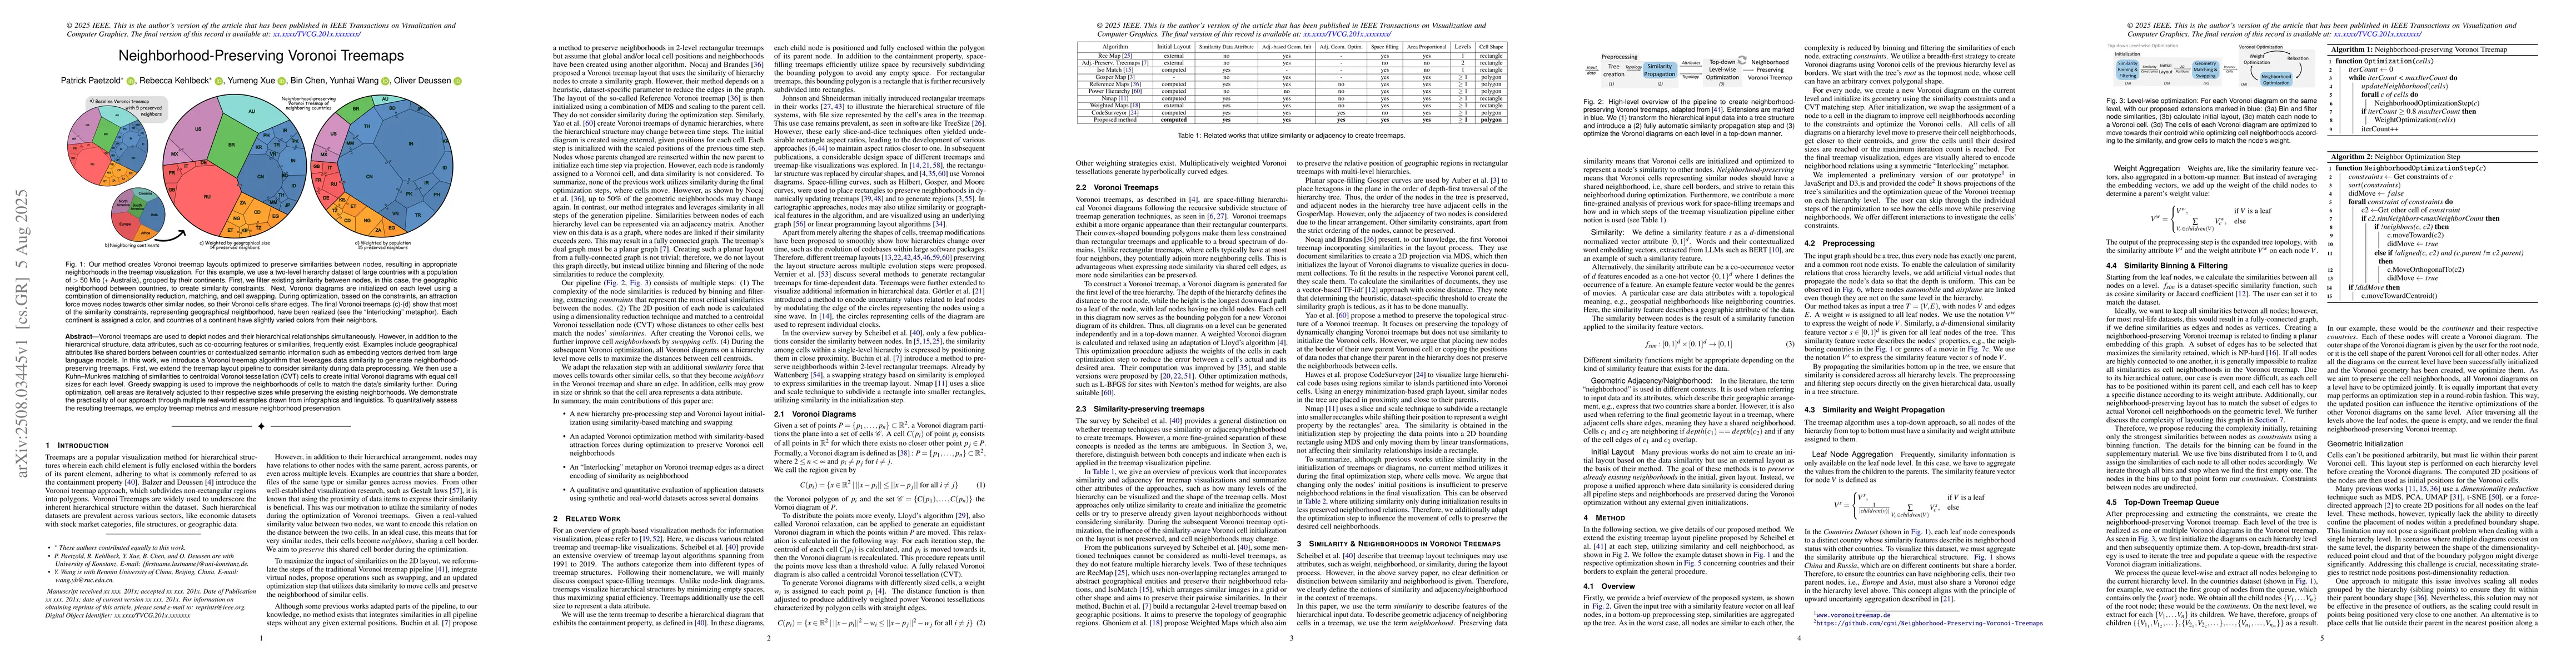
Voronoi treemaps are used to depict nodes and their hierarchical relationships simultaneously. However, in addition to the hierarchical structure, data attributes, such as co-occurring features or sim...
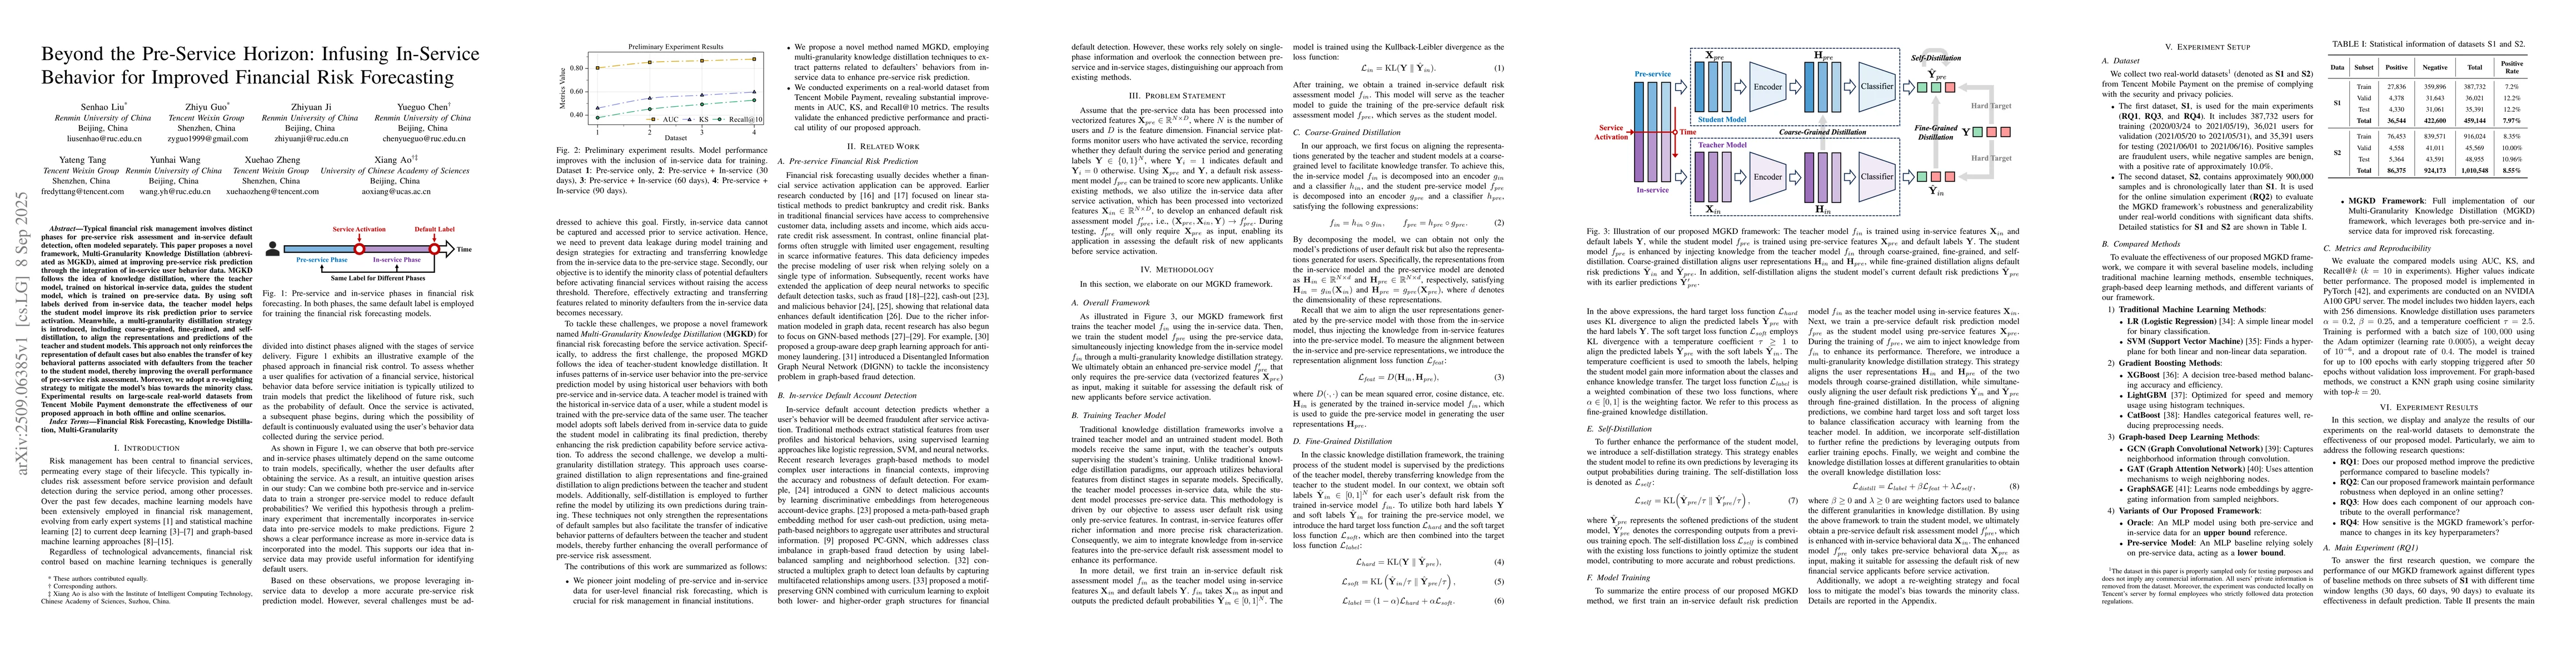
Typical financial risk management involves distinct phases for pre-service risk assessment and in-service default detection, often modeled separately. This paper proposes a novel framework, Multi-Gran...
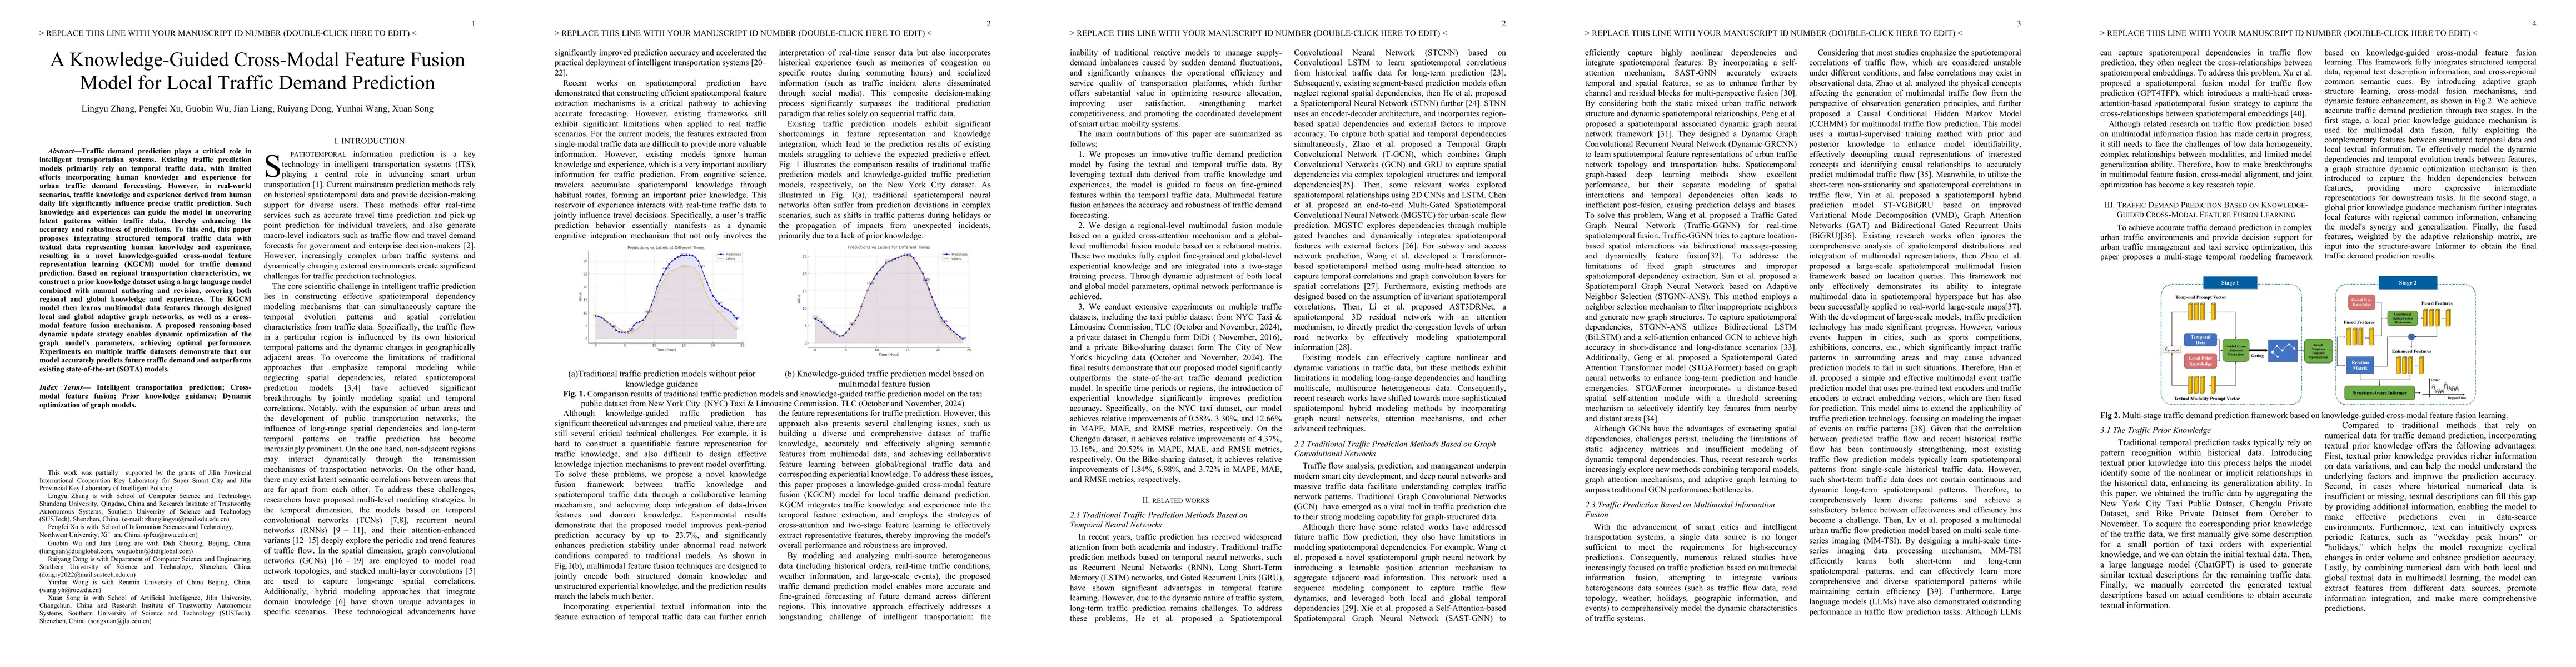
Traffic demand prediction plays a critical role in intelligent transportation systems. Existing traffic prediction models primarily rely on temporal traffic data, with limited efforts incorporating hu...
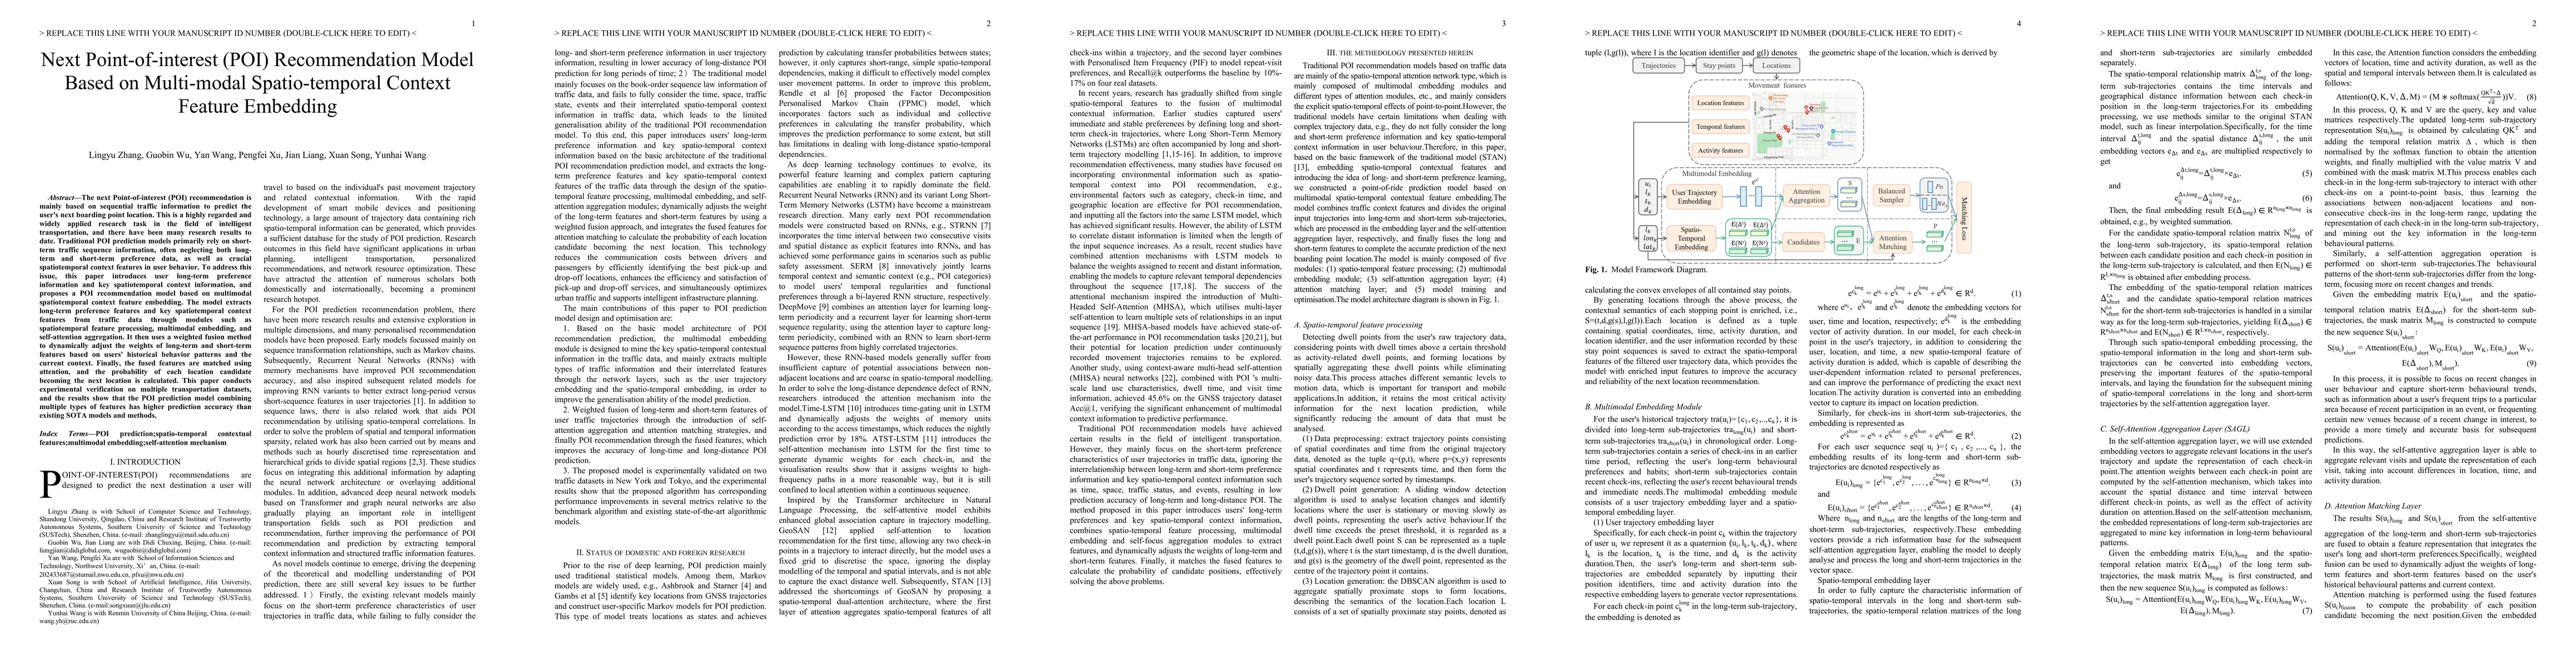
The next Point-of-interest (POI) recommendation is mainly based on sequential traffic information to predict the user's next boarding point location. This is a highly regarded and widely applied resea...
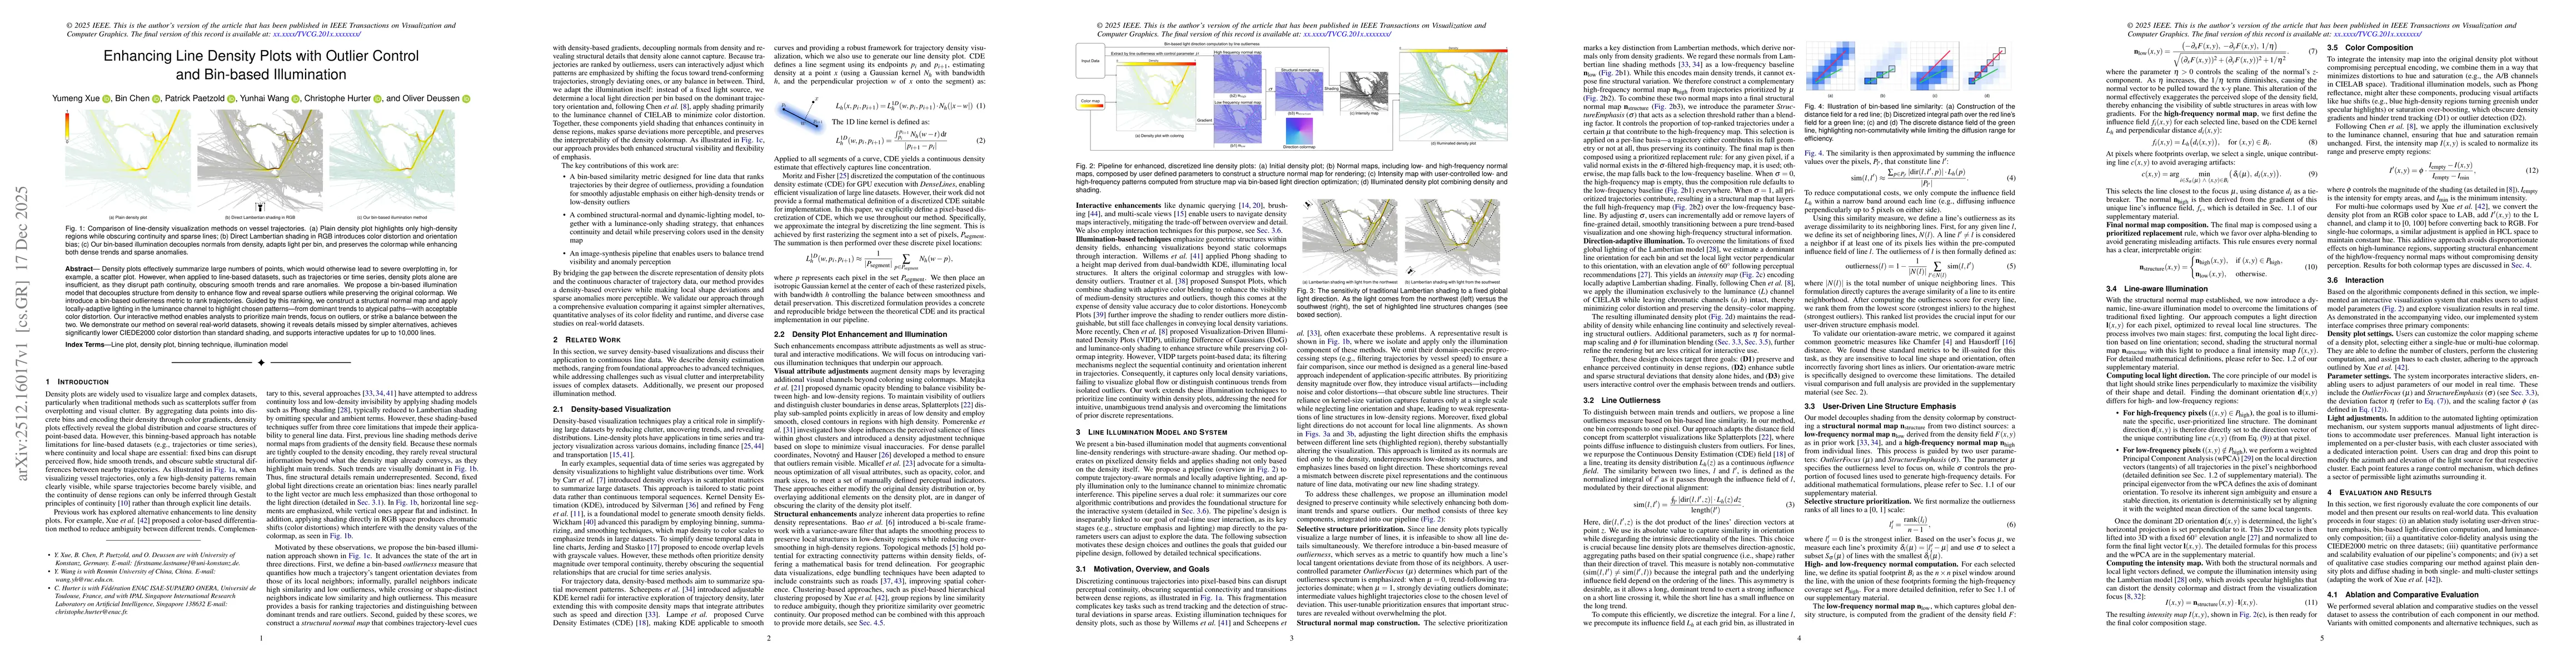
Density plots effectively summarize large numbers of points, which would otherwise lead to severe overplotting in, for example, a scatter plot. However, when applied to line-based datasets, such as tr...
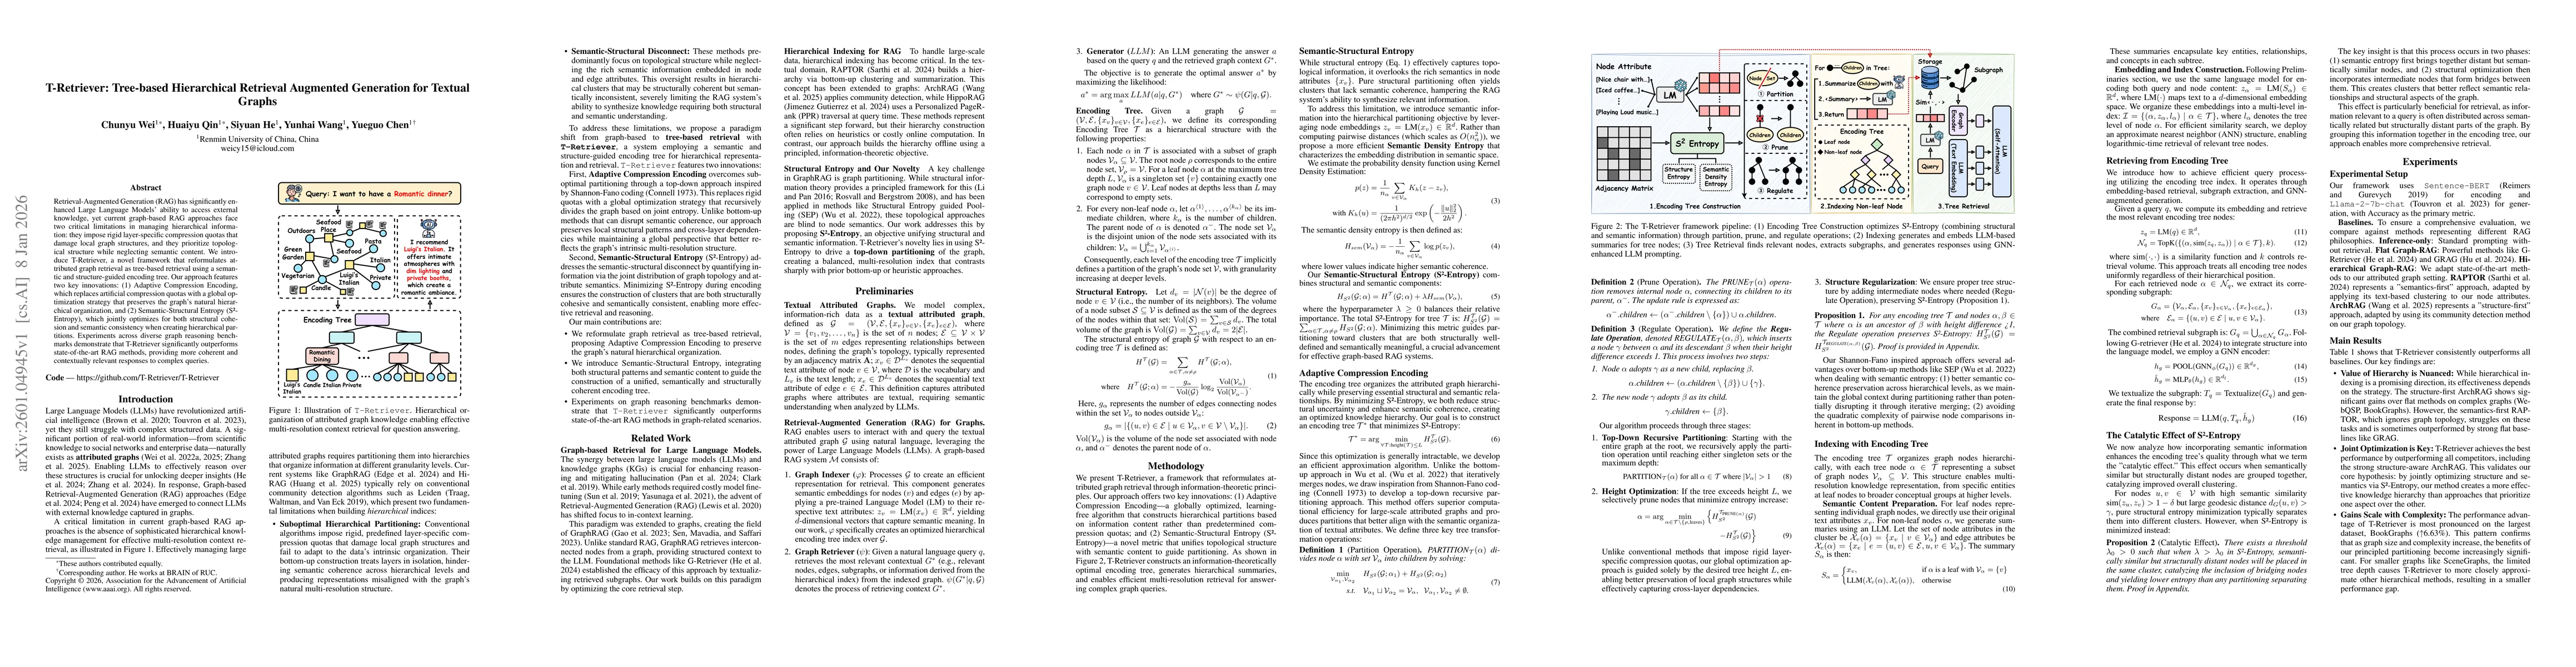
Retrieval-Augmented Generation (RAG) has significantly enhanced Large Language Models' ability to access external knowledge, yet current graph-based RAG approaches face two critical limitations in man...
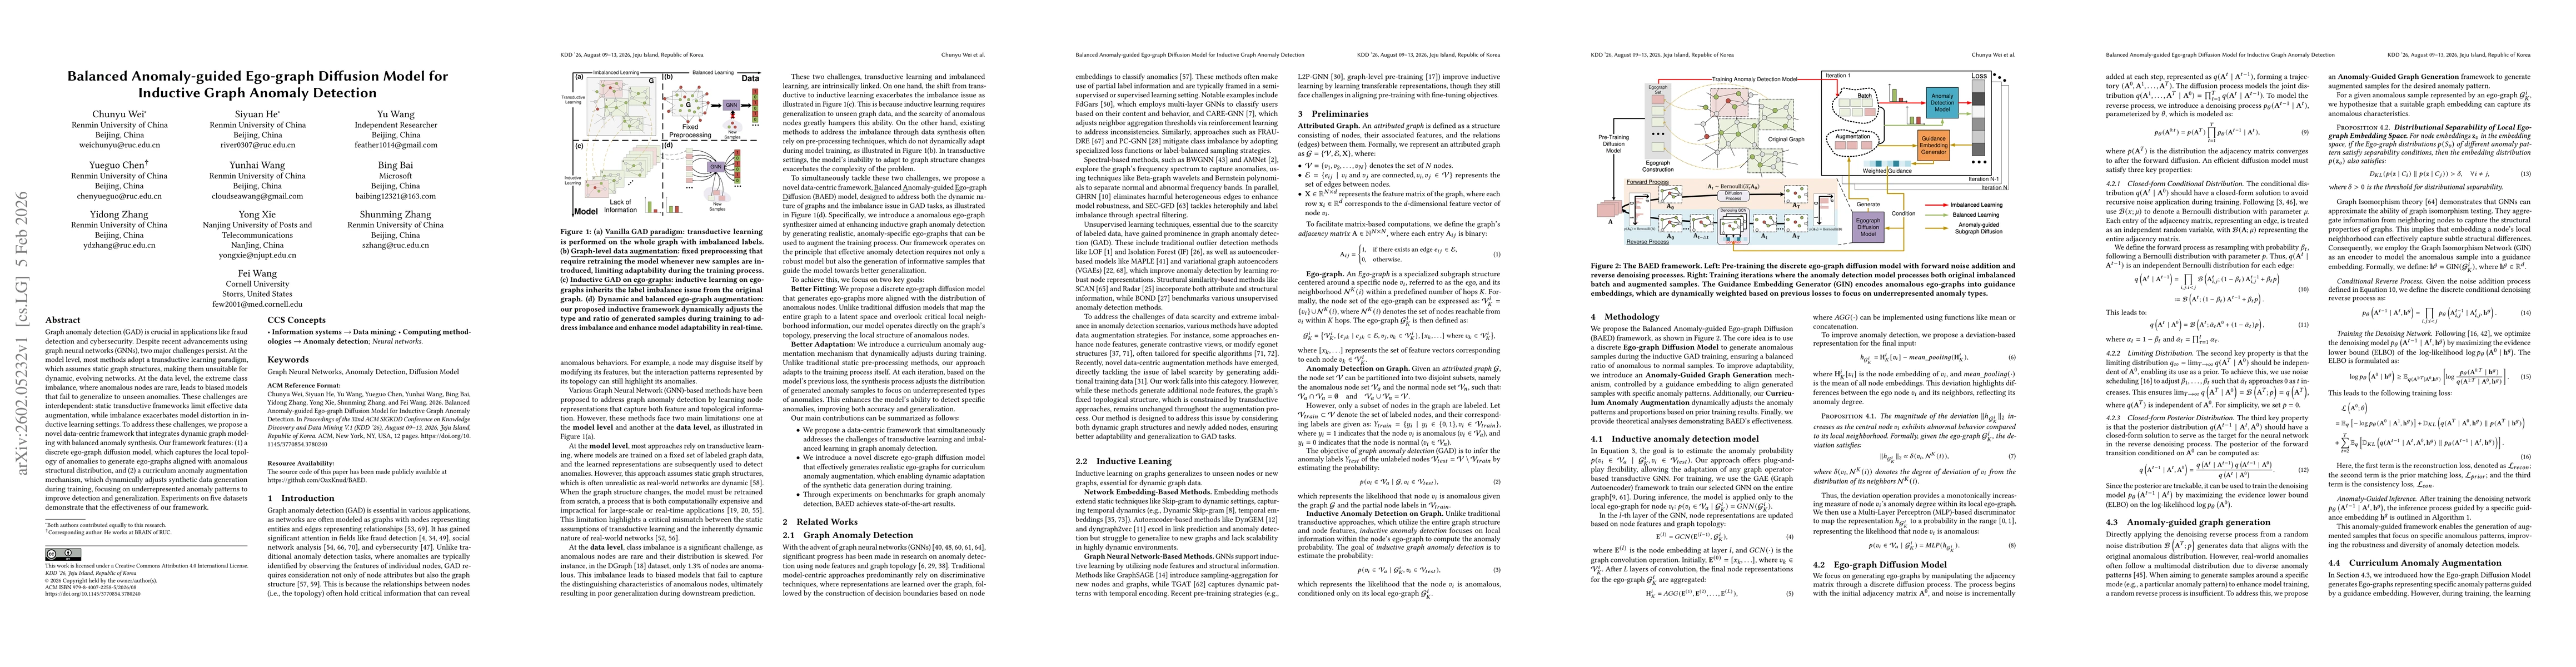
Graph anomaly detection (GAD) is crucial in applications like fraud detection and cybersecurity. Despite recent advancements using graph neural networks (GNNs), two major challenges persist. At the mo...
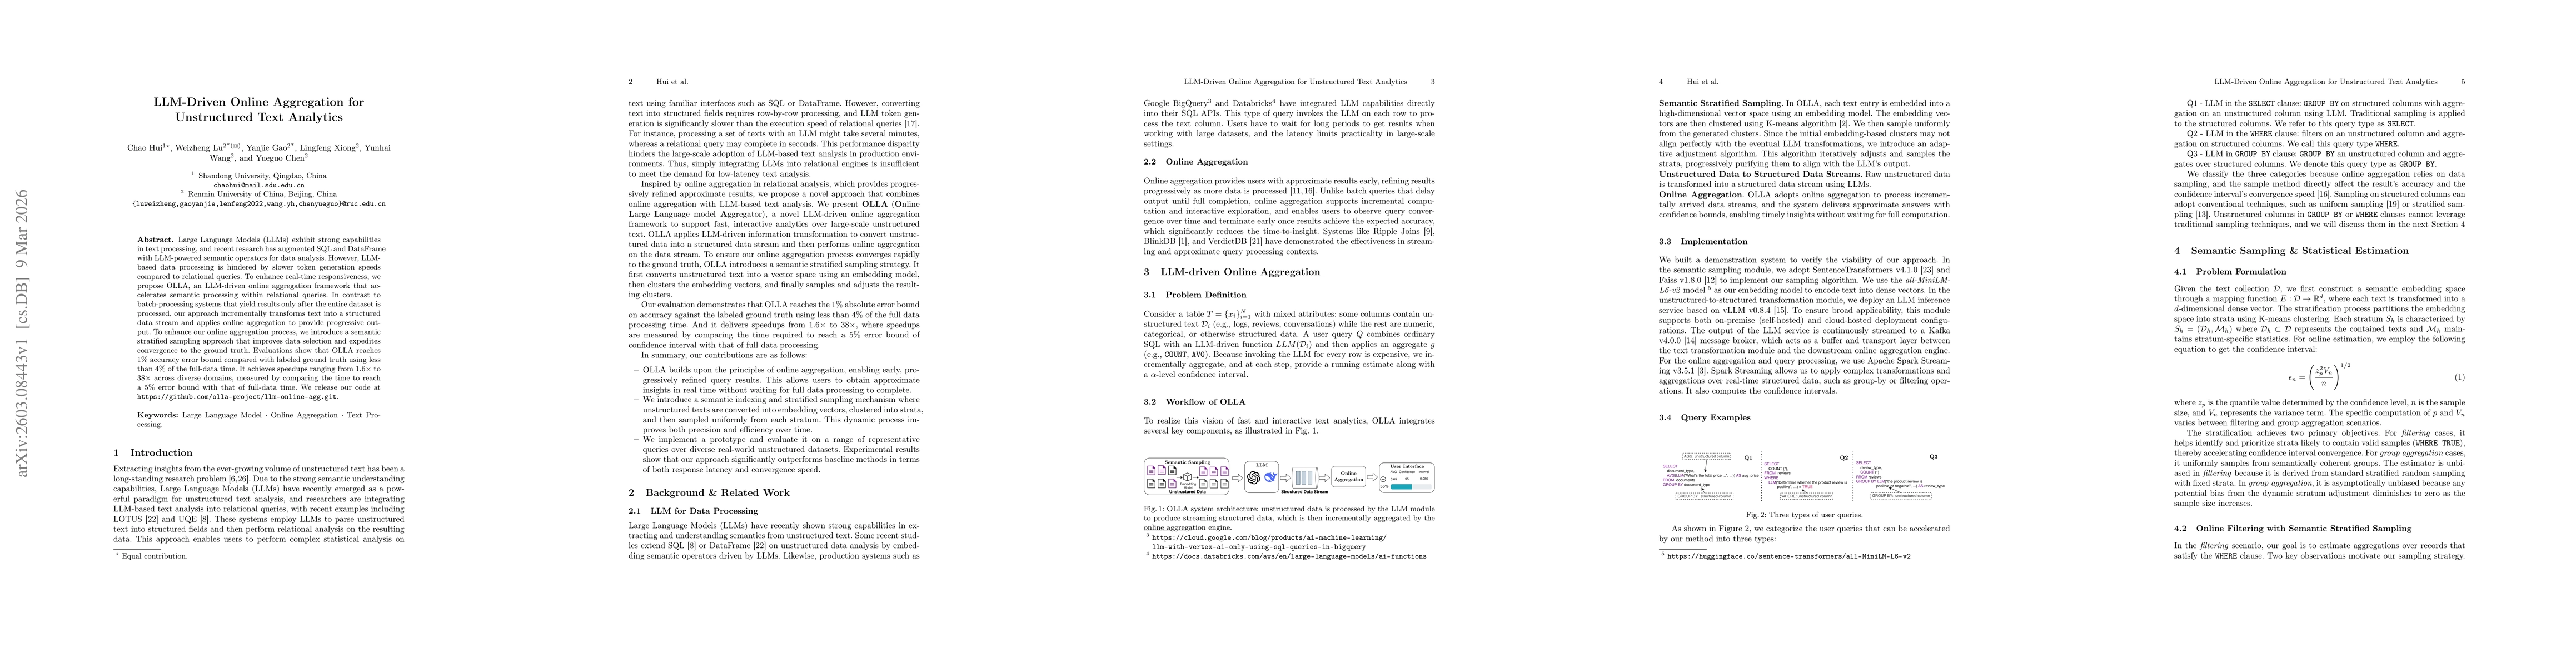
Large Language Models (LLMs) exhibit strong capabilities in text processing, and recent research has augmented SQL and DataFrame with LLM-powered semantic operators for data analysis. However, LLM-bas...
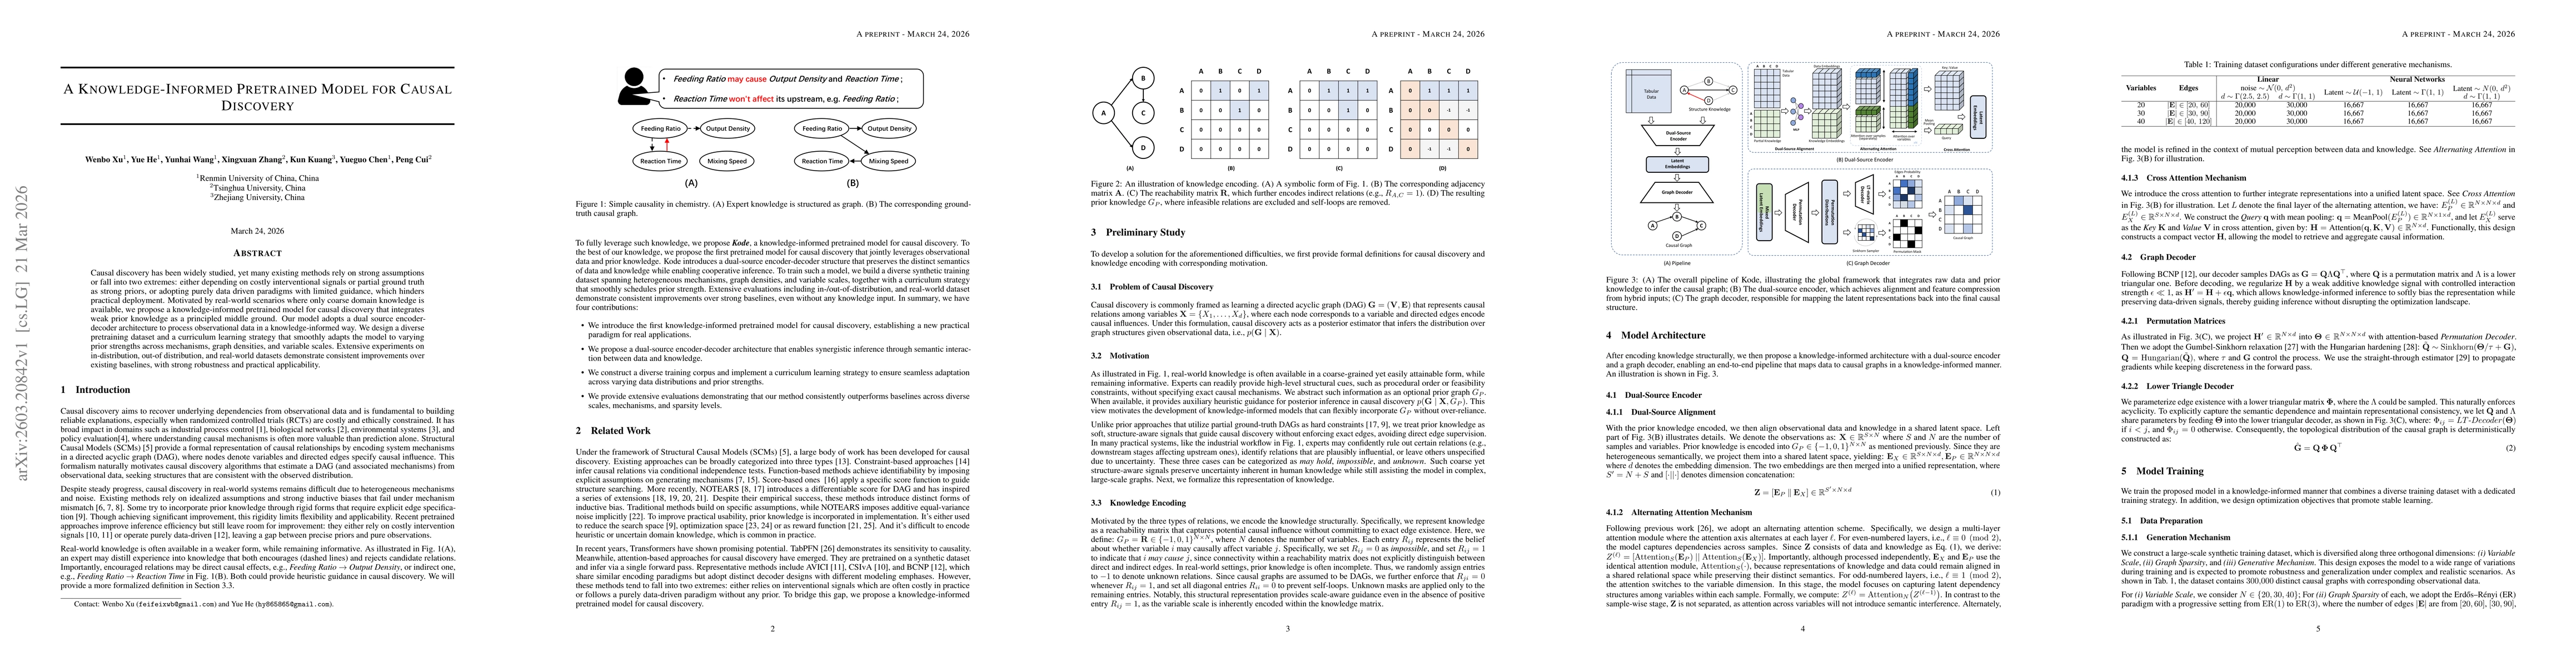
Causal discovery has been widely studied, yet many existing methods rely on strong assumptions or fall into two extremes: either depending on costly interventional signals or partial ground truth as s...
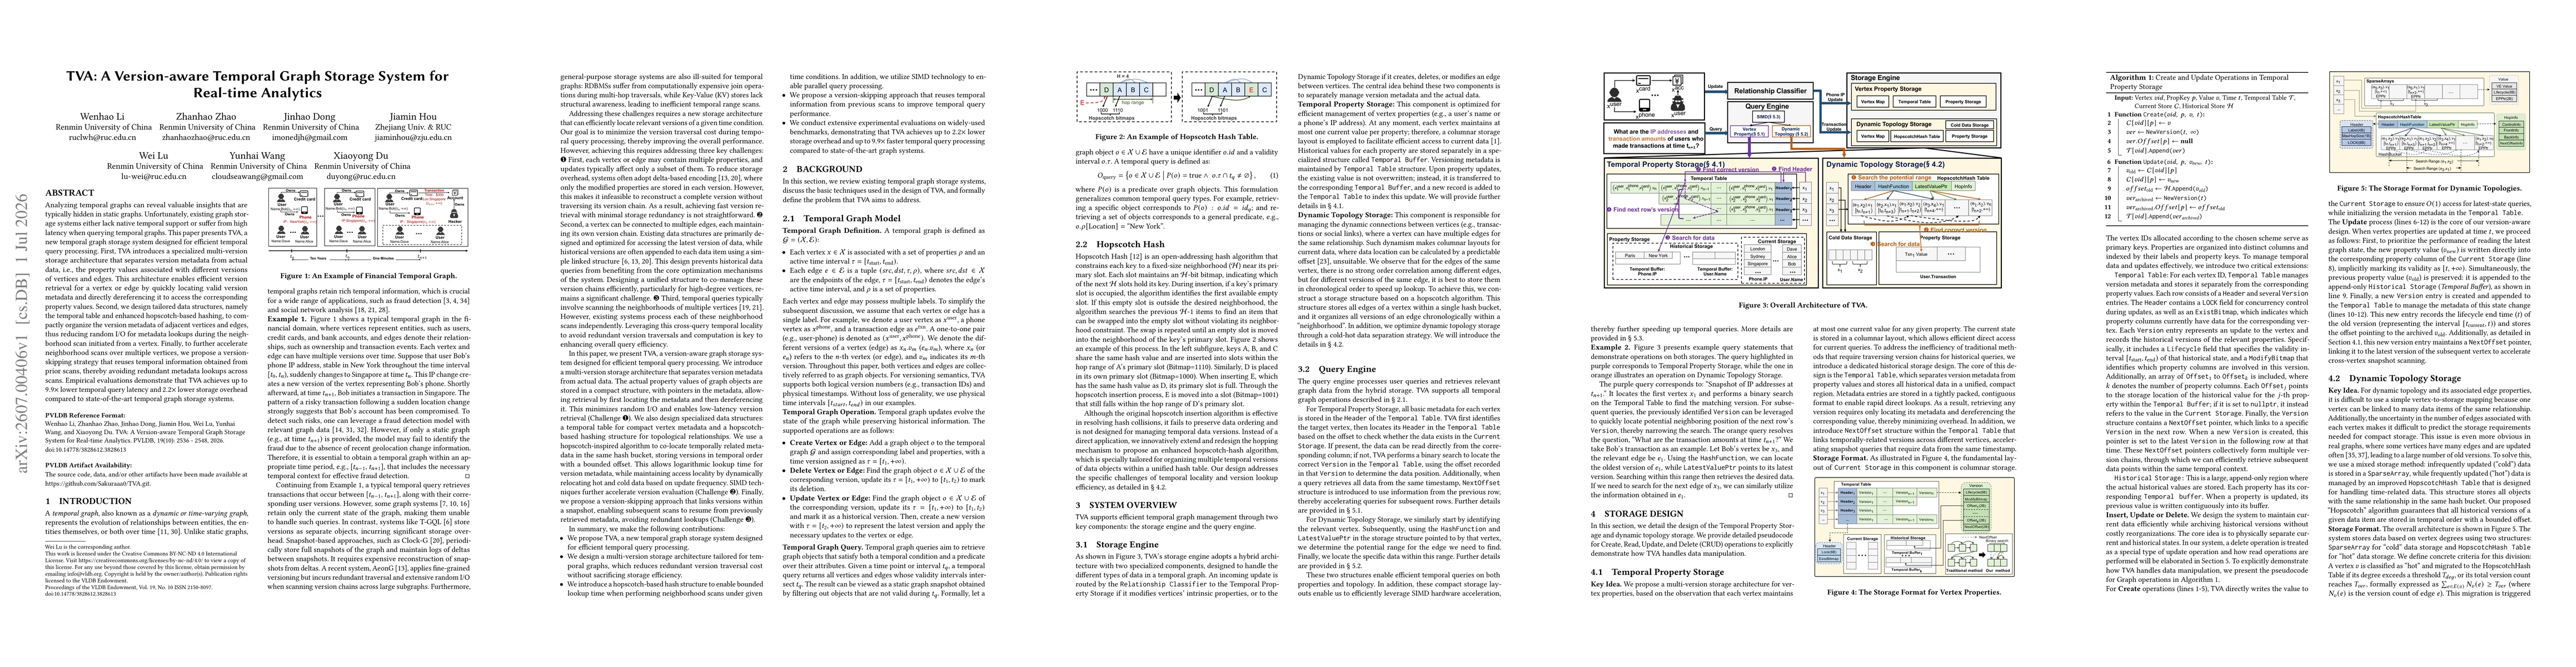
Analyzing temporal graphs can reveal valuable insights that are typically hidden in static graphs. Unfortunately, existing graph storage systems either lack native temporal support or suffer from high...