Implicit Multidimensional Projection of Local Subspaces
Publication
Metrics
AI Quick Summary
This paper proposes a novel visualization method for understanding multidimensional projections on local subspaces using implicit function differentiation. It fits local subspaces with multidimensional ellipses and employs an efficient vector transformation method, demonstrating its effectiveness through benchmark datasets and interactive web-based visualization.
Paper Preview
Abstract
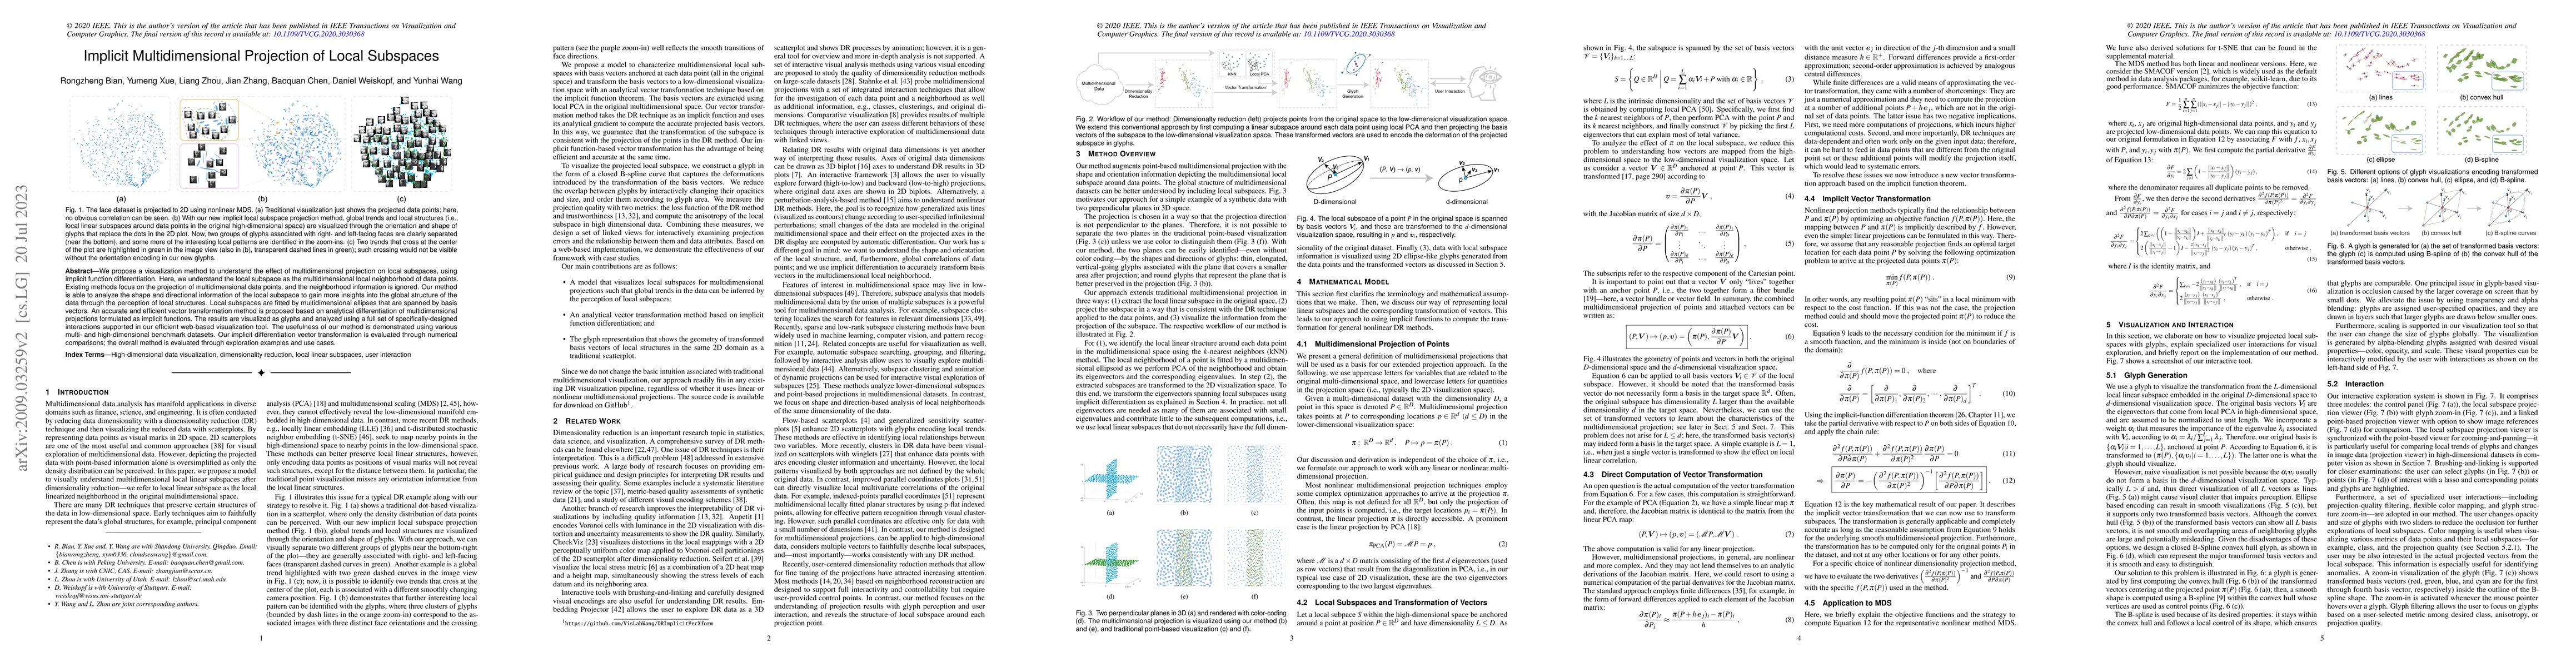
We propose a visualization method to understand the effect of multidimensional projection on local subspaces, using implicit function differentiation. Here, we understand the local subspace as the multidimensional local neighborhood of data points. Existing methods focus on the projection of multidimensional data points, and the neighborhood information is ignored. Our method is able to analyze the shape and directional information of the local subspace to gain more insights into the global structure of the data through the perception of local structures. Local subspaces are fitted by multidimensional ellipses that are spanned by basis vectors. An accurate and efficient vector transformation method is proposed based on analytical differentiation of multidimensional projections formulated as implicit functions. The results are visualized as glyphs and analyzed using a full set of specifically-designed interactions supported in our efficient web-based visualization tool. The usefulness of our method is demonstrated using various multi- and high-dimensional benchmark datasets. Our implicit differentiation vector transformation is evaluated through numerical comparisons; the overall method is evaluated through exploration examples and use cases.
AI Key Findings
Get AI-generated insights about this paper's methodology, results, significance, and more — seven facets brought into focus.
Impact
Paper Details
Authors
PDF Preview
Key Terms
Citation Network
Current paper (gray), citations (green), references (blue)
Display is limited for performance on very large graphs.
Discussion 0