Academic Profile
Statistics
Similar Authors
Papers on arXiv
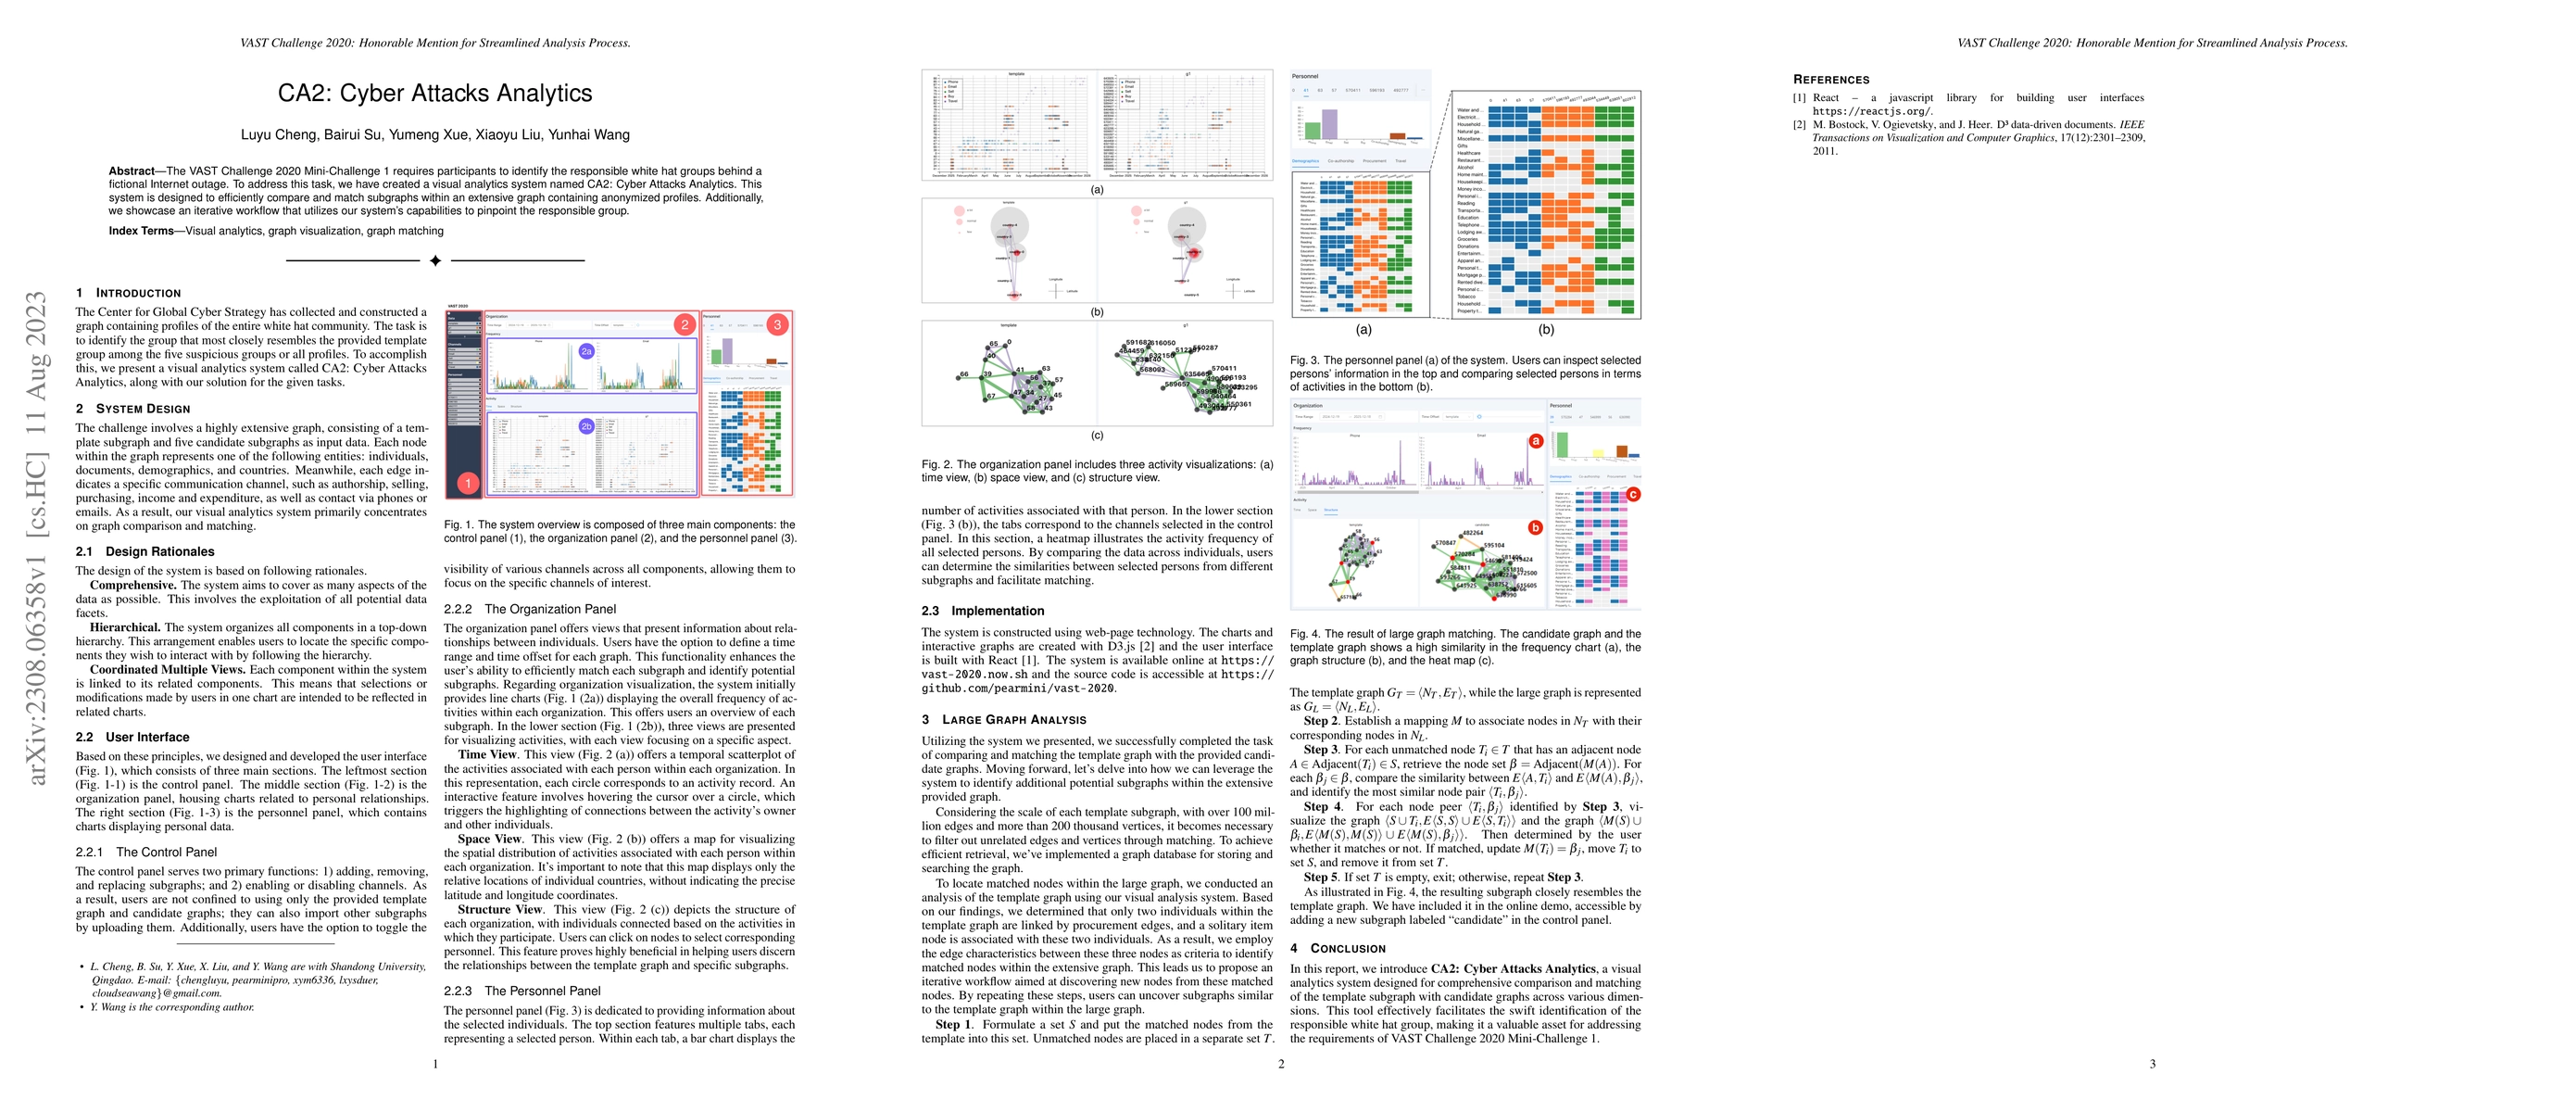
The VAST Challenge 2020 Mini-Challenge 1 requires participants to identify the responsible white hat groups behind a fictional Internet outage. To address this task, we have created a visual analyti...
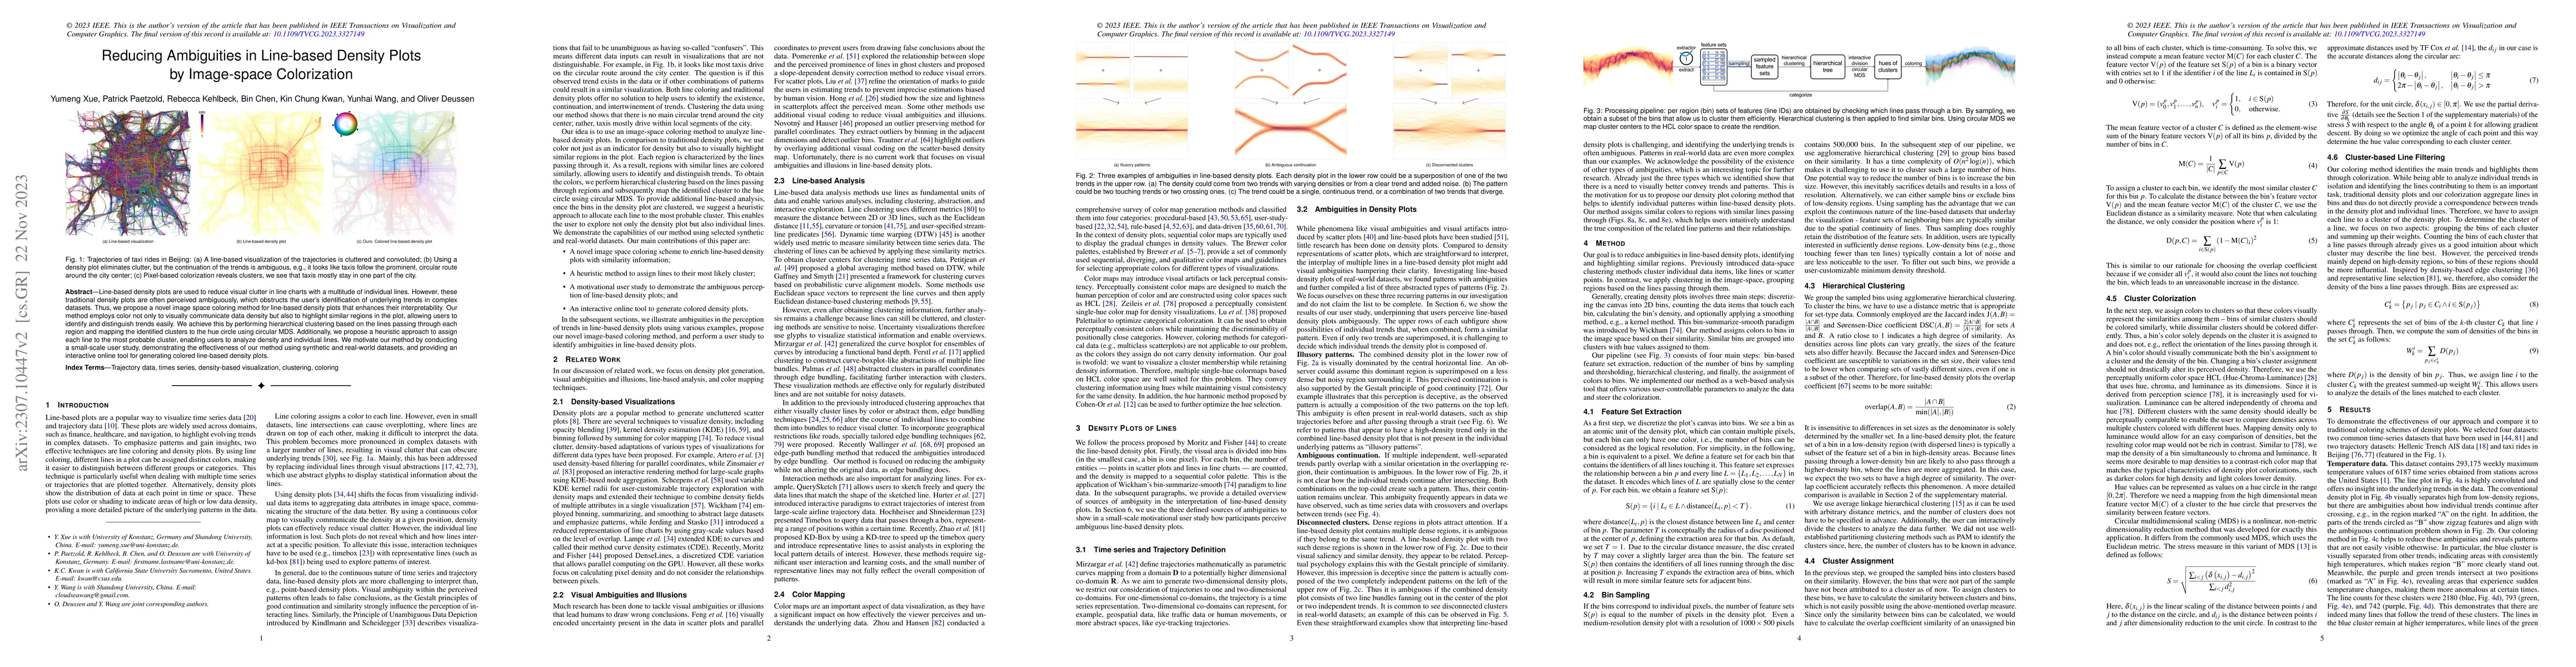
Line-based density plots are used to reduce visual clutter in line charts with a multitude of individual lines. However, these traditional density plots are often perceived ambiguously, which obstru...
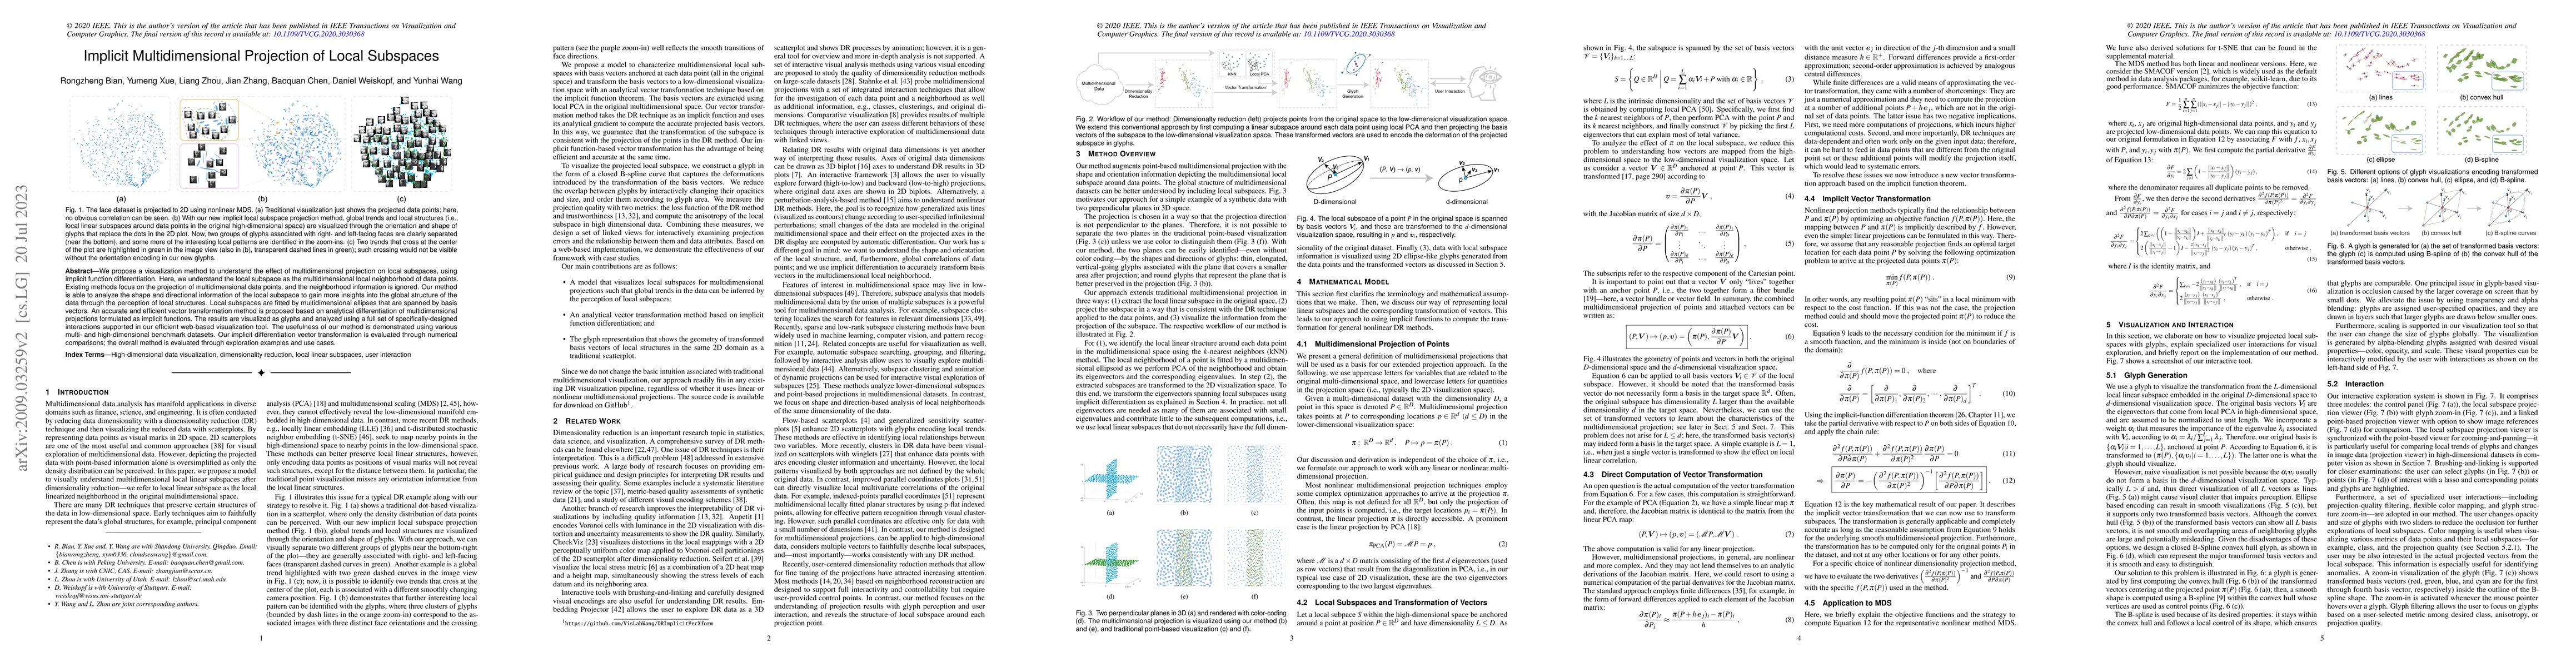
We propose a visualization method to understand the effect of multidimensional projection on local subspaces, using implicit function differentiation. Here, we understand the local subspace as the m...
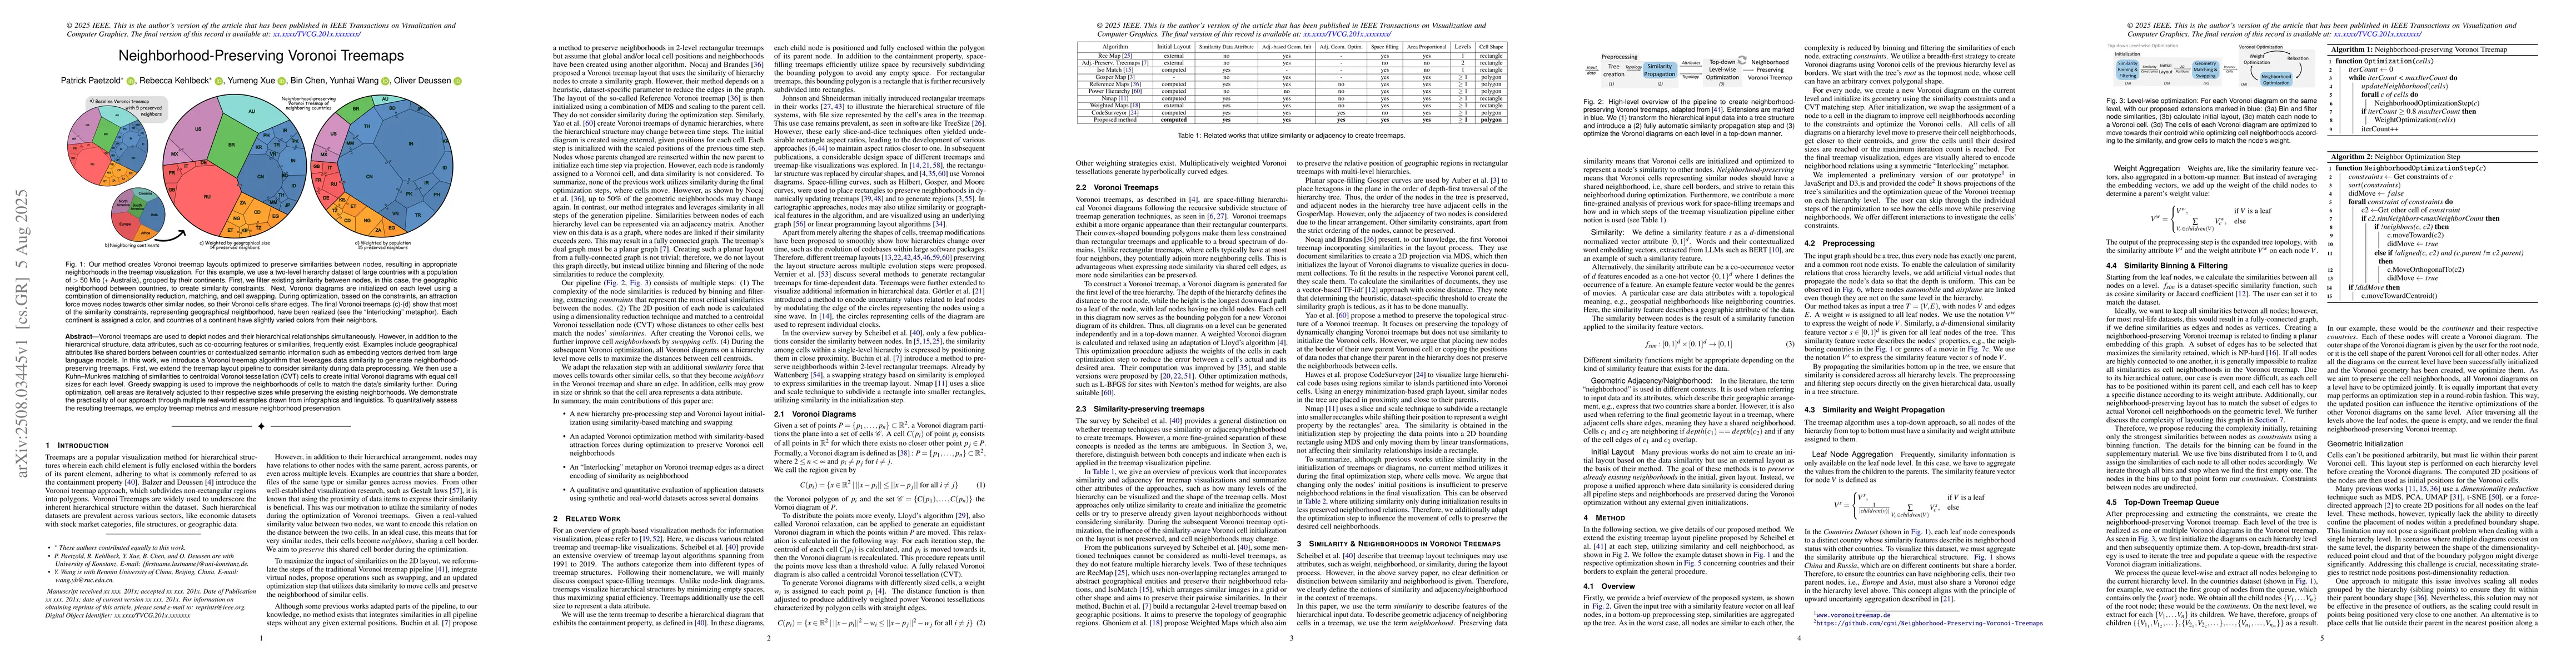
Voronoi treemaps are used to depict nodes and their hierarchical relationships simultaneously. However, in addition to the hierarchical structure, data attributes, such as co-occurring features or sim...
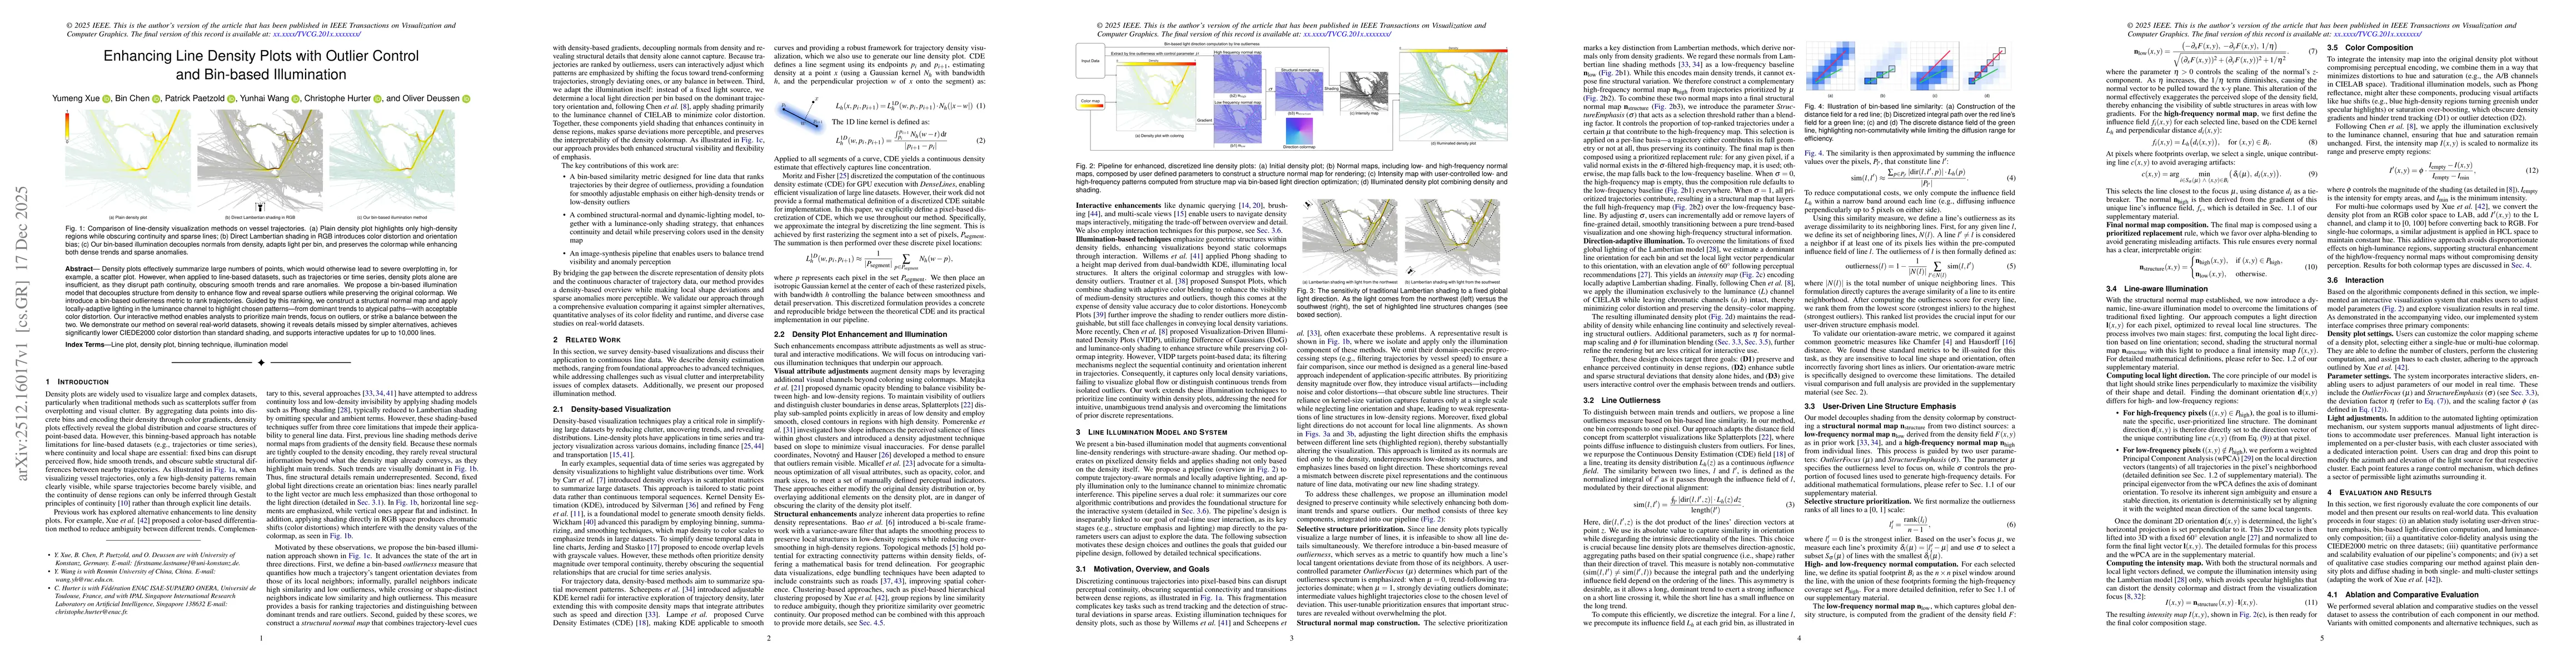
Density plots effectively summarize large numbers of points, which would otherwise lead to severe overplotting in, for example, a scatter plot. However, when applied to line-based datasets, such as tr...