Academic Profile
Statistics
Similar Authors
Papers on arXiv
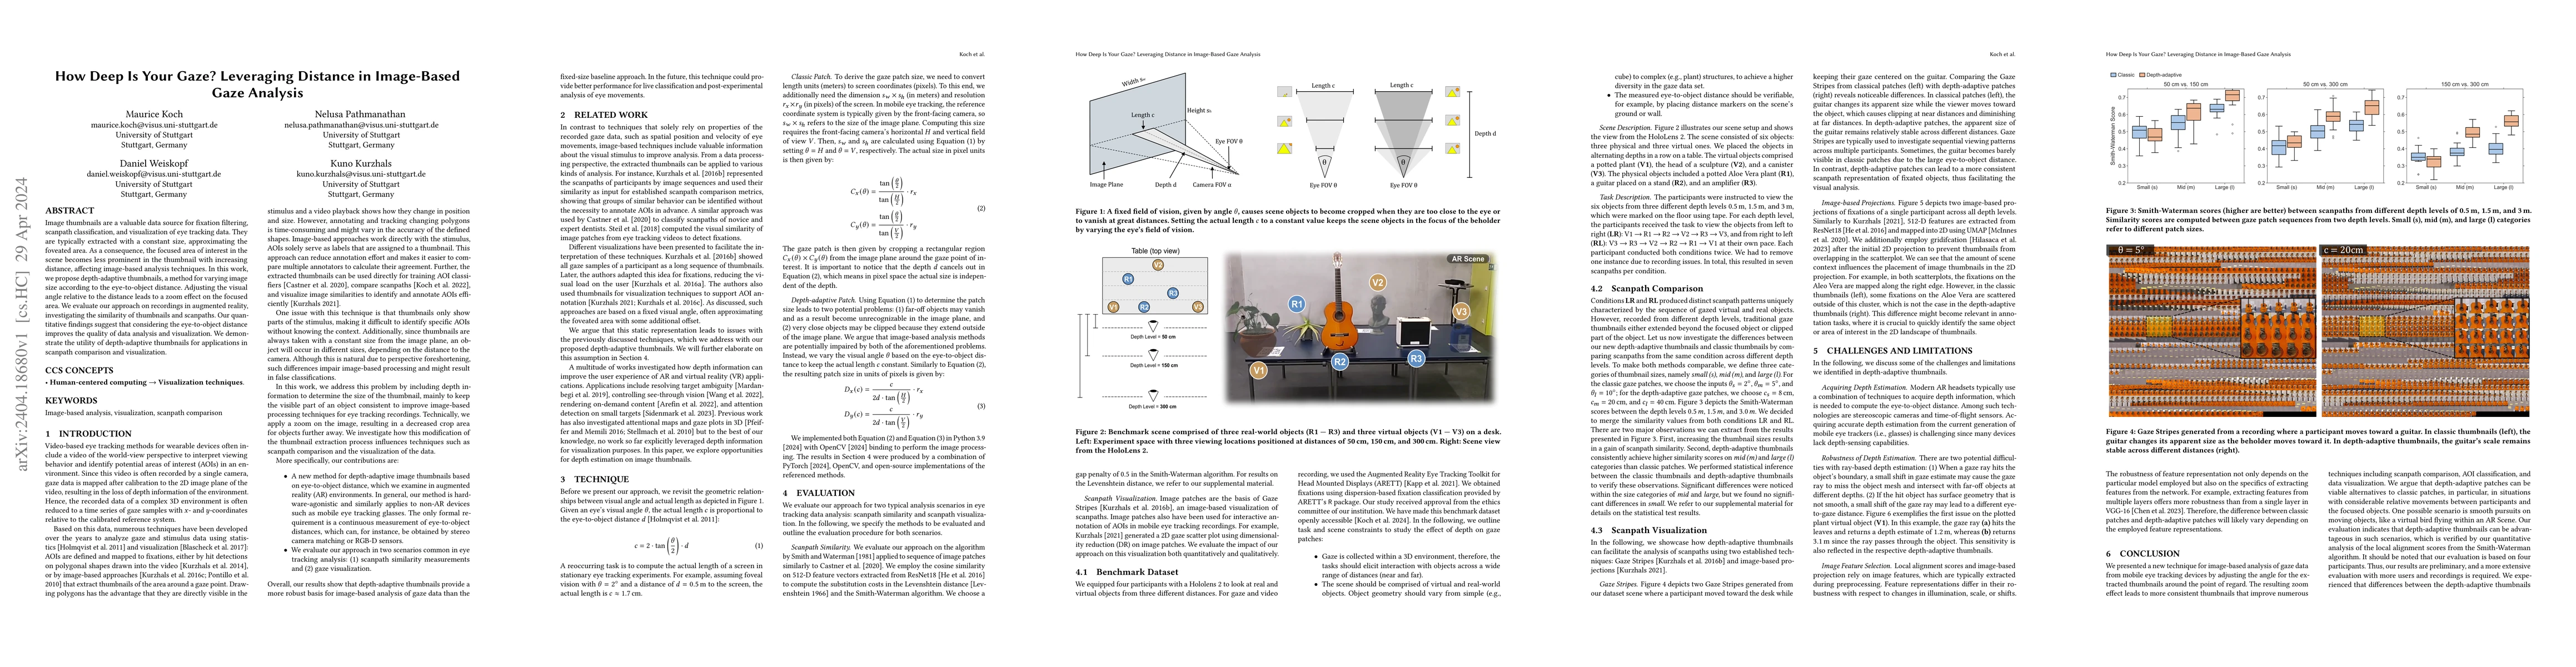
Image thumbnails are a valuable data source for fixation filtering, scanpath classification, and visualization of eye tracking data. They are typically extracted with a constant size, approximating ...
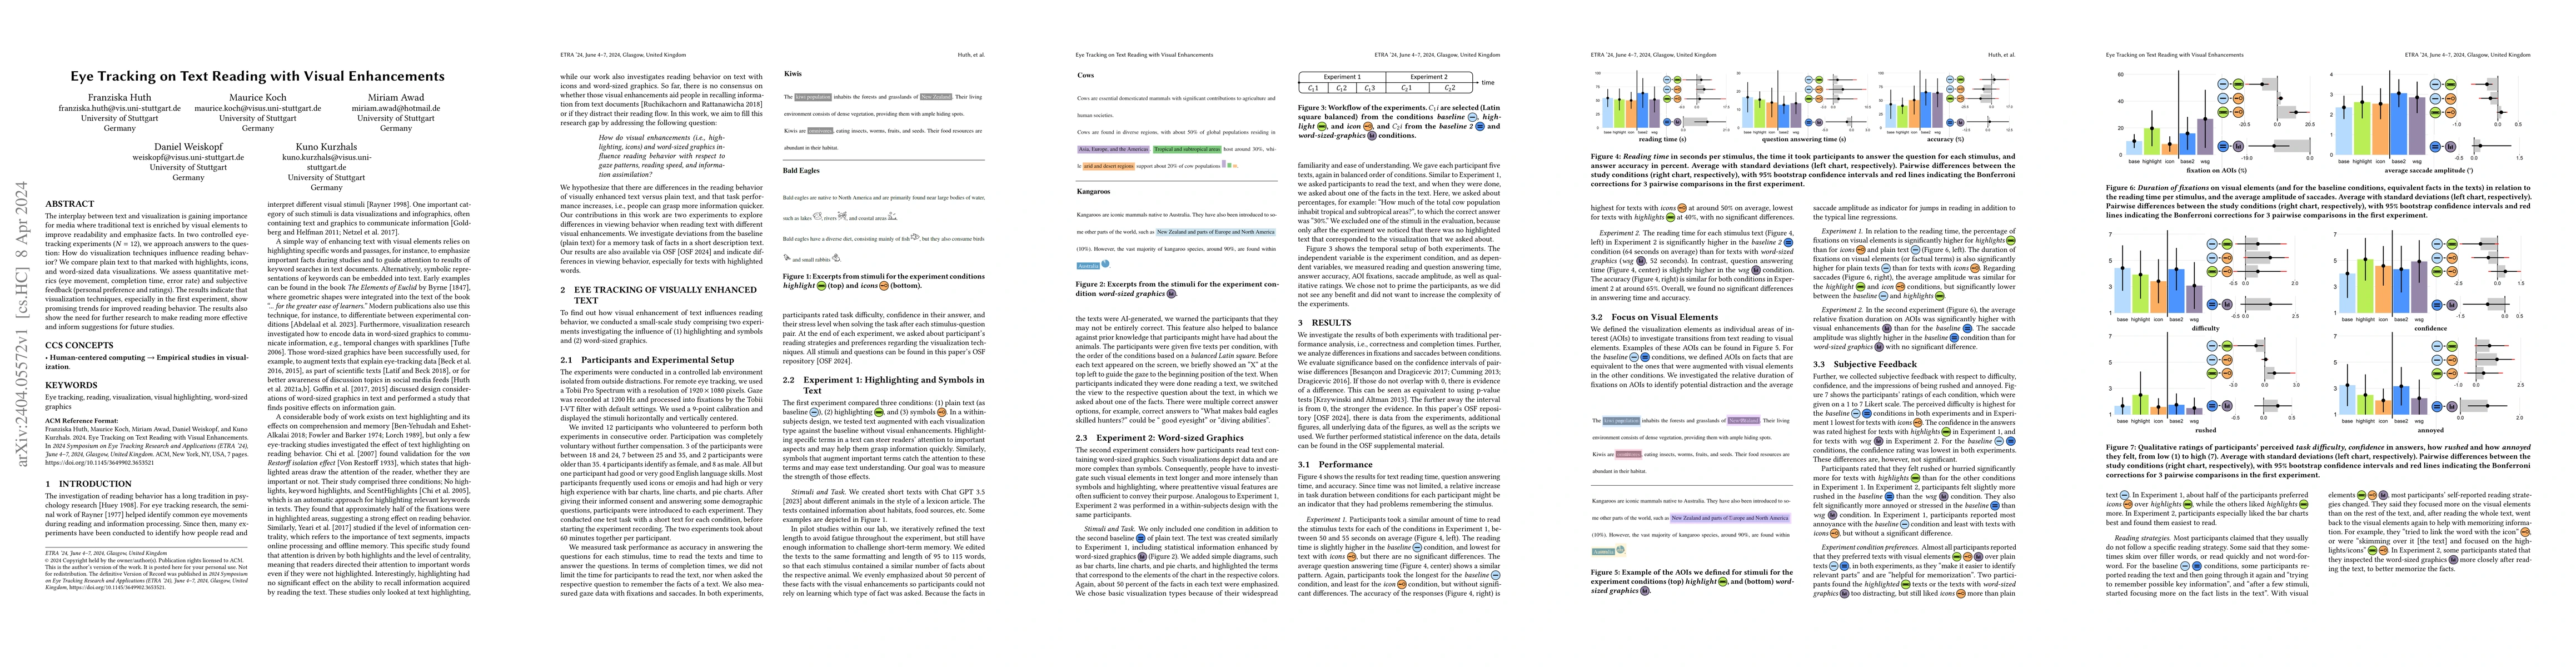
The interplay between text and visualization is gaining importance for media where traditional text is enriched by visual elements to improve readability and emphasize facts. In two controlled eye-t...
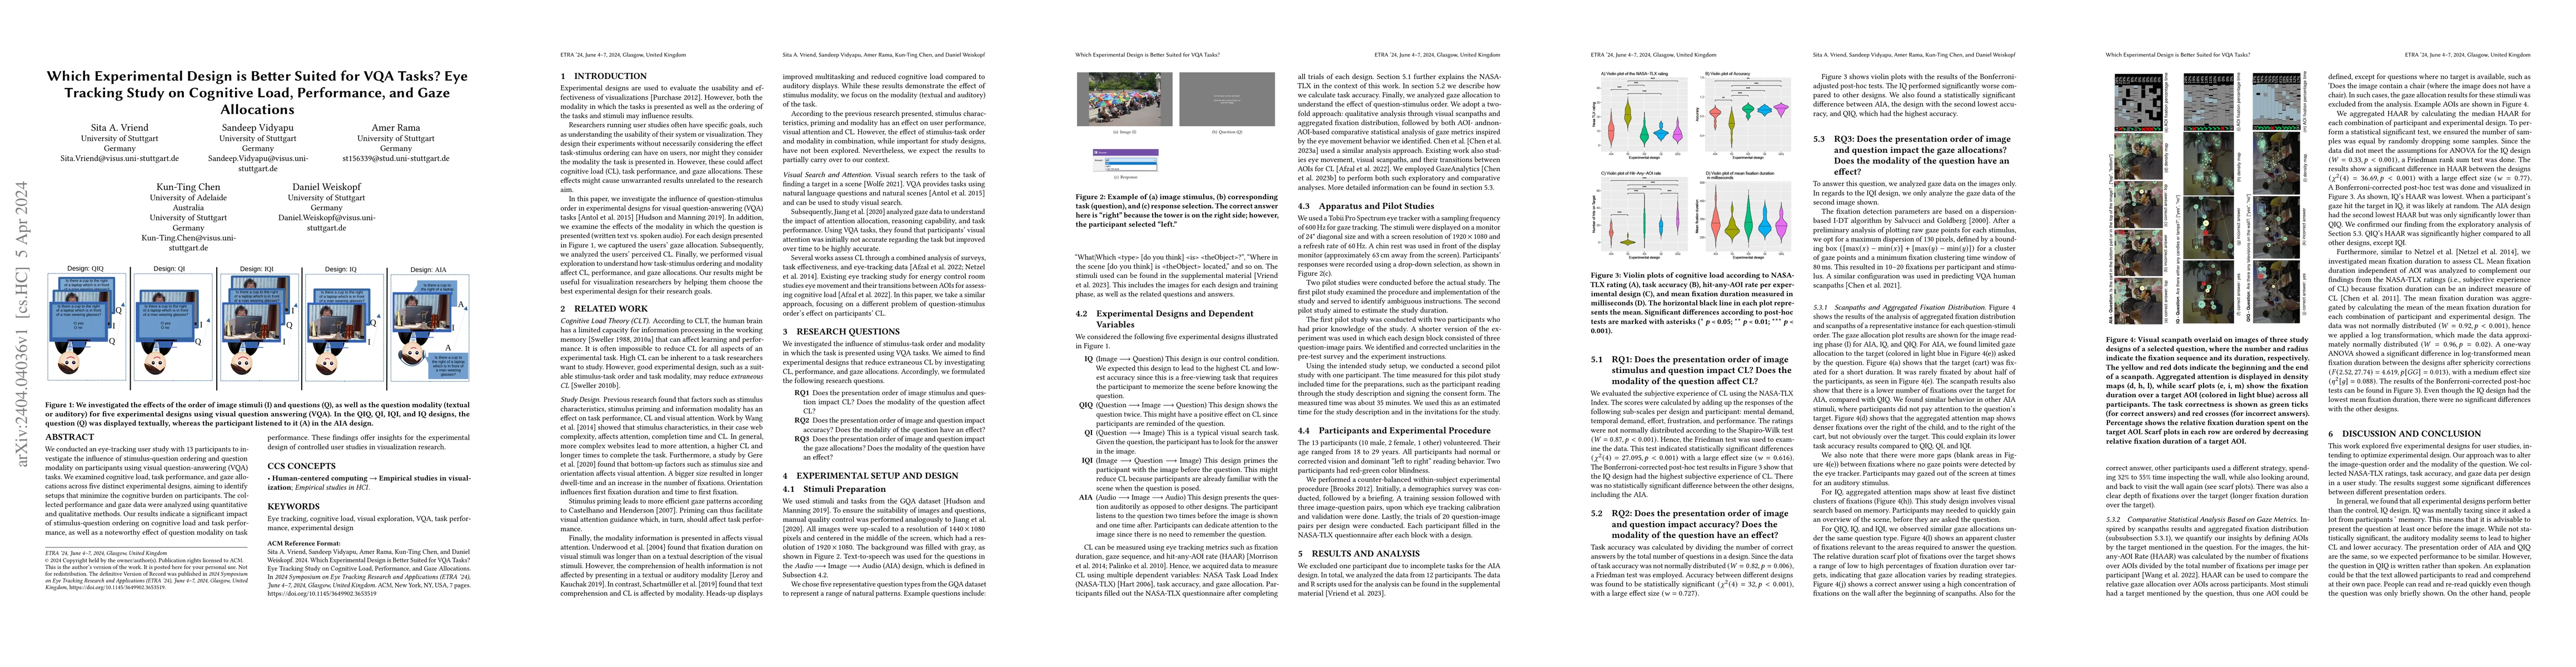
We conducted an eye-tracking user study with 13 participants to investigate the influence of stimulus-question ordering and question modality on participants using visual question-answering (VQA) ta...
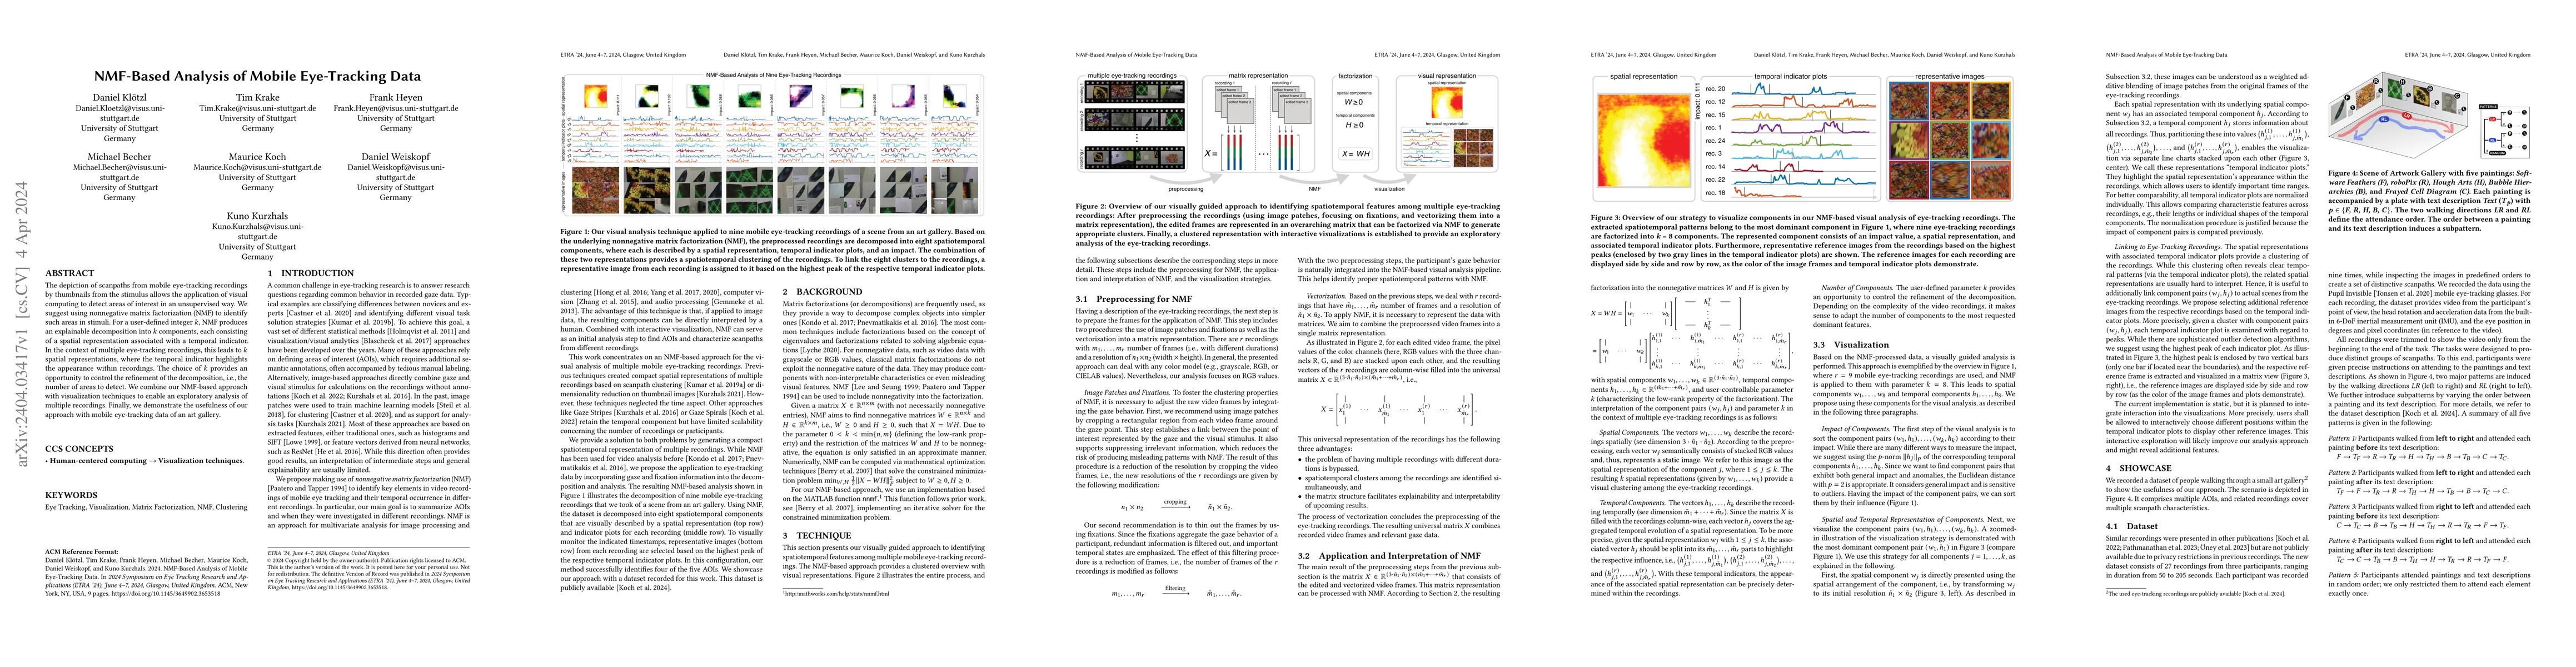
The depiction of scanpaths from mobile eye-tracking recordings by thumbnails from the stimulus allows the application of visual computing to detect areas of interest in an unsupervised way. We sugge...
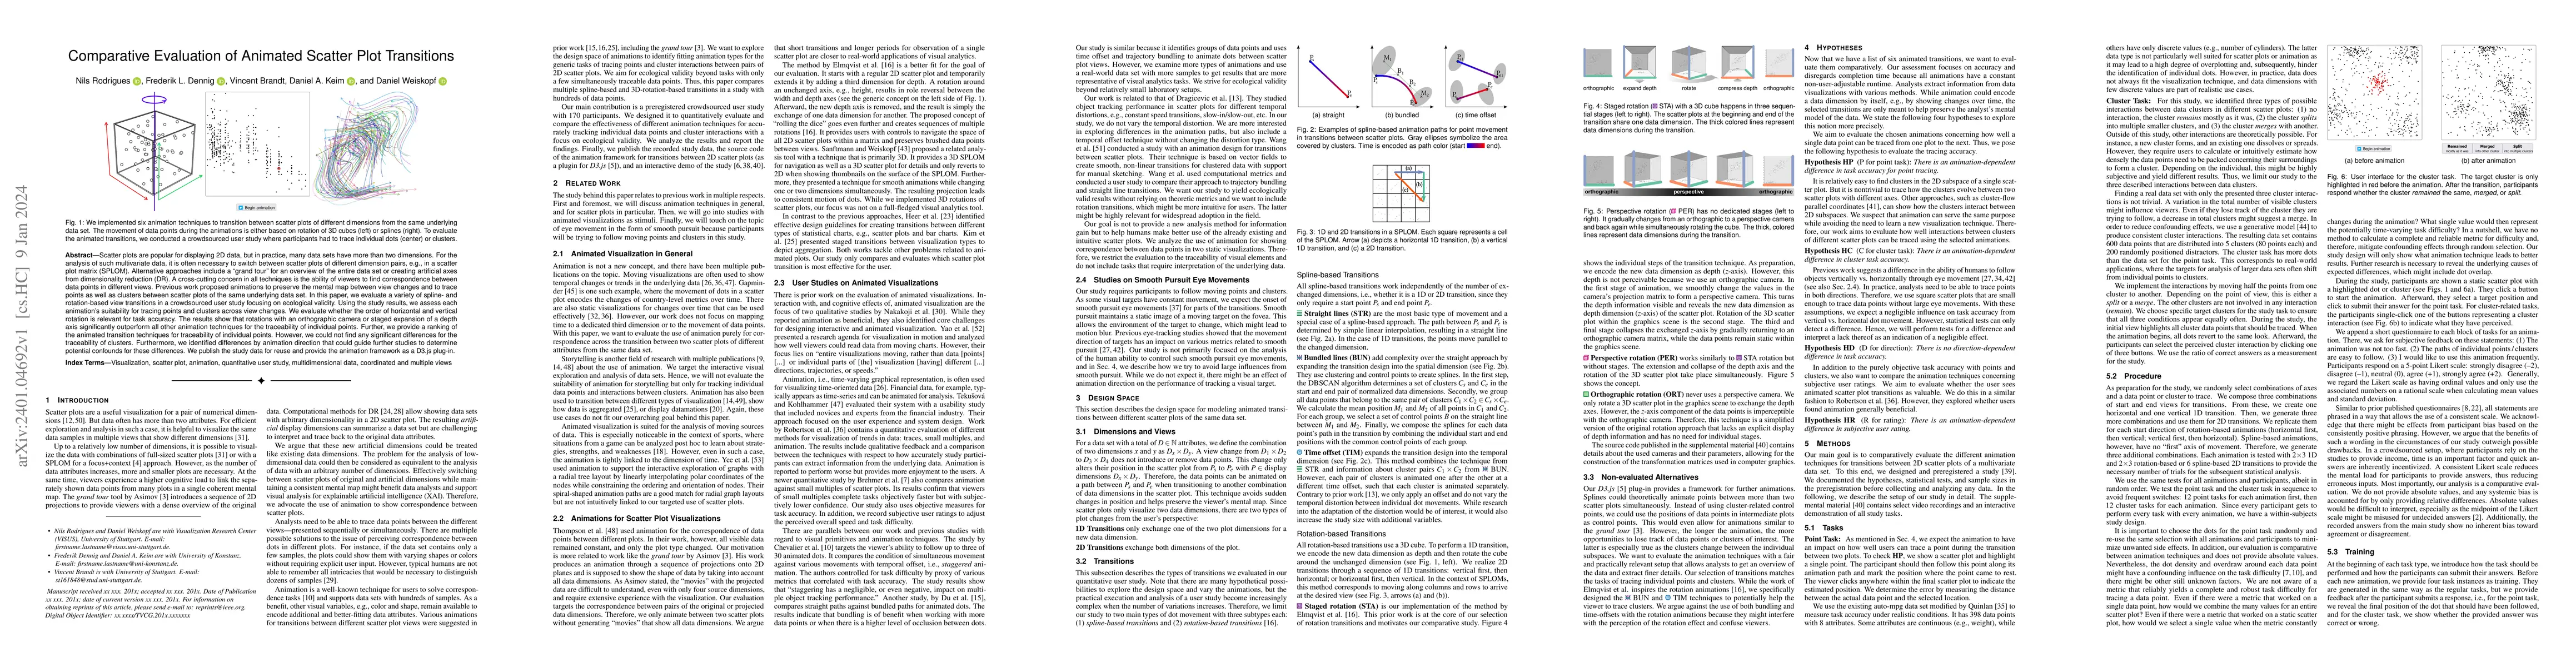
Scatter plots are popular for displaying 2D data, but in practice, many data sets have more than two dimensions. For the analysis of such multivariate data, it is often necessary to switch between s...
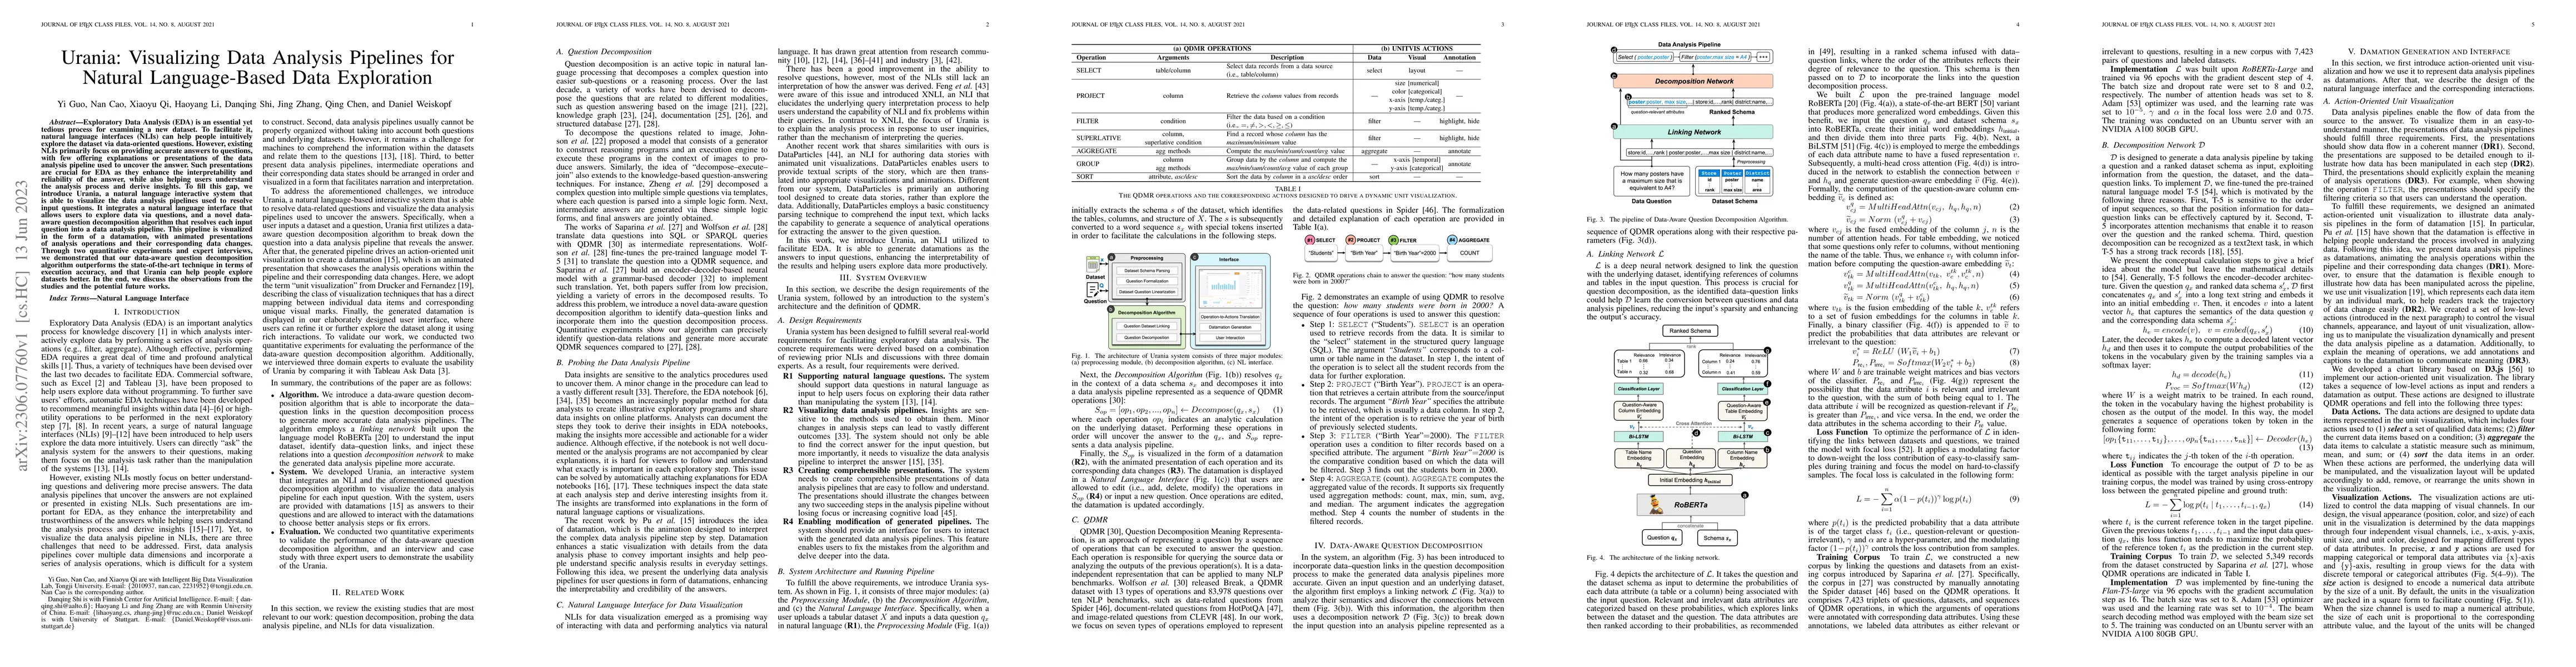
Exploratory Data Analysis (EDA) is an essential yet tedious process for examining a new dataset. To facilitate it, natural language interfaces (NLIs) can help people intuitively explore the dataset ...
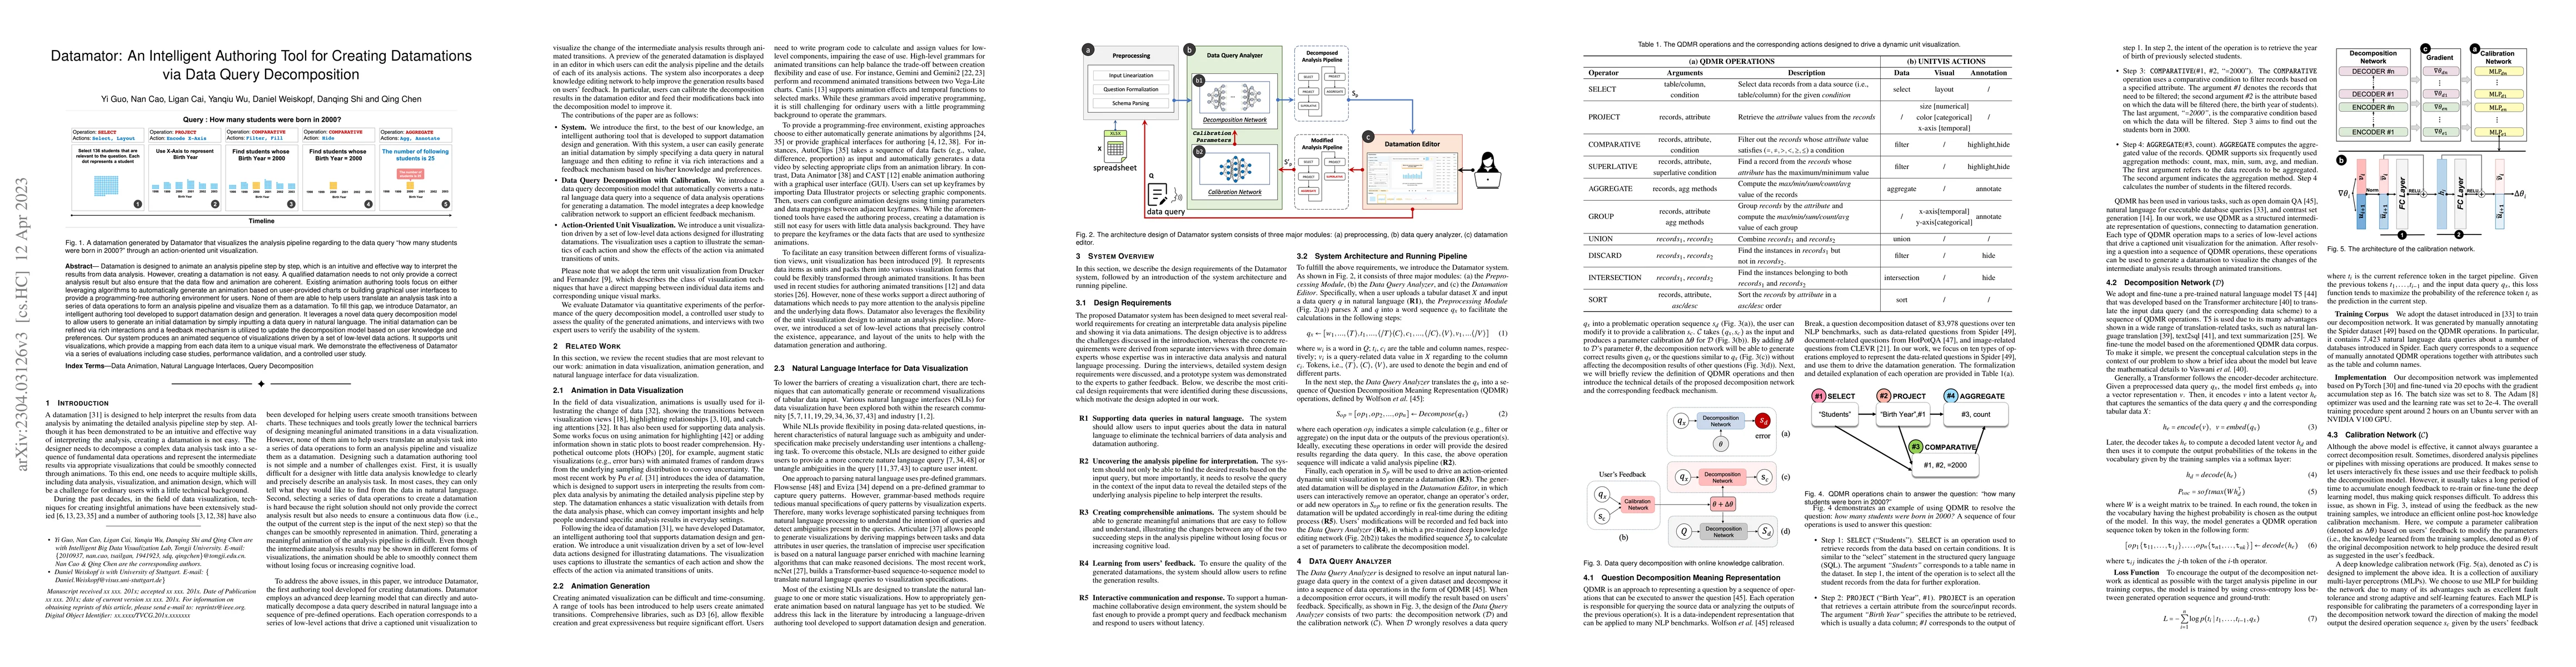
Datamation is designed to animate an analysis pipeline step by step, which is an intuitive and effective way to interpret the results from data analysis. However, creating a datamation is not easy. ...
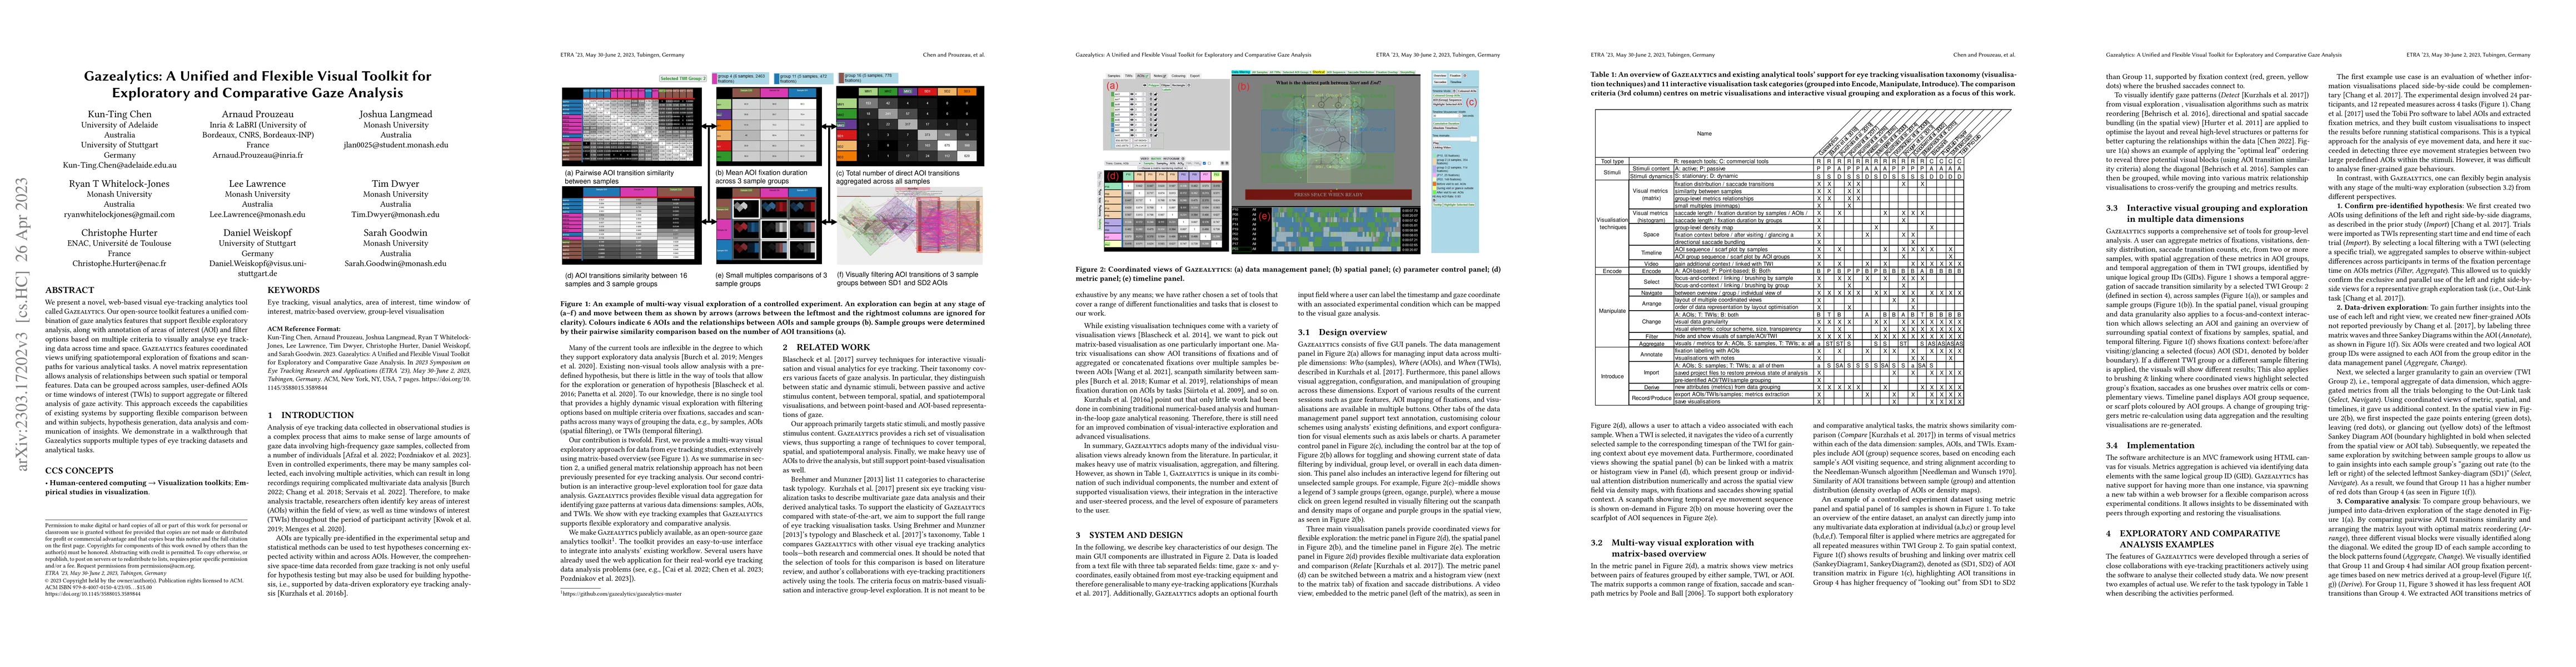
We present a novel, web-based visual eye-tracking analytics tool called Gazealytics. Our open-source toolkit features a unified combination of gaze analytics features that support flexible explorato...
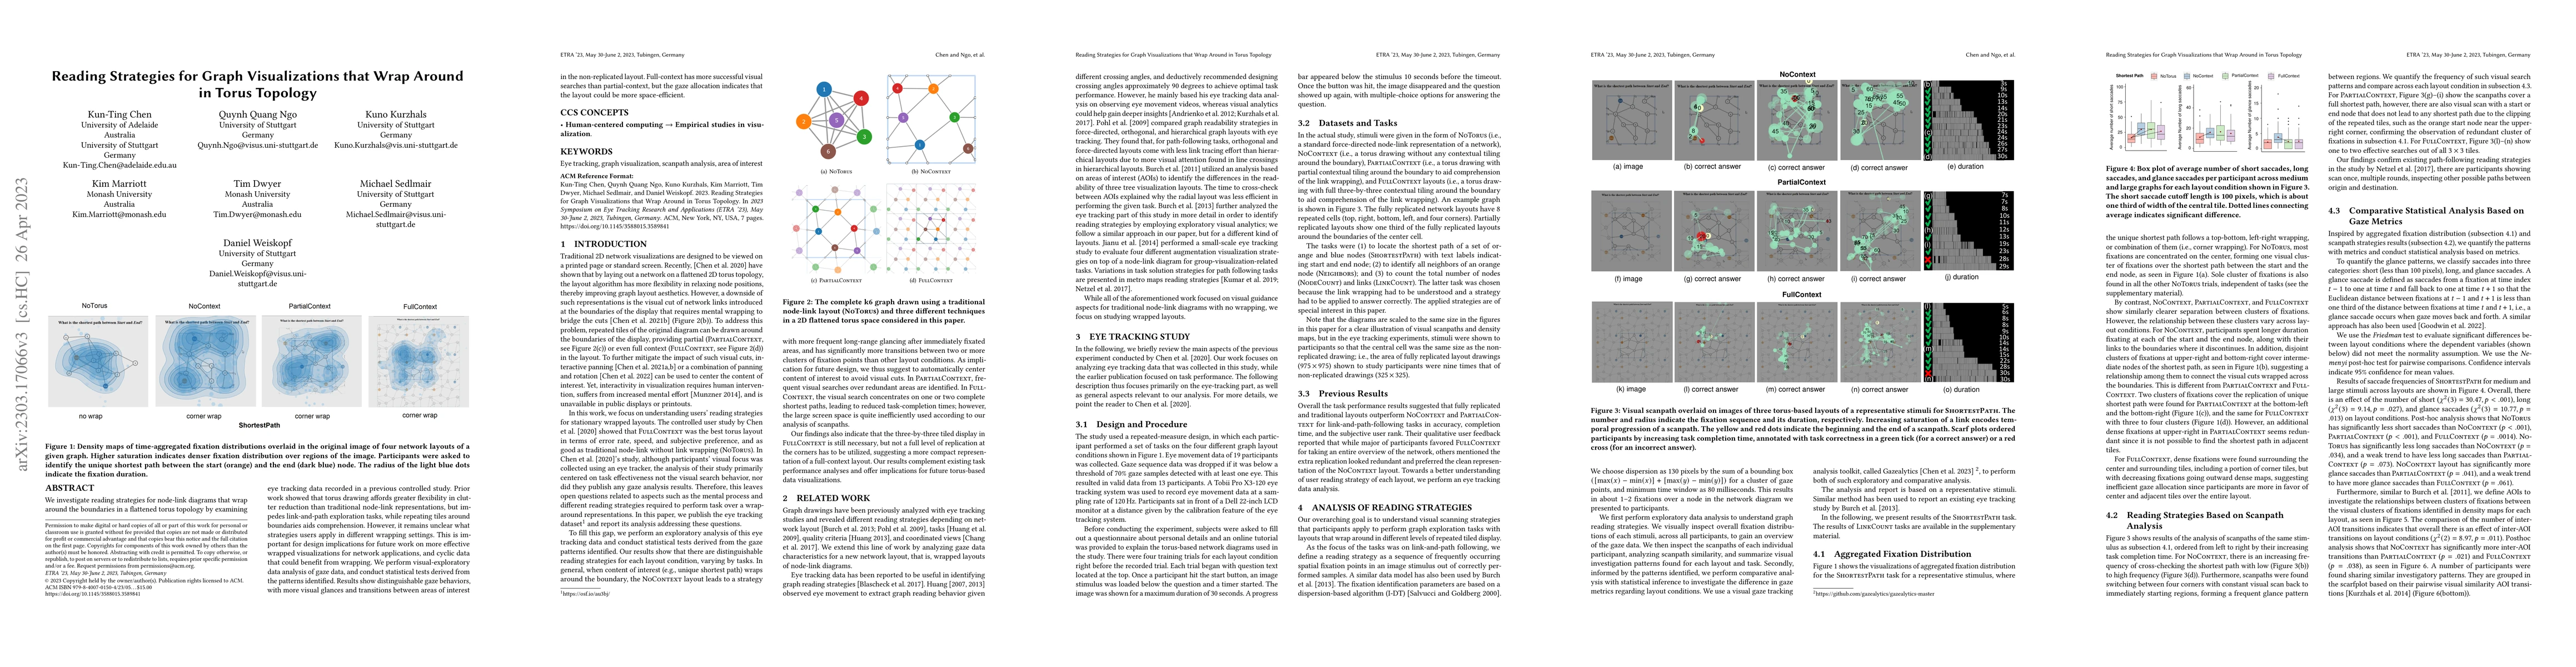
We investigate reading strategies for node-link diagrams that wrap around the boundaries in a flattened torus topology by examining eye tracking data recorded in a previous controlled study. Prior w...
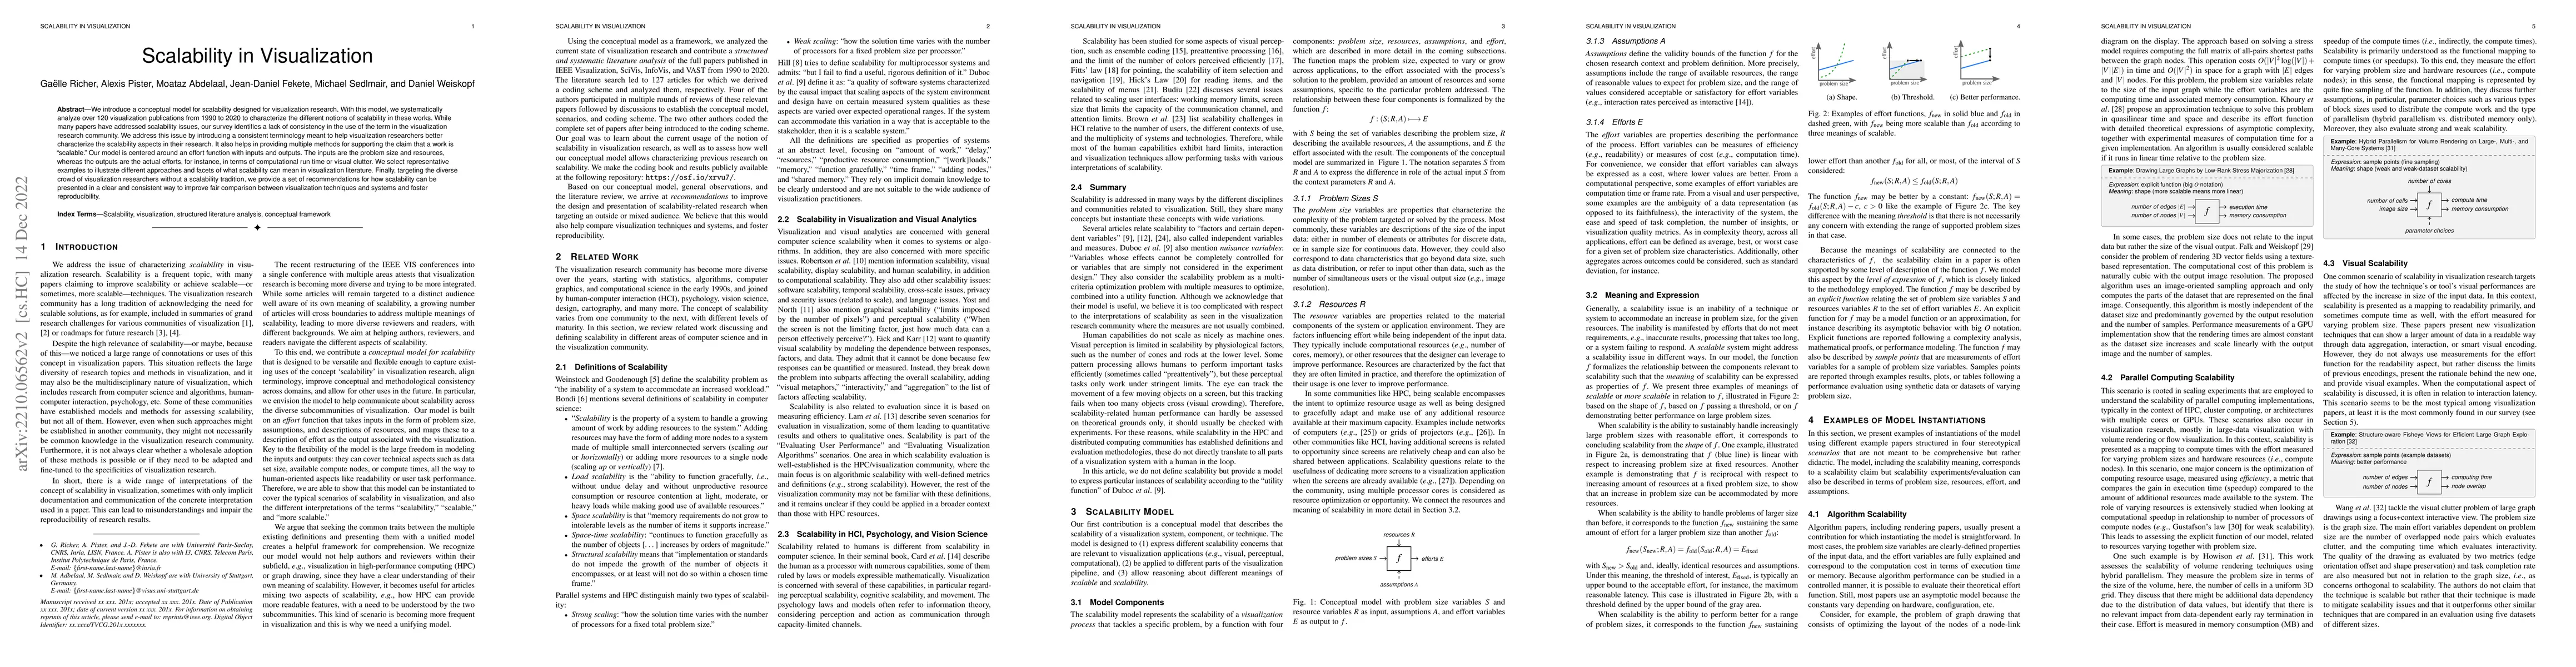
We introduce a conceptual model for scalability designed for visualization research. With this model, we systematically analyze over 120 visualization publications from 1990-2020 to characterize the...
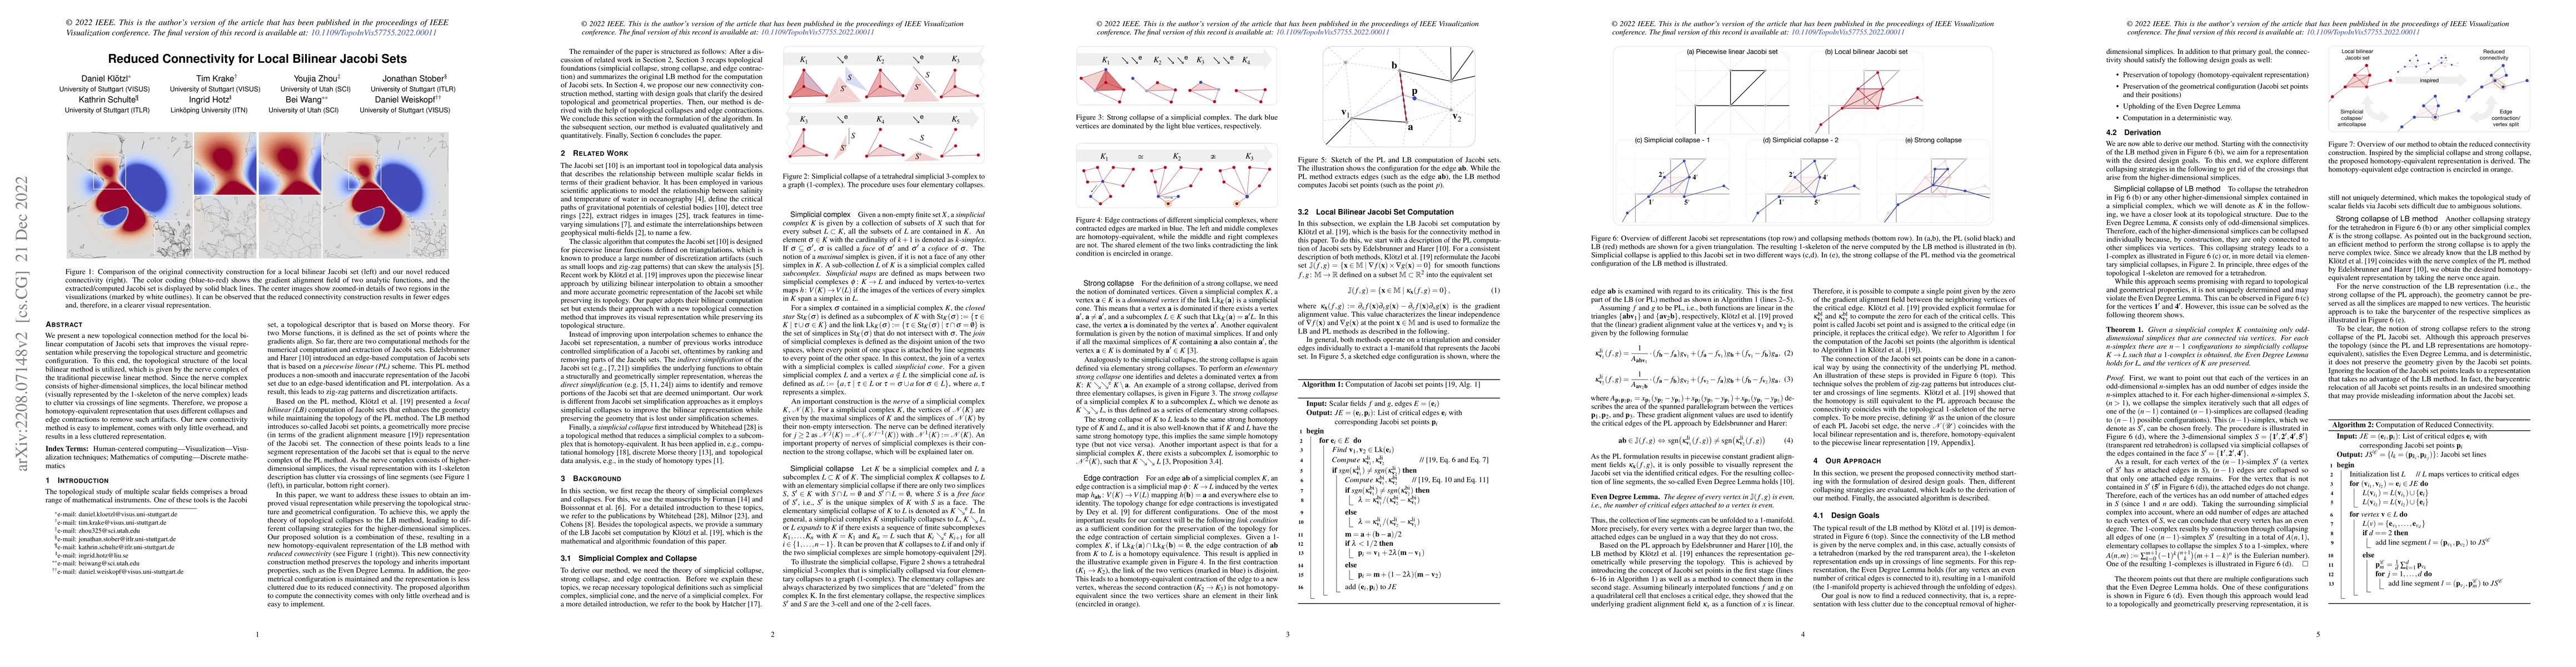
We present a new topological connection method for the local bilinear computation of Jacobi sets that improves the visual representation while preserving the topological structure and geometric conf...
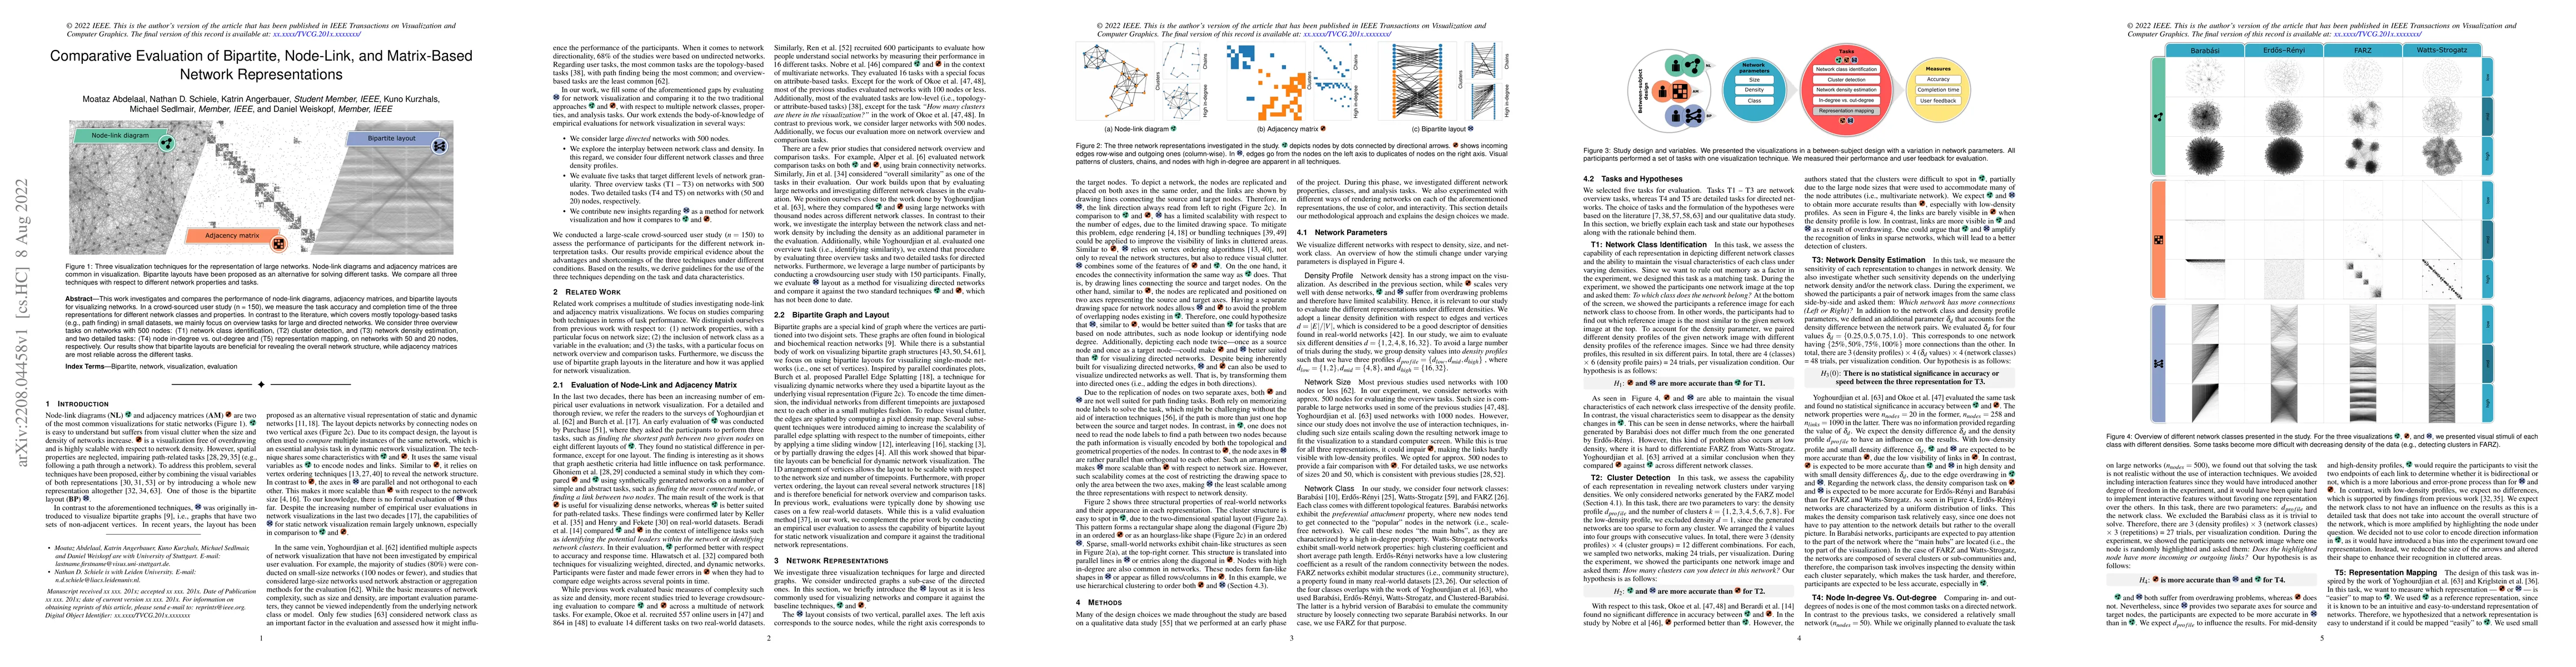
This work investigates and compares the performance of node-link diagrams, adjacency matrices, and bipartite layouts for visualizing networks. In a crowd-sourced user study (n = 150), we measure the...
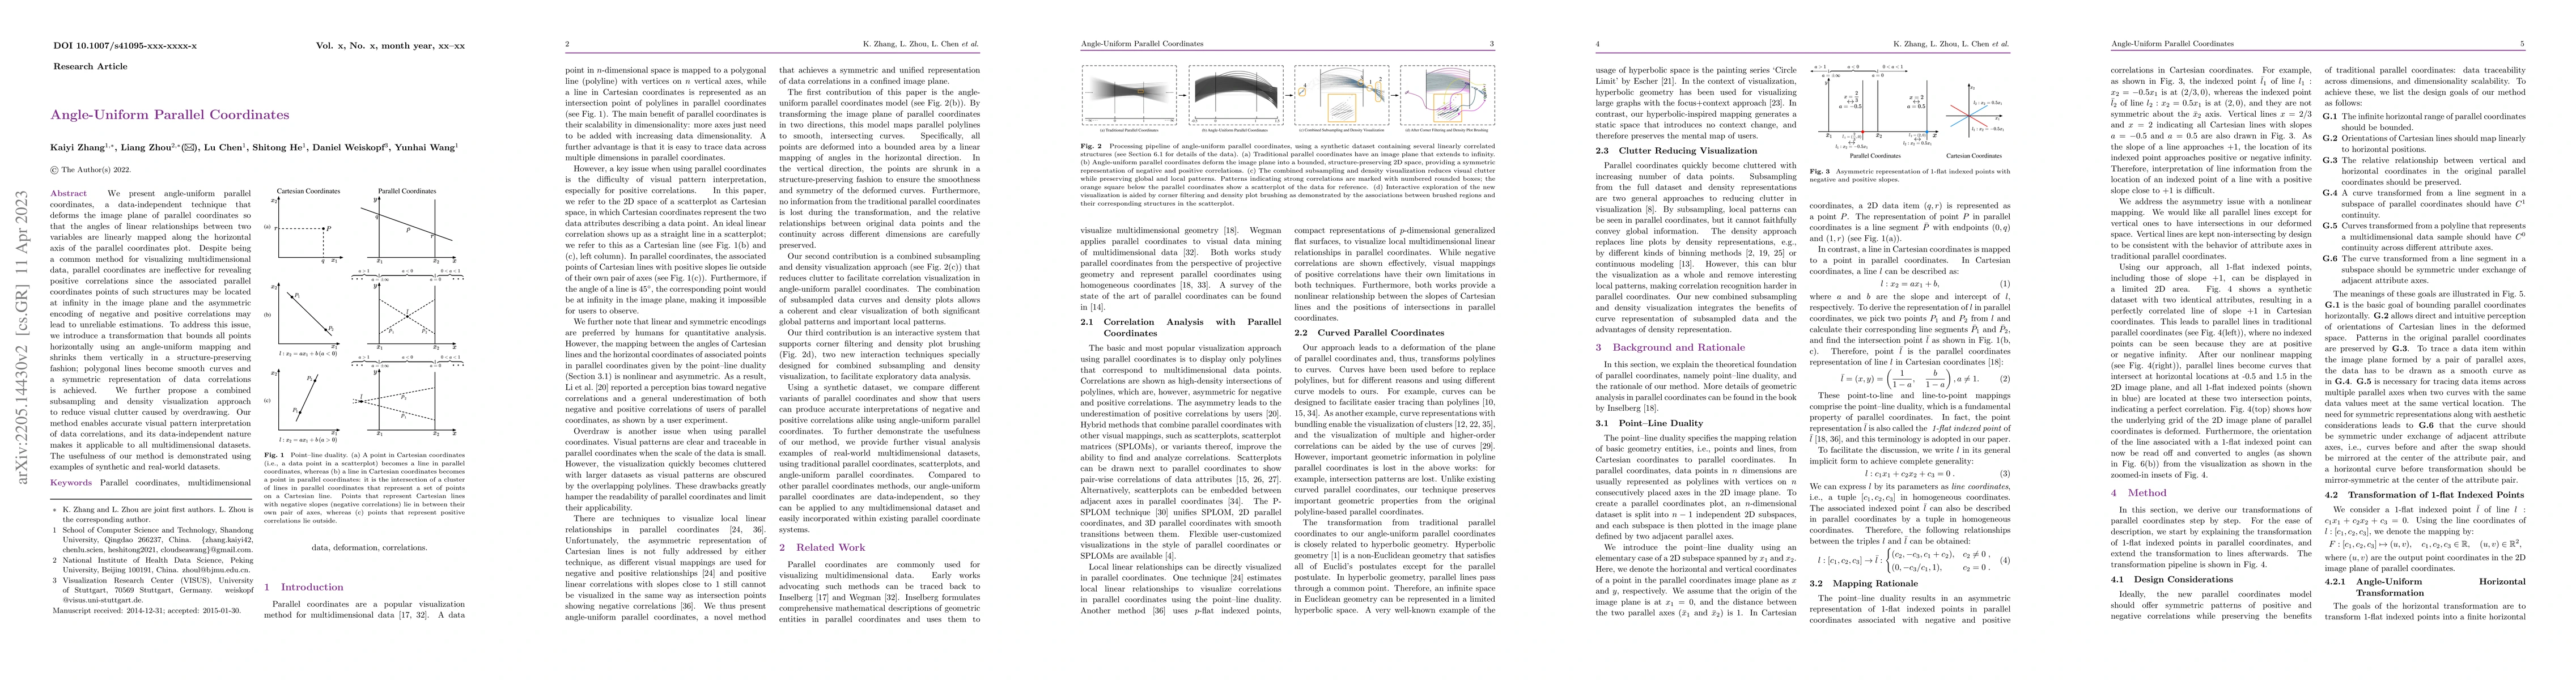
We present angle-uniform parallel coordinates, a data-independent technique that deforms the image plane of parallel coordinates so that the angles of linear relationships between two variables are ...
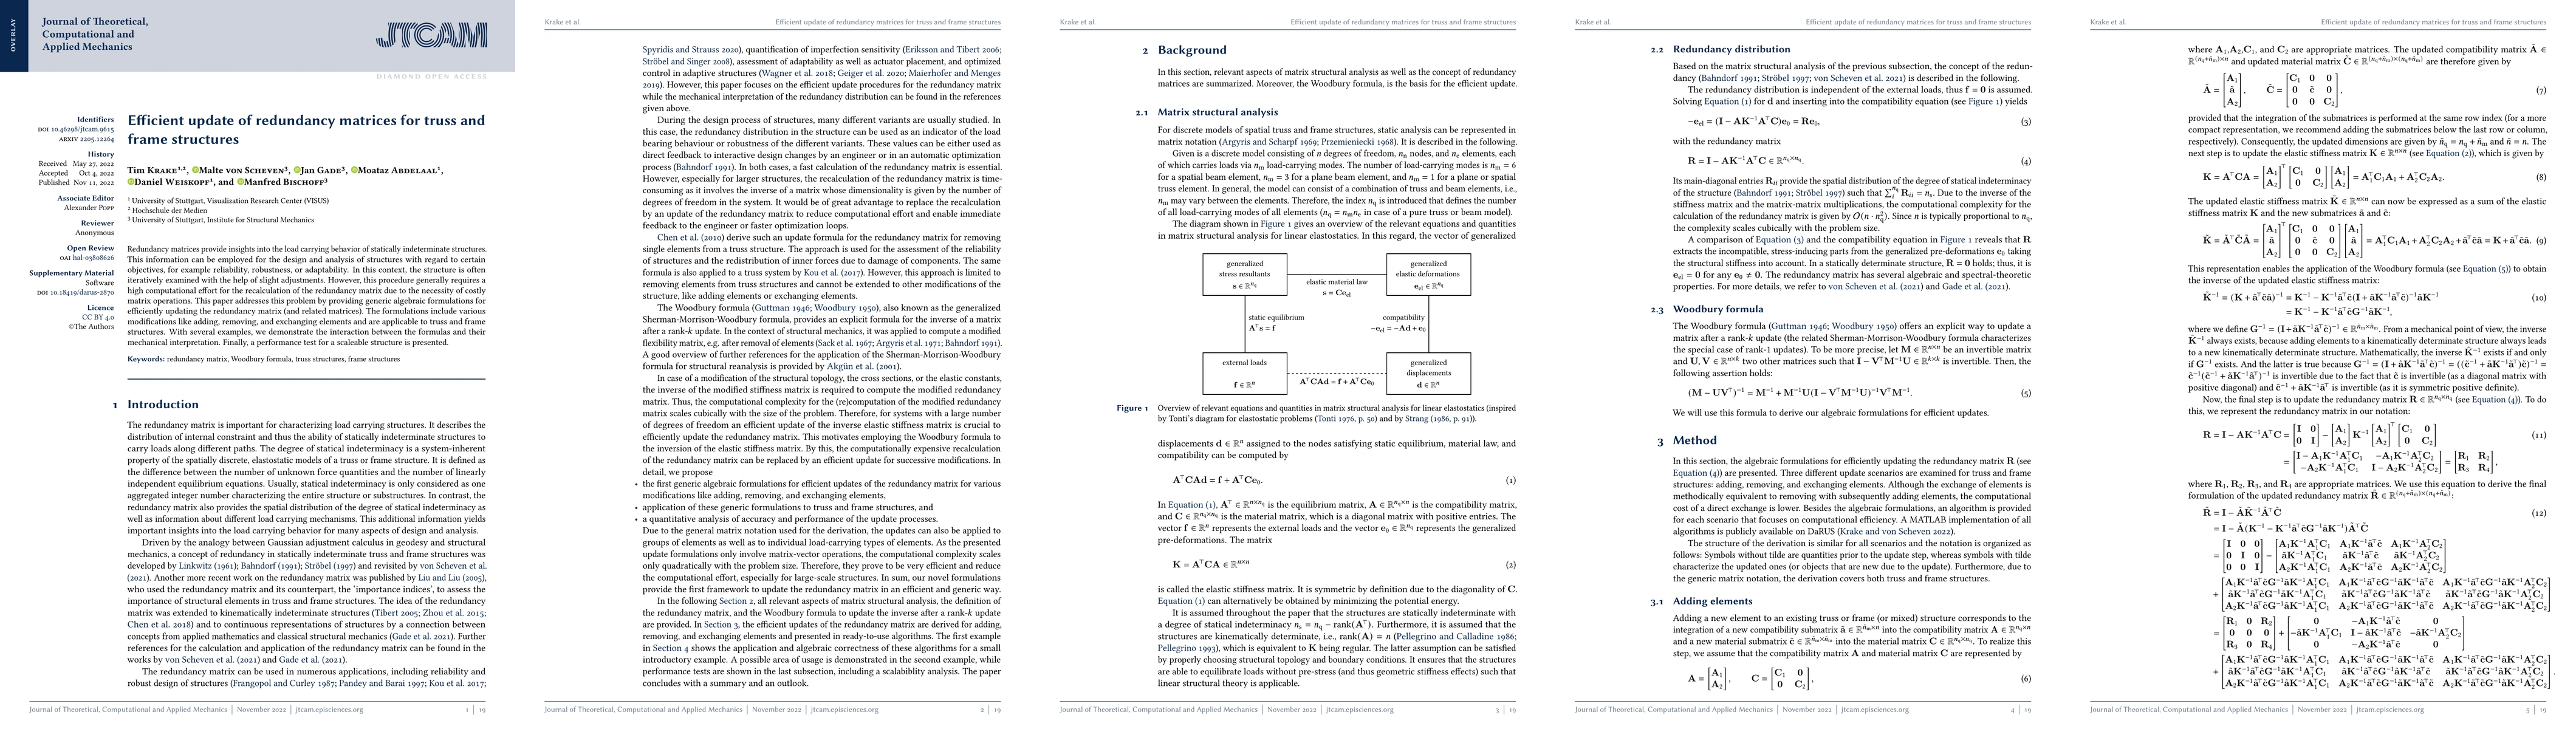
Redundancy matrices provide insights into the load carrying behavior of statically indeterminate structures. This information can be employed for the design and analysis of structures with regard to...
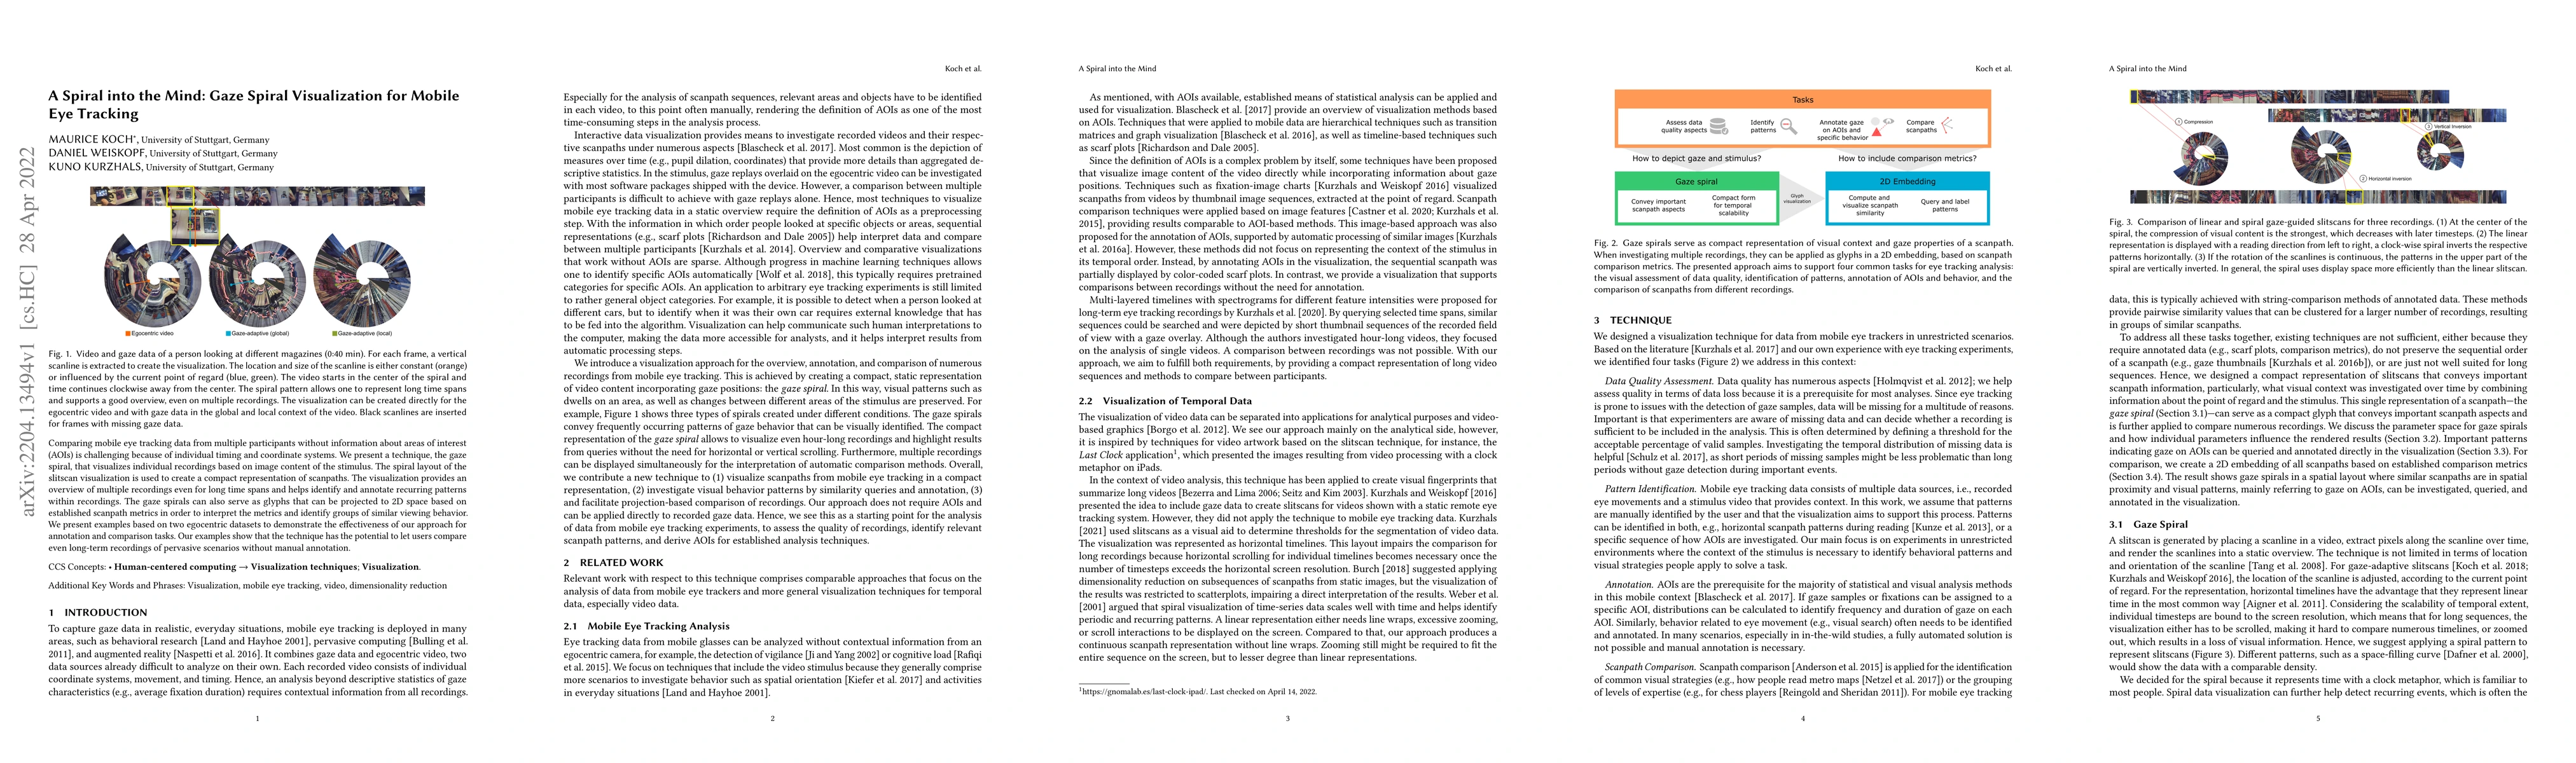
Comparing mobile eye tracking data from multiple participants without information about areas of interest (AOIs) is challenging because of individual timing and coordinate systems. We present a tech...
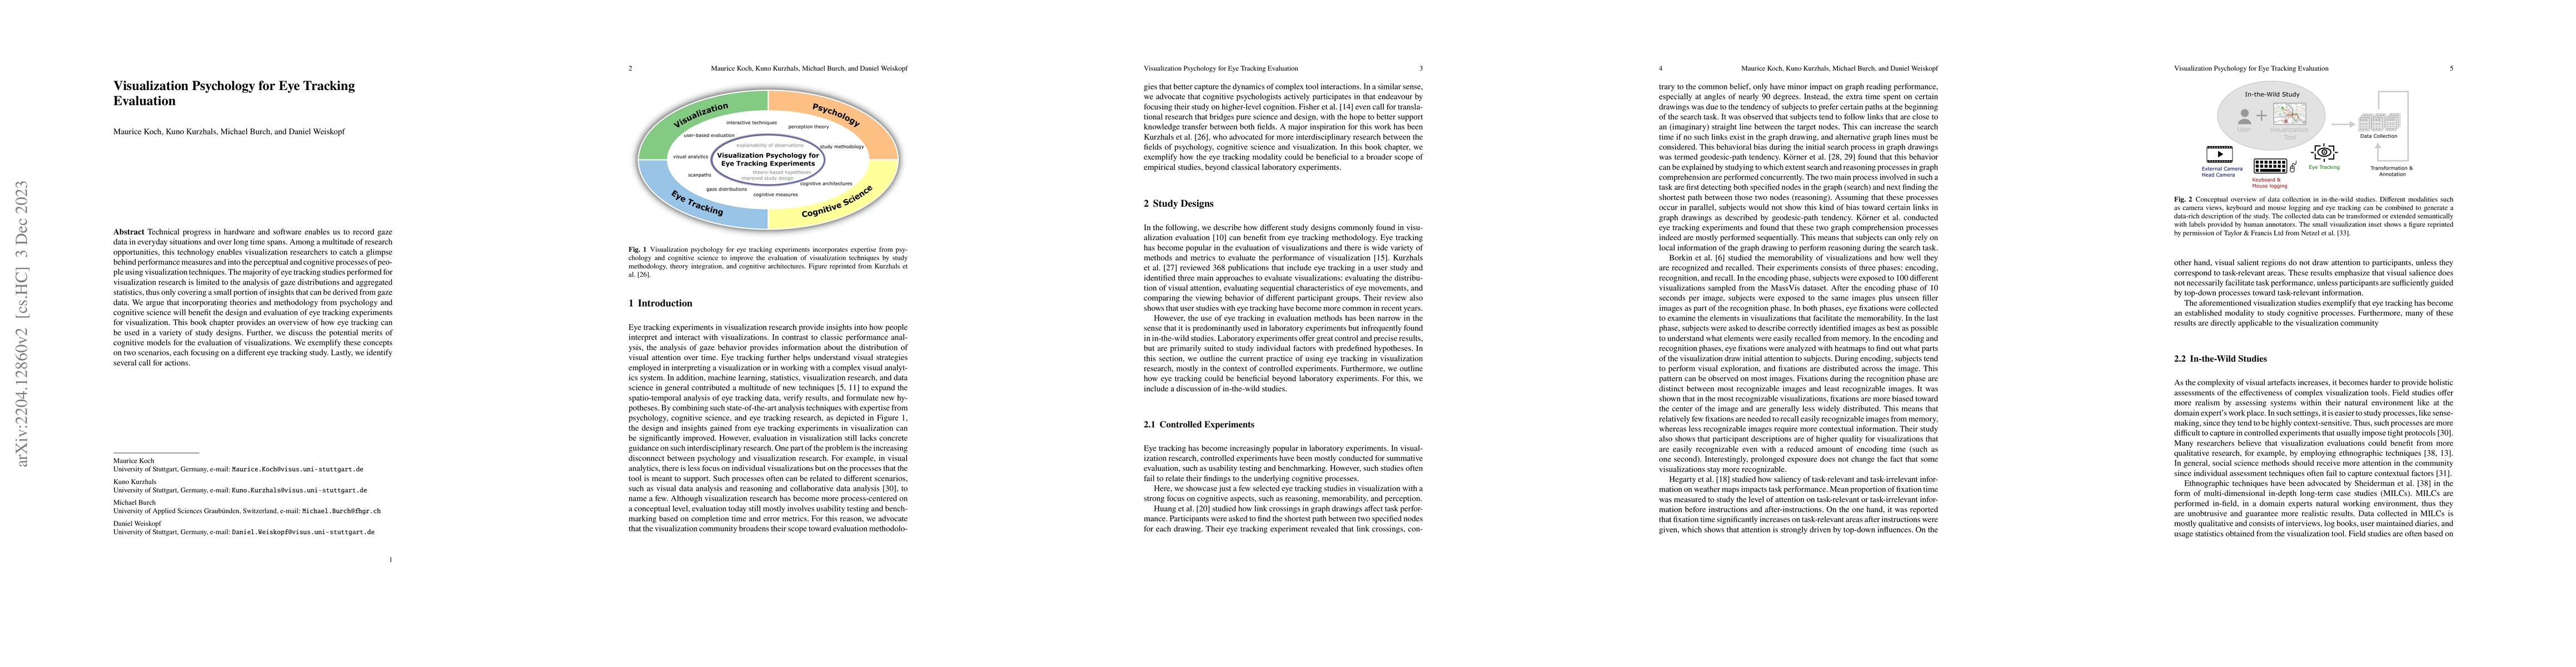
Technical progress in hardware and software enables us to record gaze data in everyday situations and over long time spans. Among a multitude of research opportunities, this technology enables visua...
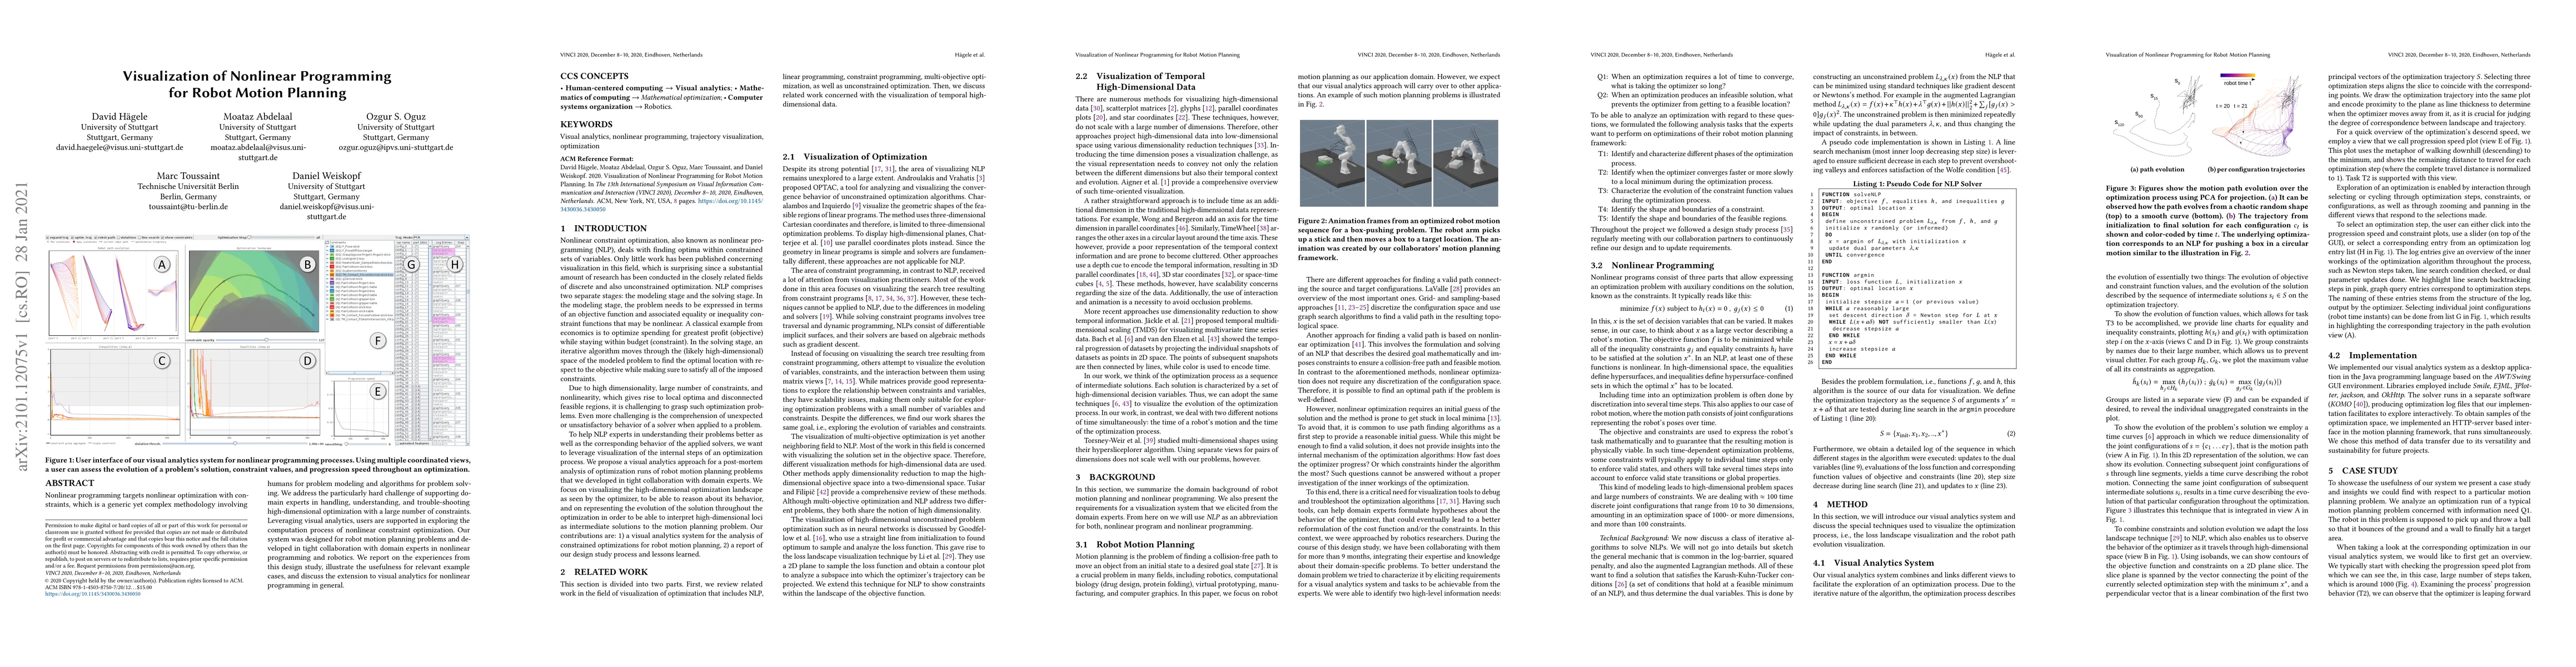
Nonlinear programming targets nonlinear optimization with constraints, which is a generic yet complex methodology involving humans for problem modeling and algorithms for problem solving. We address...
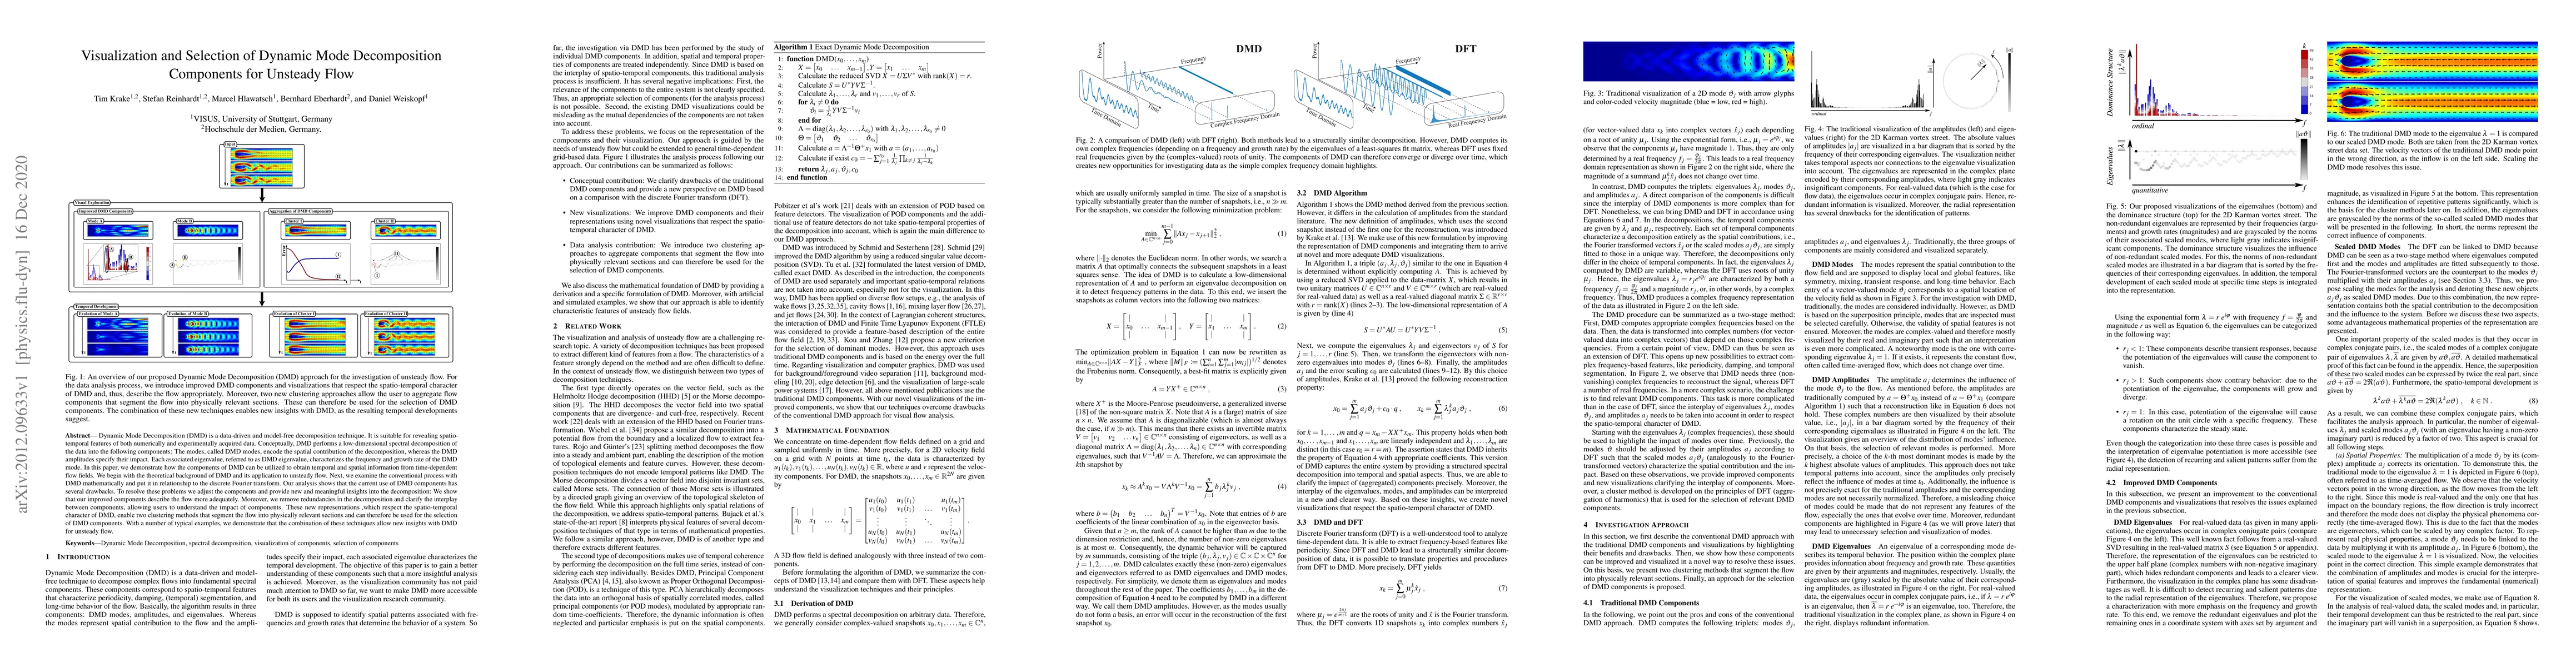
Dynamic Mode Decomposition (DMD) is a data-driven and model-free decomposition technique. It is suitable for revealing spatio-temporal features of both numerically and experimentally acquired data. ...
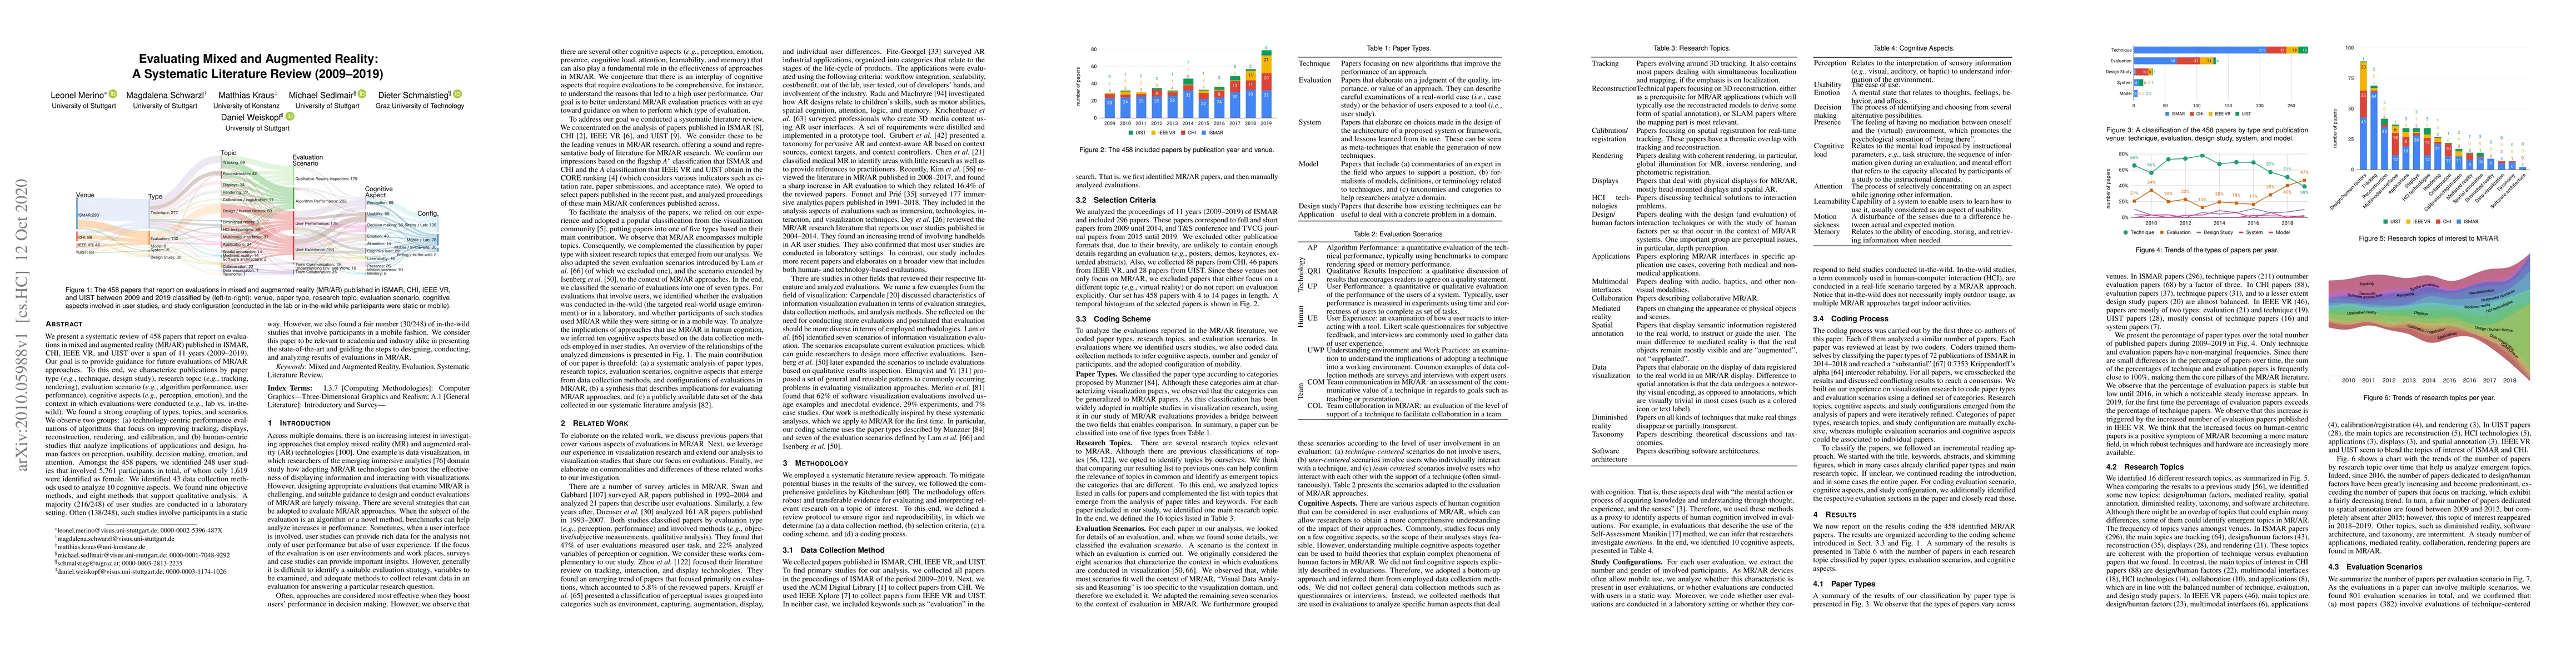
We present a systematic review of 458 papers that report on evaluations in mixed and augmented reality (MR/AR) published in ISMAR, CHI, IEEE VR, and UIST over a span of 11 years (2009-2019). Our goa...
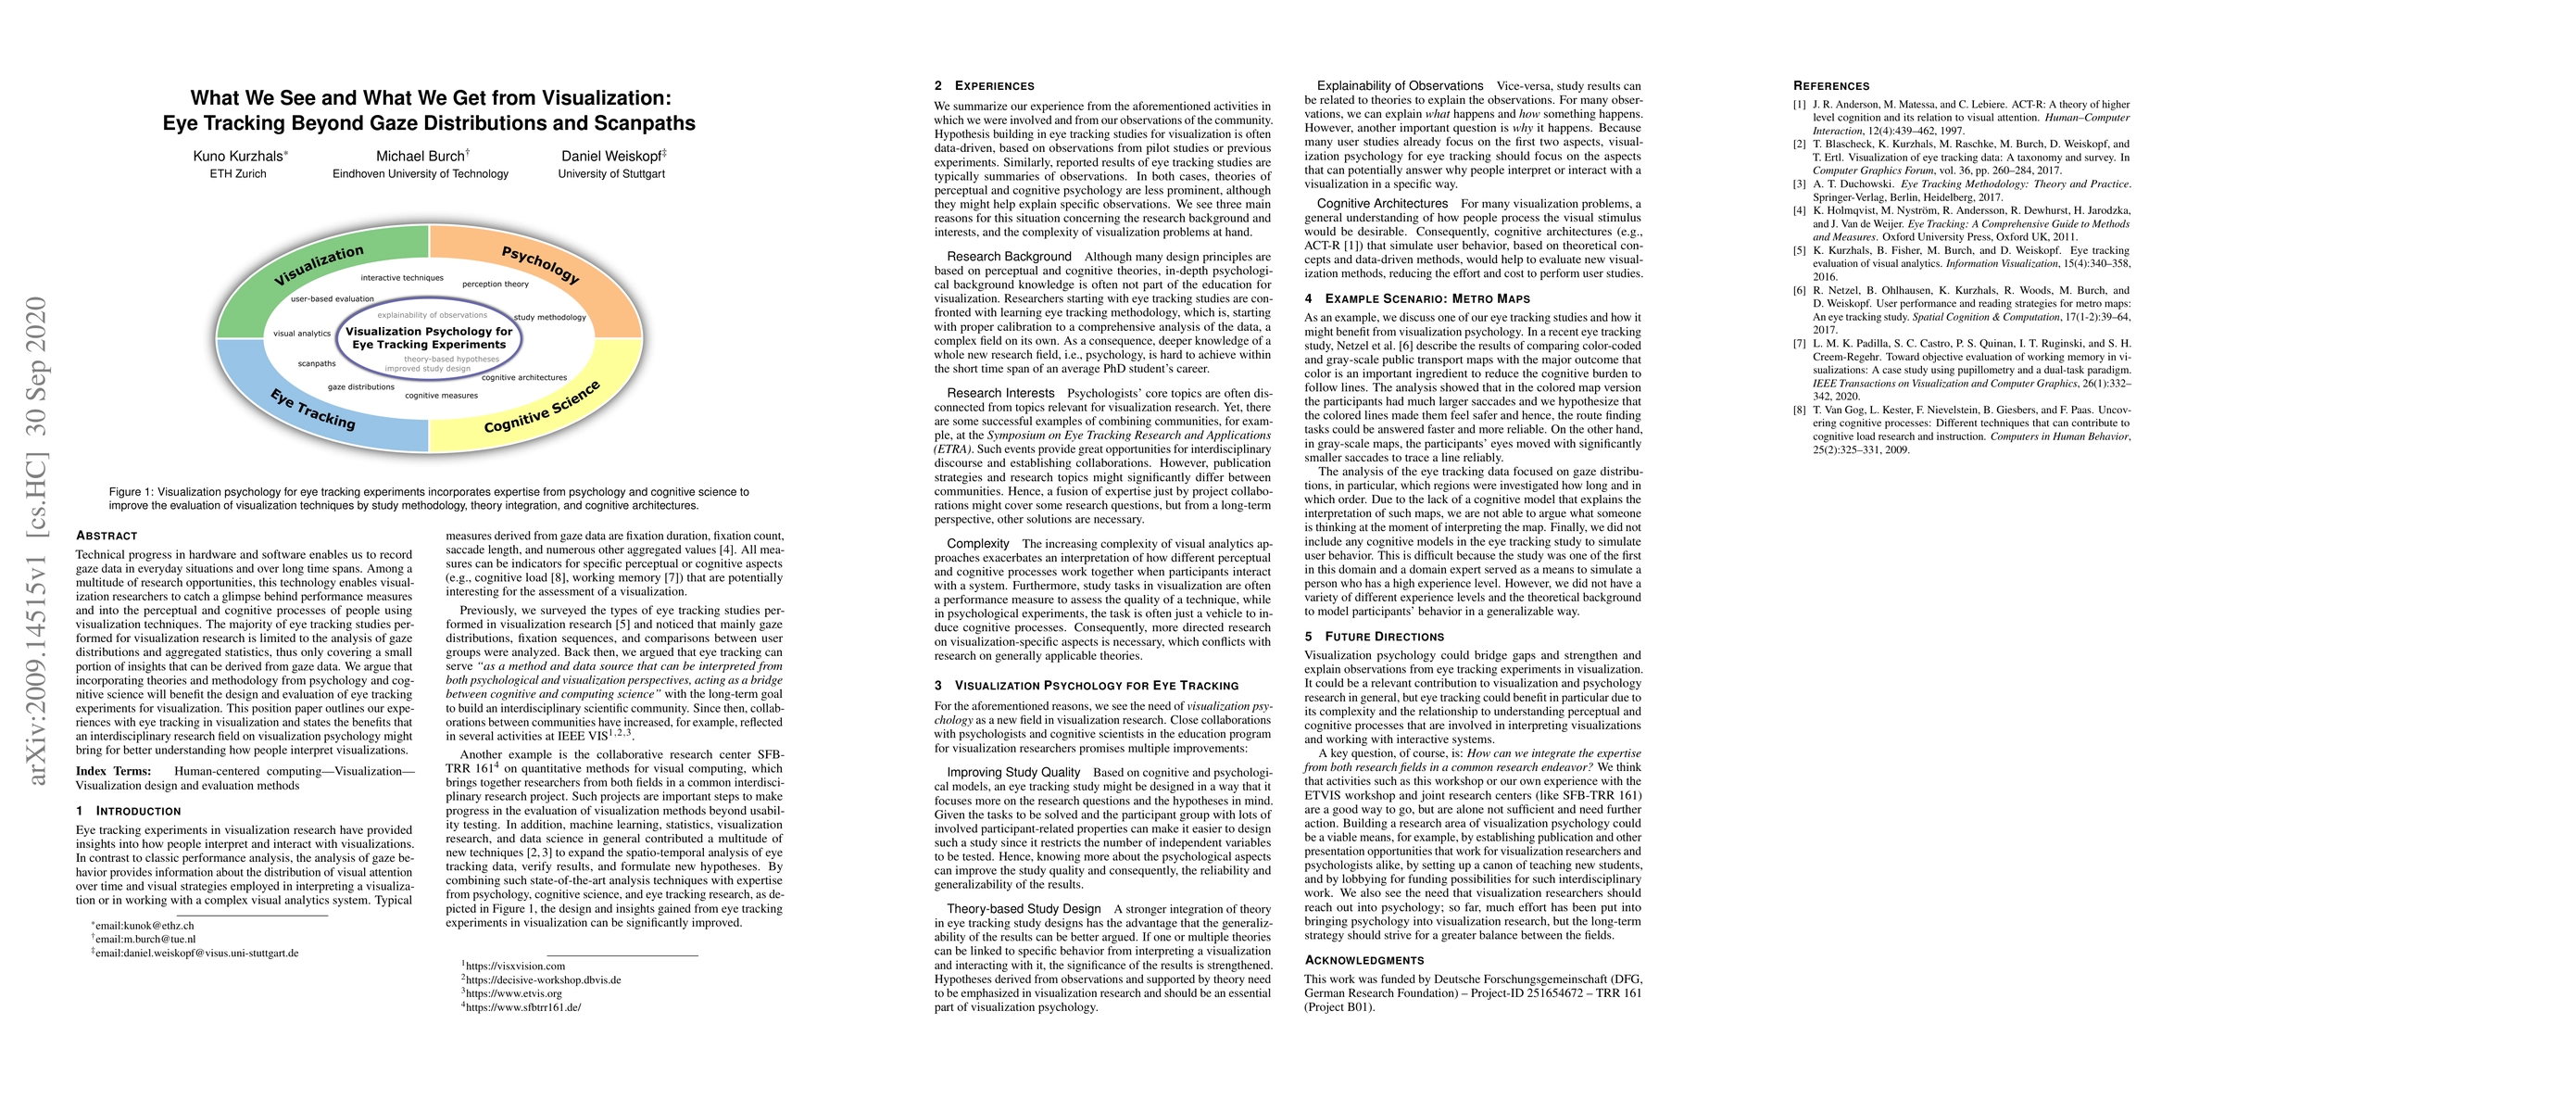
Technical progress in hardware and software enables us to record gaze data in everyday situations and over long time spans. Among a multitude of research opportunities, this technology enables visua...
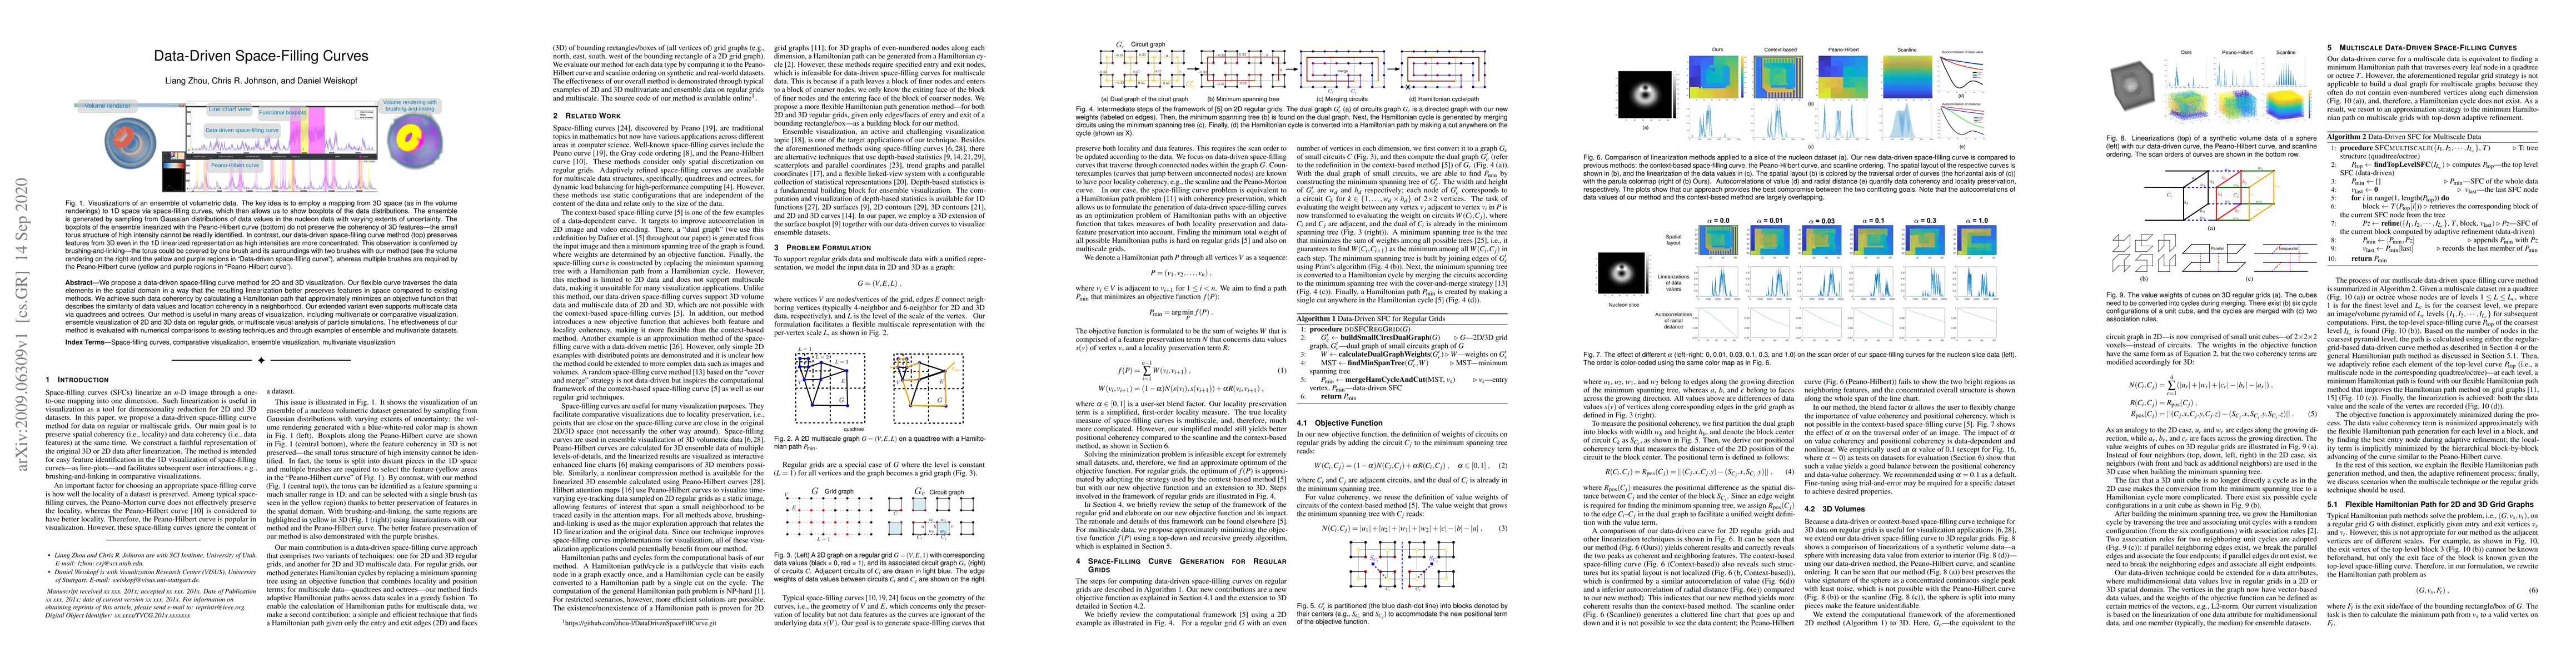
We propose a data-driven space-filling curve method for 2D and 3D visualization. Our flexible curve traverses the data elements in the spatial domain in a way that the resulting linearization better...
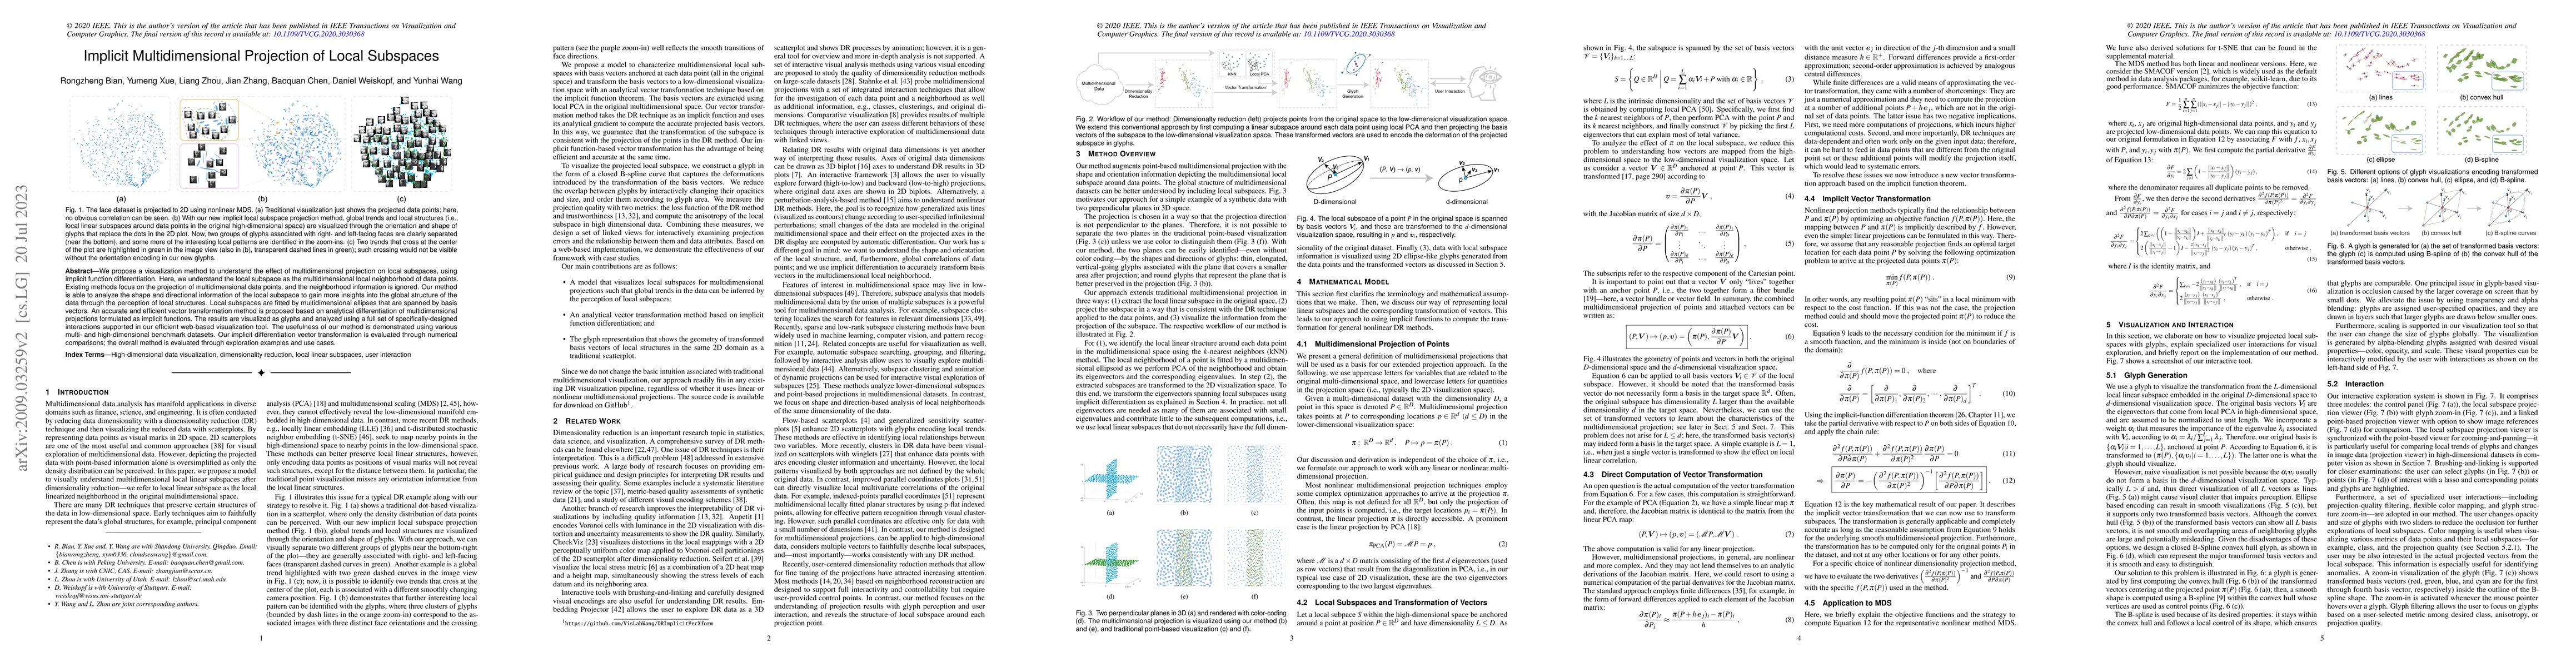
We propose a visualization method to understand the effect of multidimensional projection on local subspaces, using implicit function differentiation. Here, we understand the local subspace as the m...
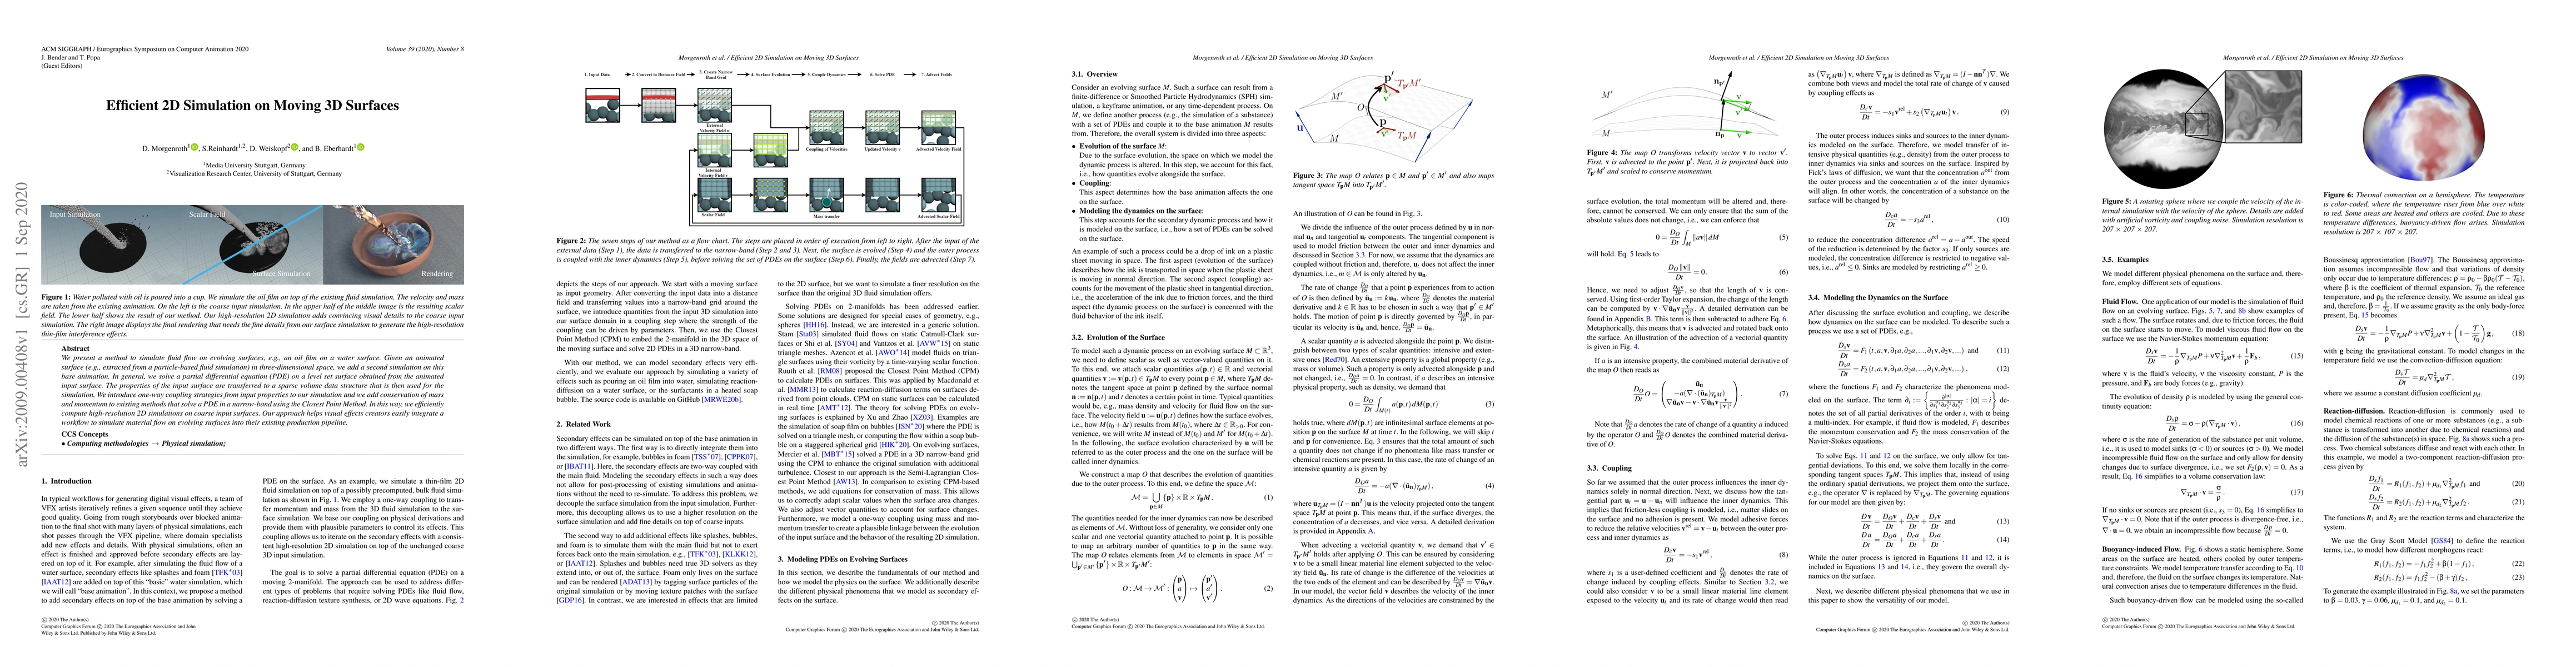
We present a method to simulate fluid flow on evolving surfaces, e.g., an oil film on a water surface. Given an animated surface (e.g., extracted from a particle-based fluid simulation) in three-dim...

Causality is crucial to understanding the mechanisms behind complex systems and making decisions that lead to intended outcomes. Event sequence data is widely collected from many real-world processe...
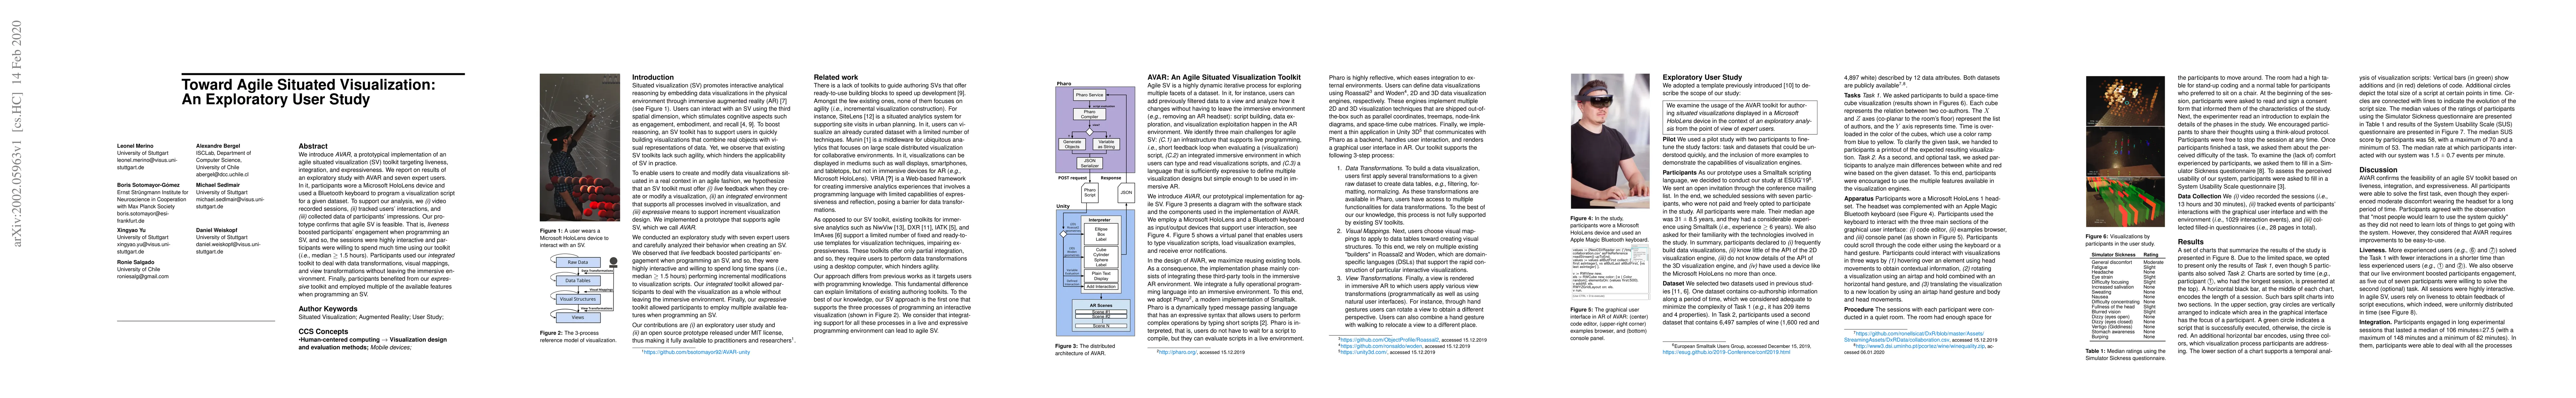
We introduce AVAR, a prototypical implementation of an agile situated visualization (SV) toolkit targeting liveness, integration, and expressiveness. We report on results of an exploratory study wit...
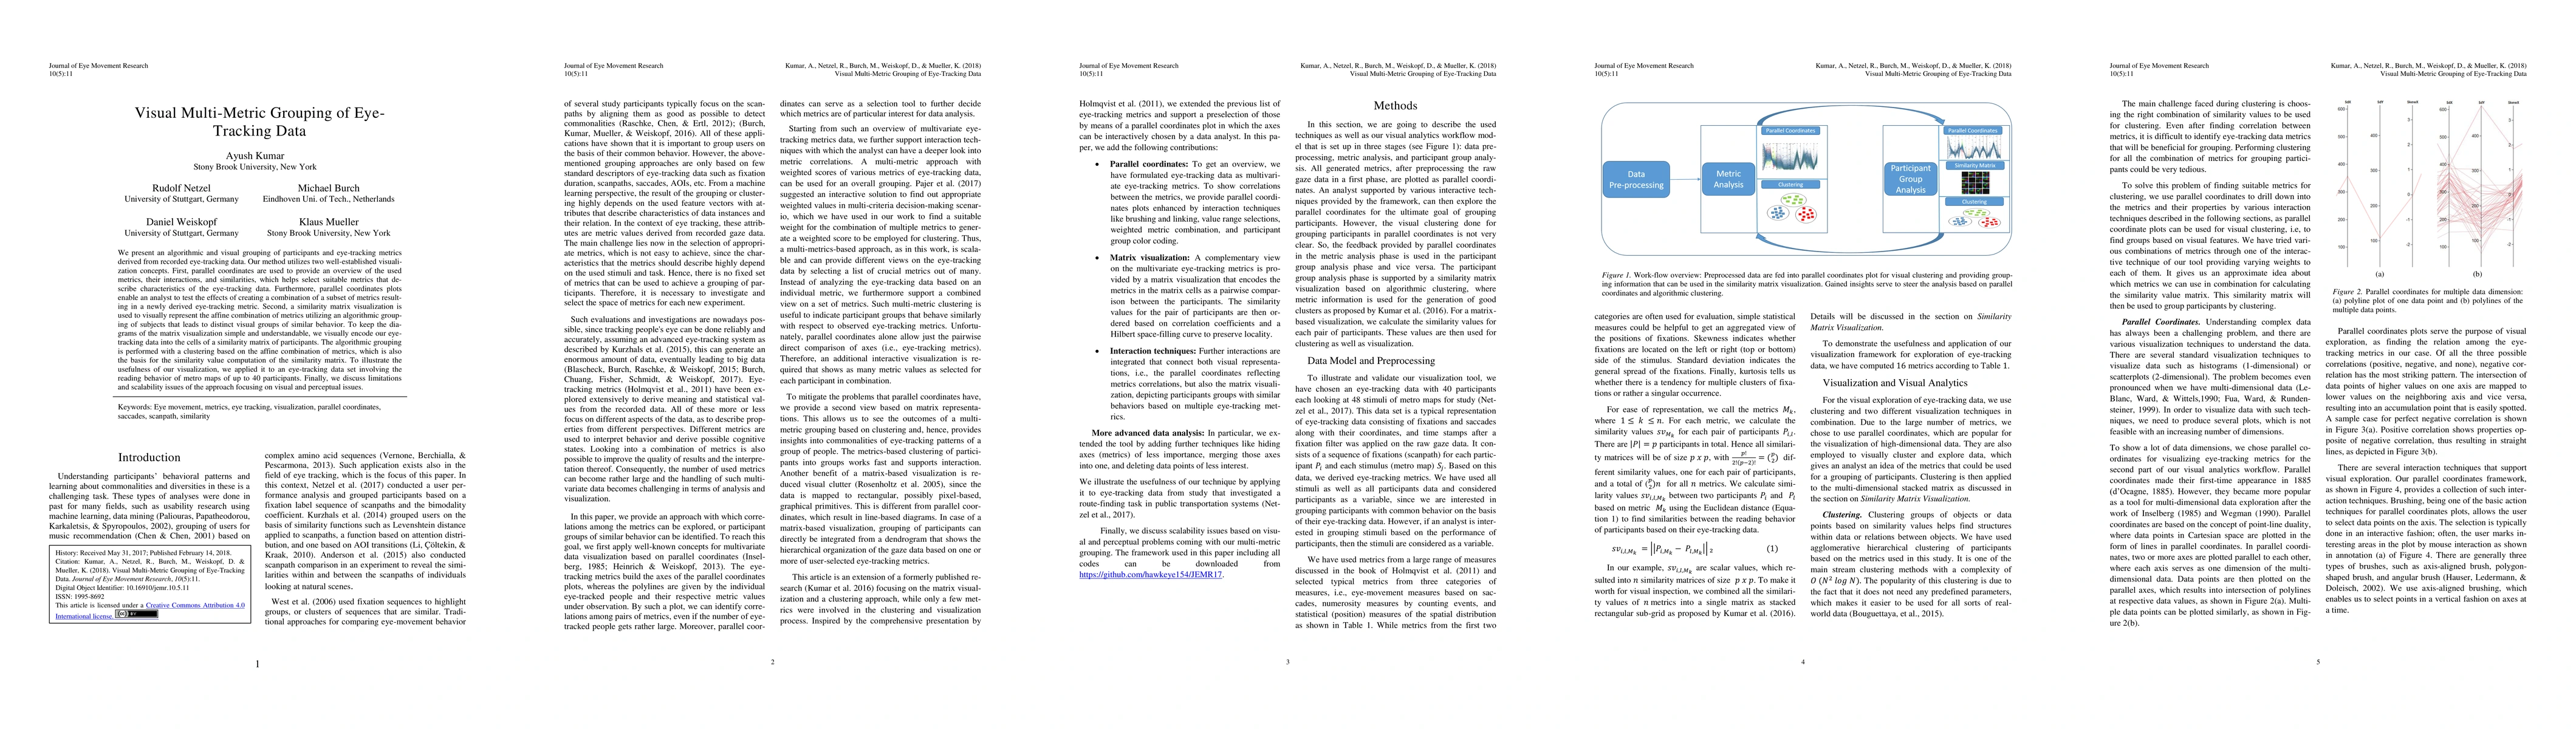
We present an algorithmic and visual grouping of participants and eye-tracking metrics derived from recorded eye-tracking data. Our method utilizes two well-established visualization concepts. First...
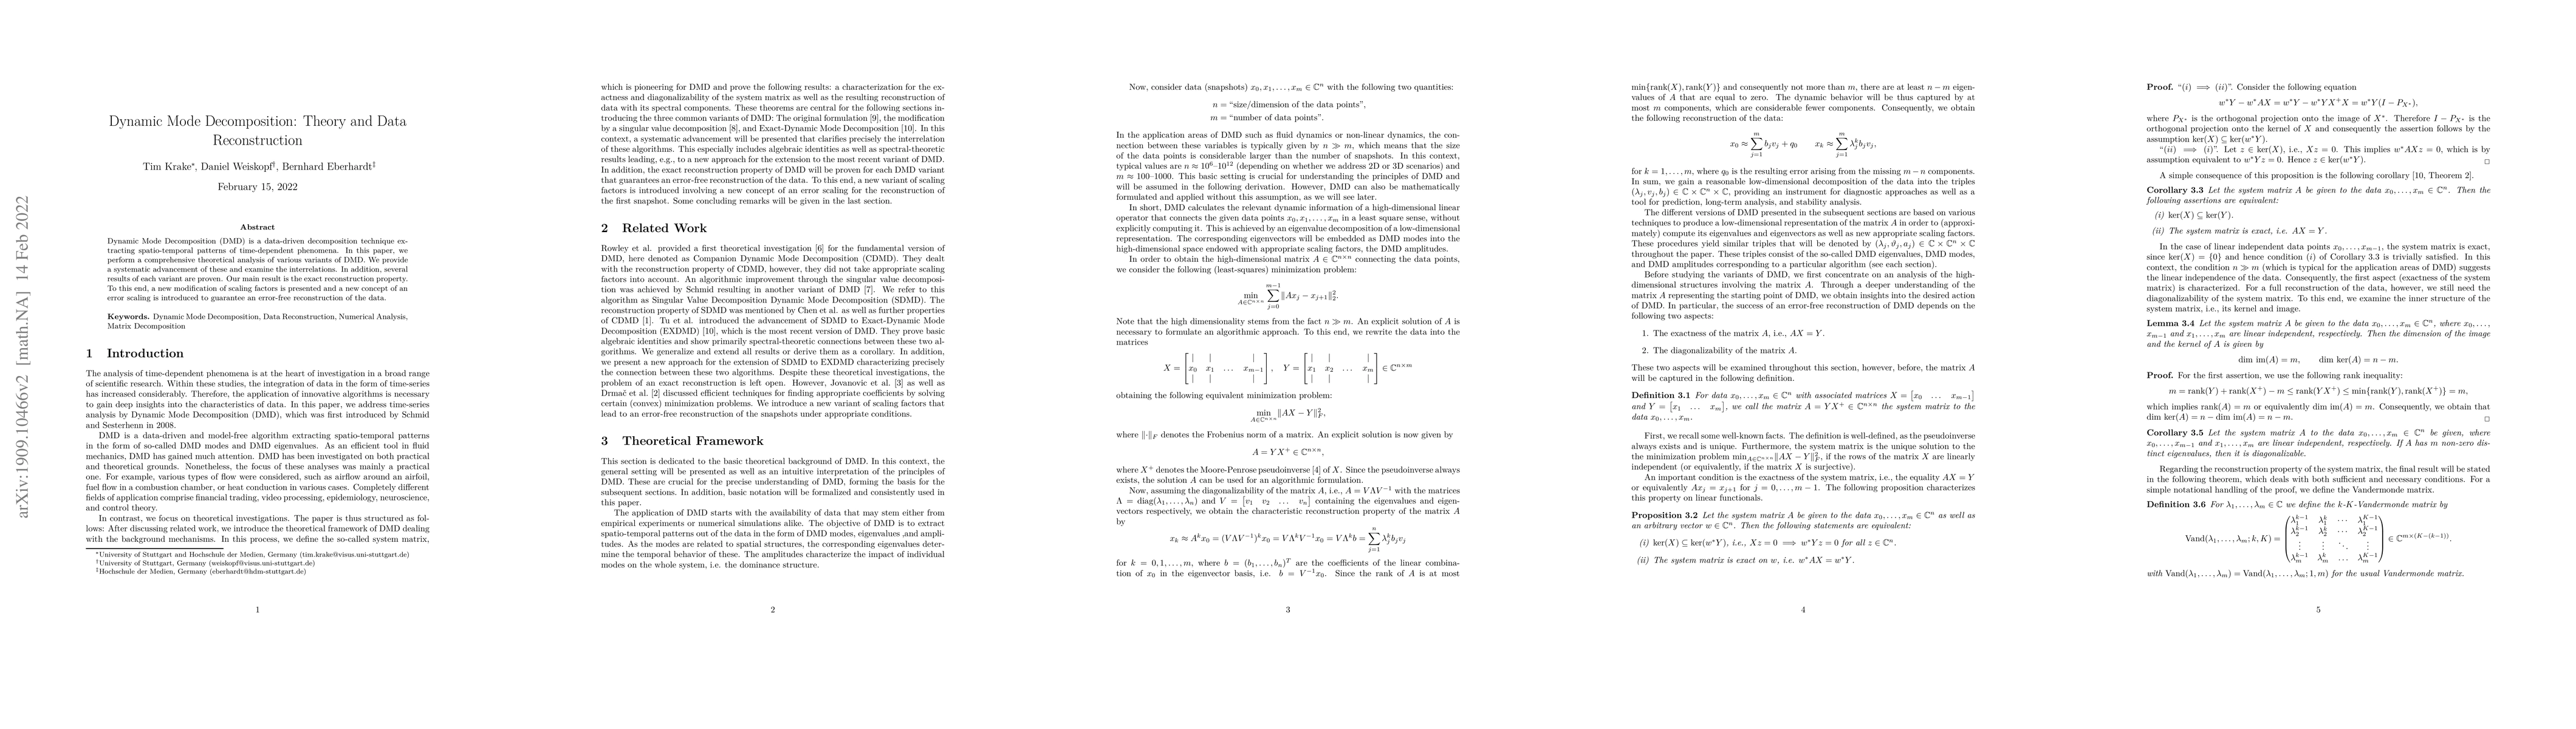
Dynamic Mode Decomposition (DMD) is a data-driven decomposition technique extracting spatio-temporal patterns of time-dependent phenomena. In this paper, we perform a comprehensive theoretical analy...
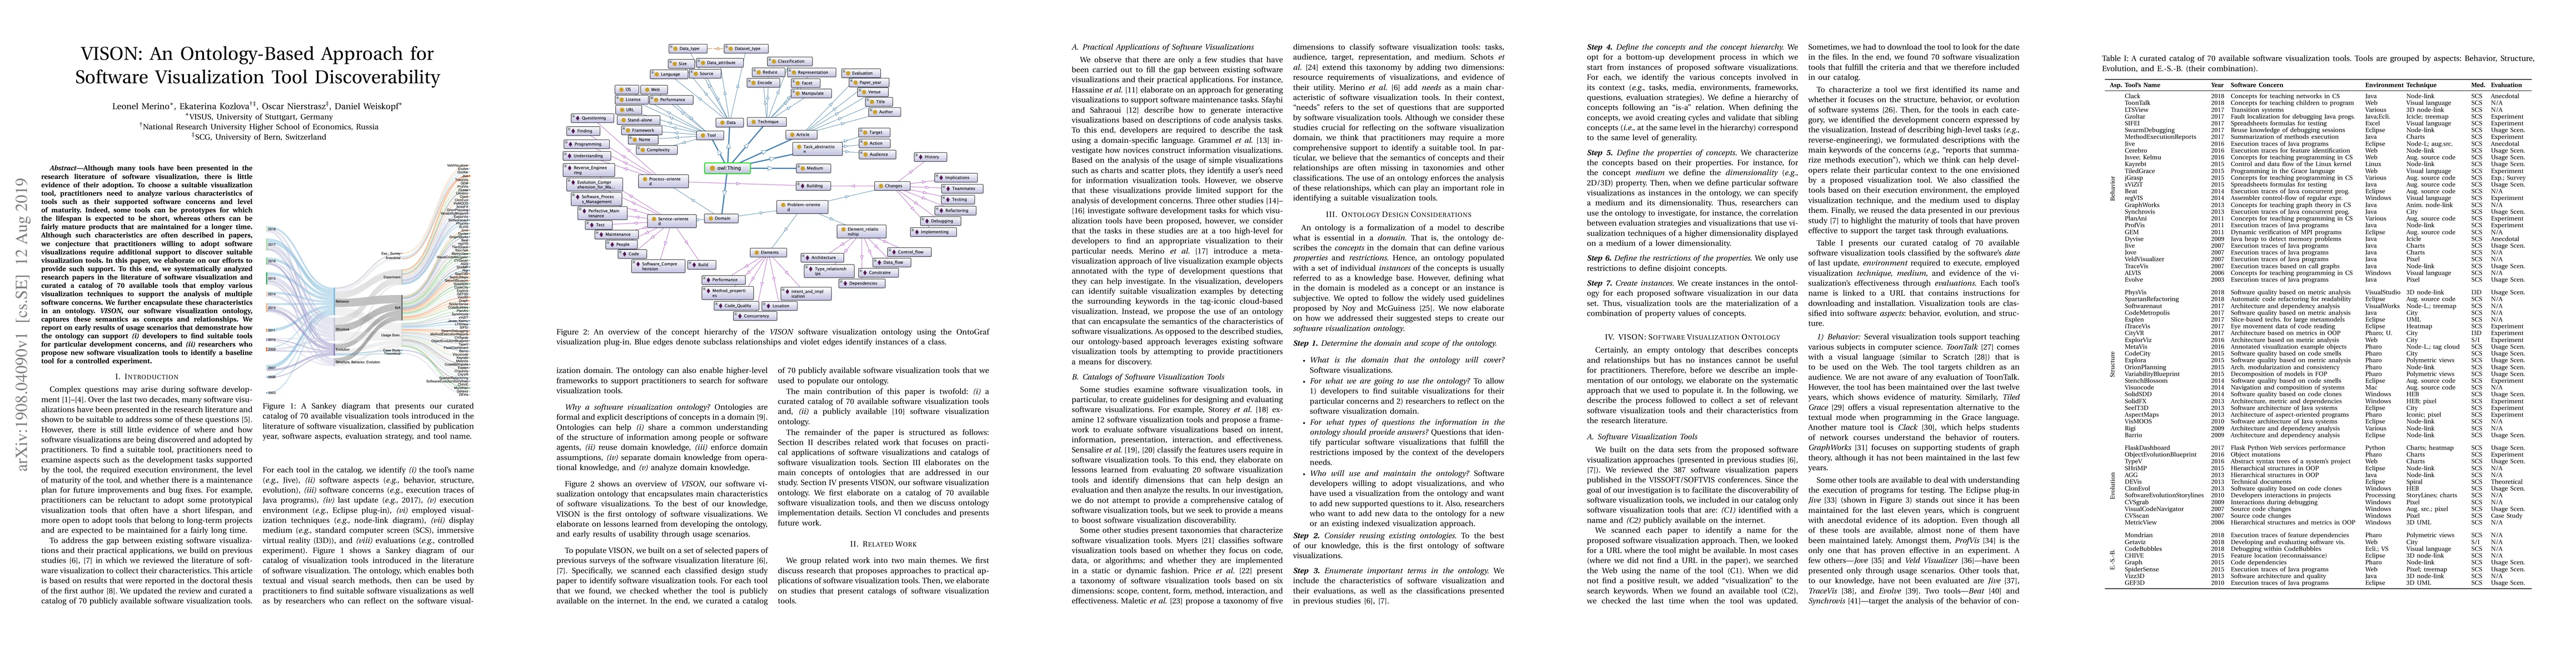
Although many tools have been presented in the research literature of software visualization, there is little evidence of their adoption. To choose a suitable visualization tool, practitioners need ...
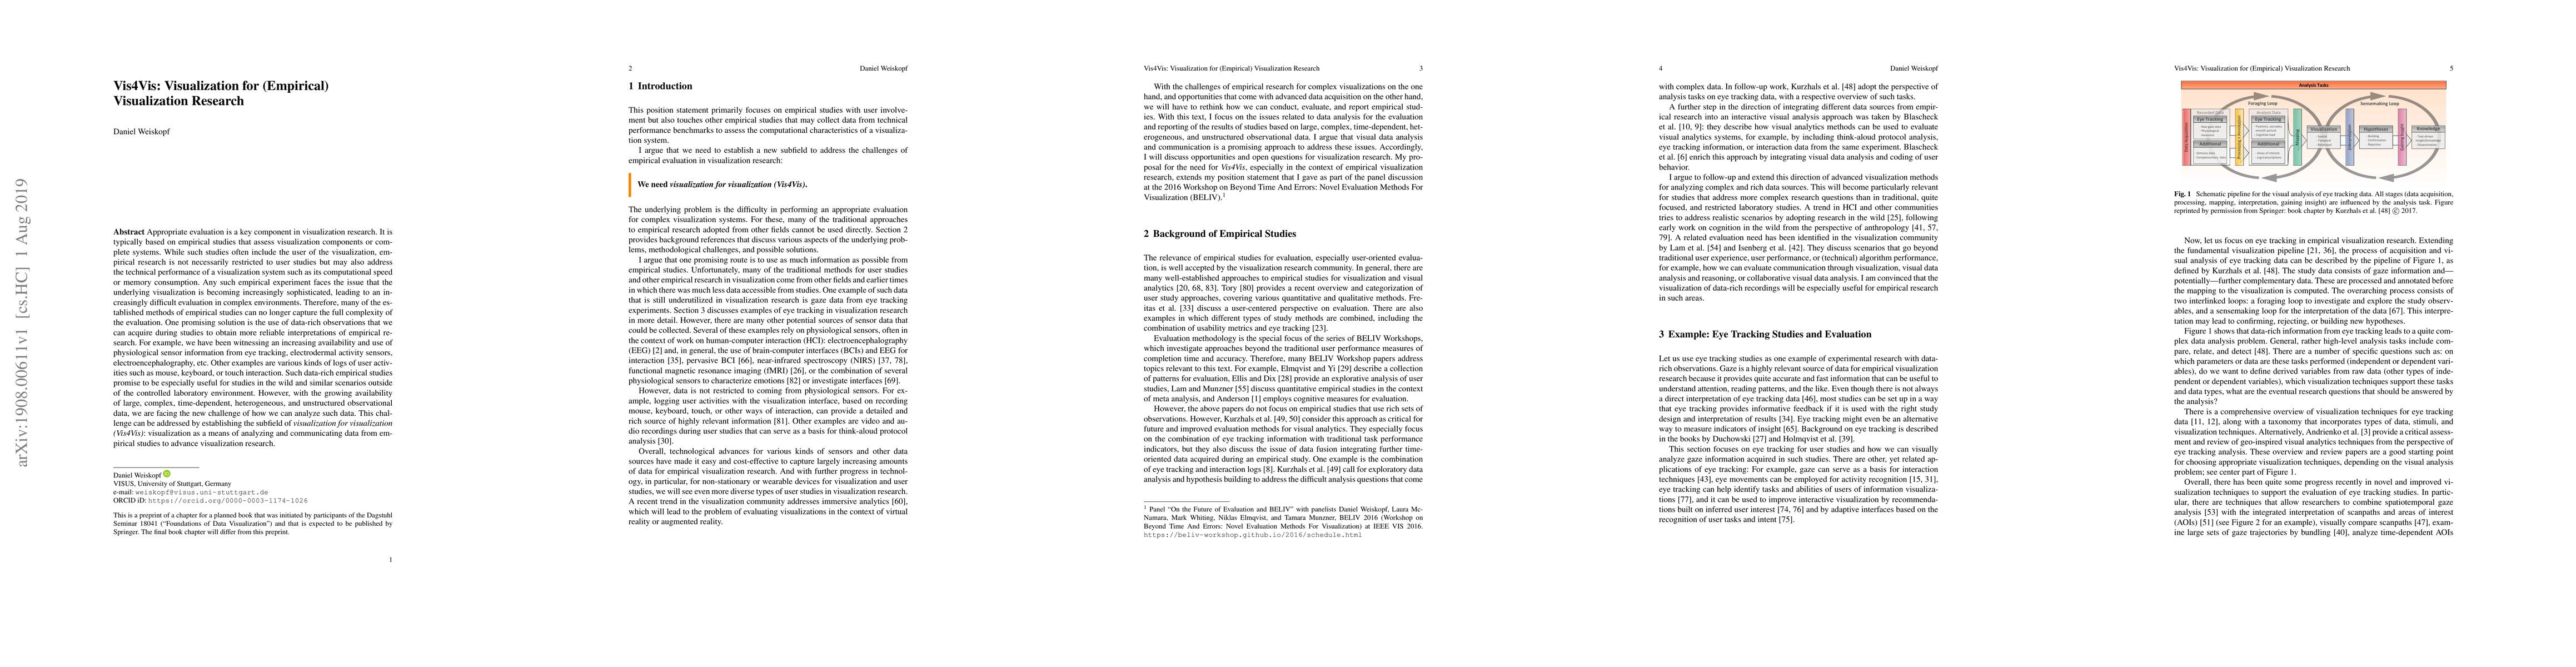
Appropriate evaluation is a key component in visualization research. It is typically based on empirical studies that assess visualization components or complete systems. While such studies often inc...
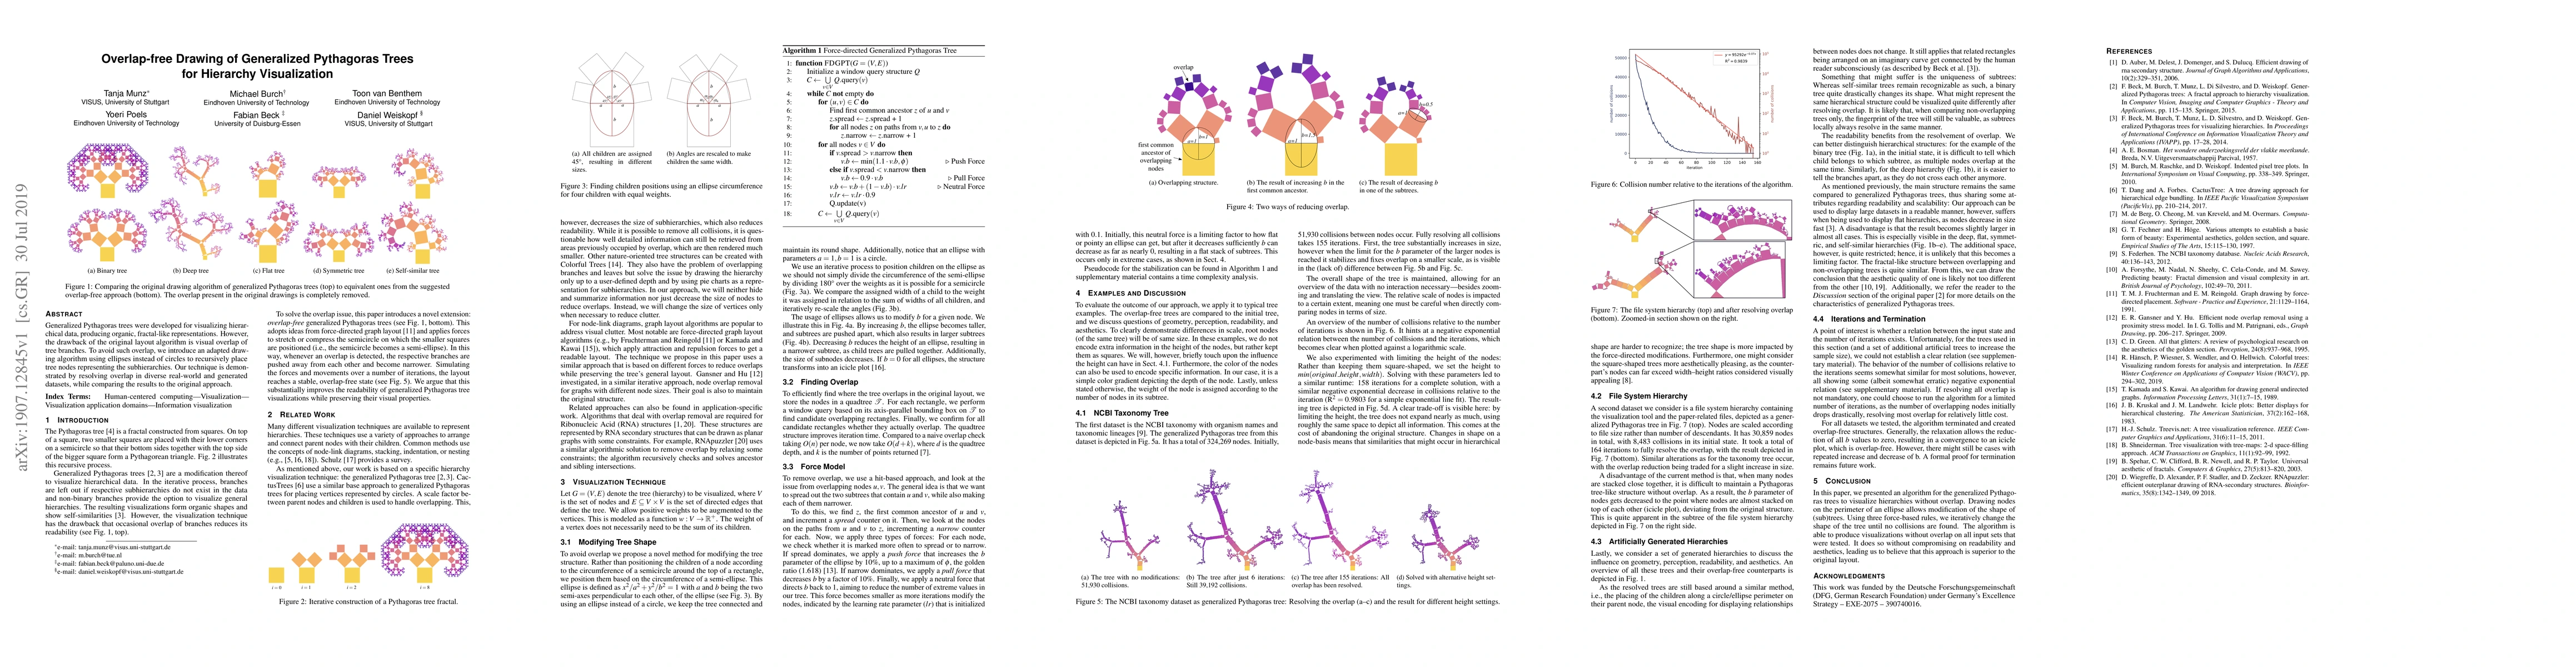
Generalized Pythagoras trees were developed for visualizing hierarchical data, producing organic, fractal-like representations. However, the drawback of the original layout algorithm is visual overl...
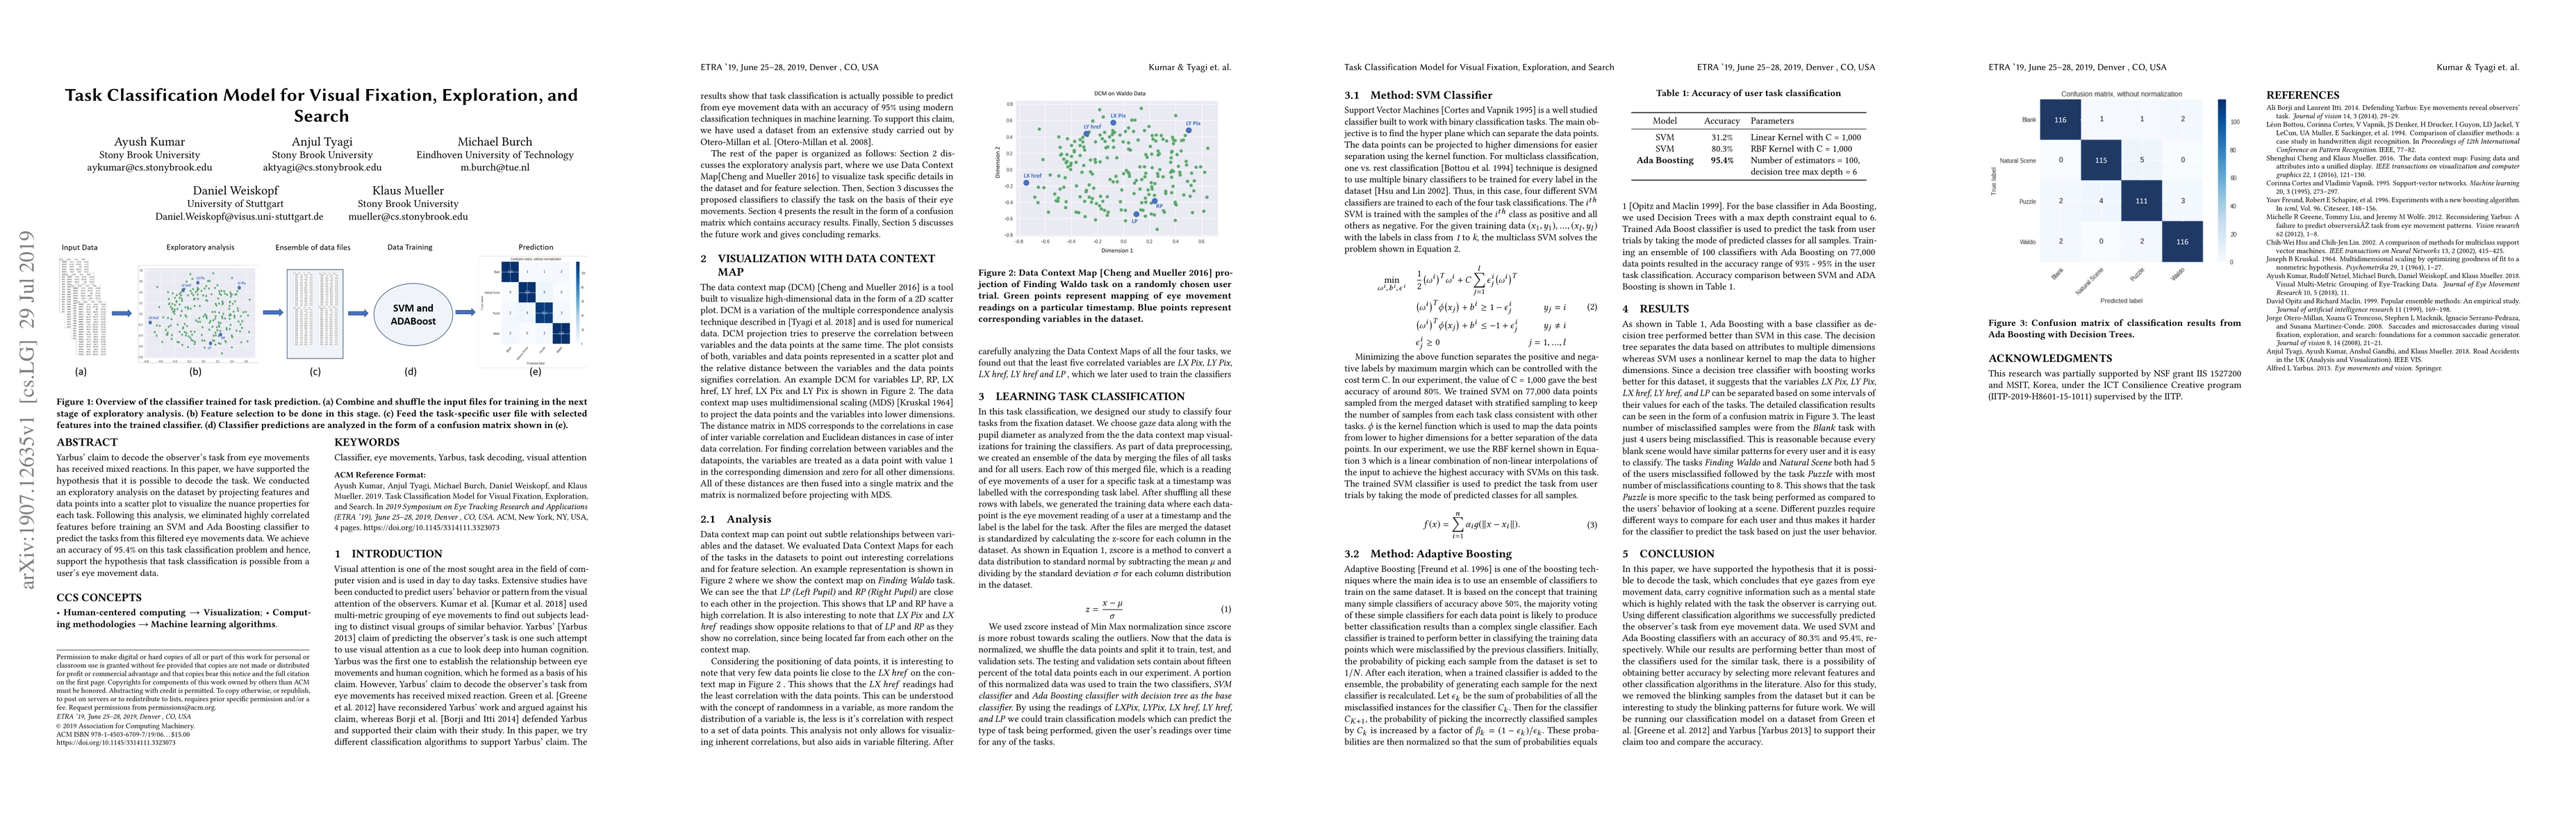
Yarbus' claim to decode the observer's task from eye movements has received mixed reactions. In this paper, we have supported the hypothesis that it is possible to decode the task. We conducted an e...
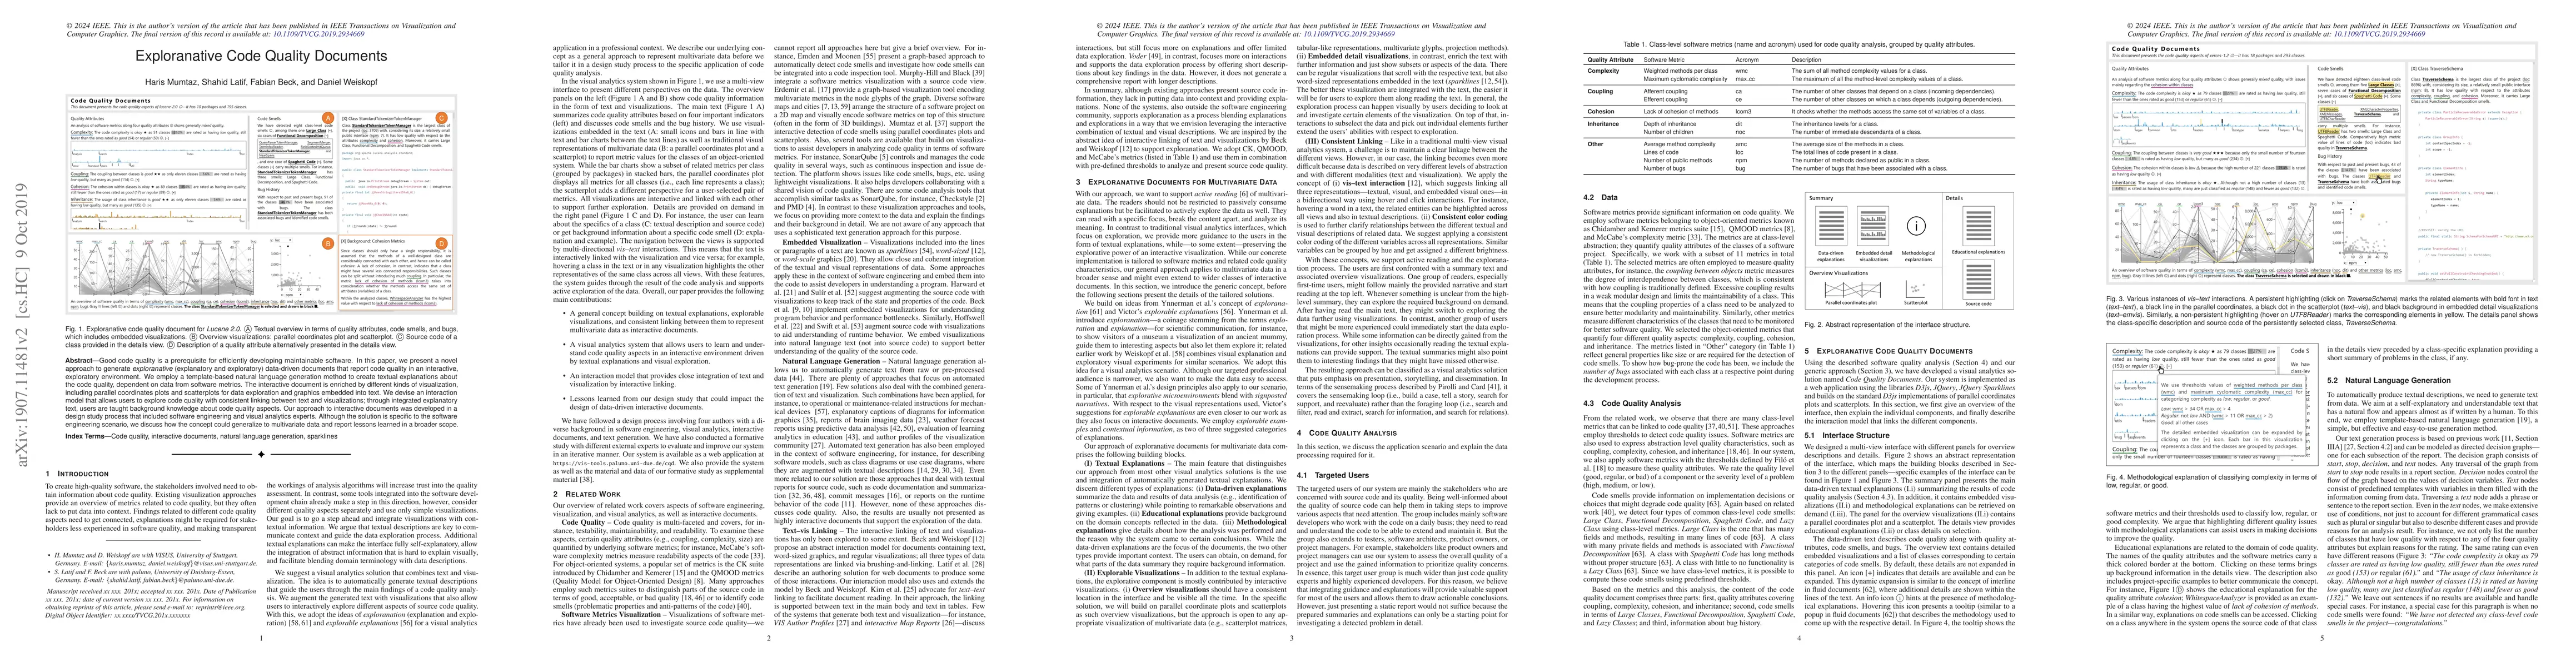
Good code quality is a prerequisite for efficiently developing maintainable software. In this paper, we present a novel approach to generate exploranative (explanatory and exploratory) data-driven d...
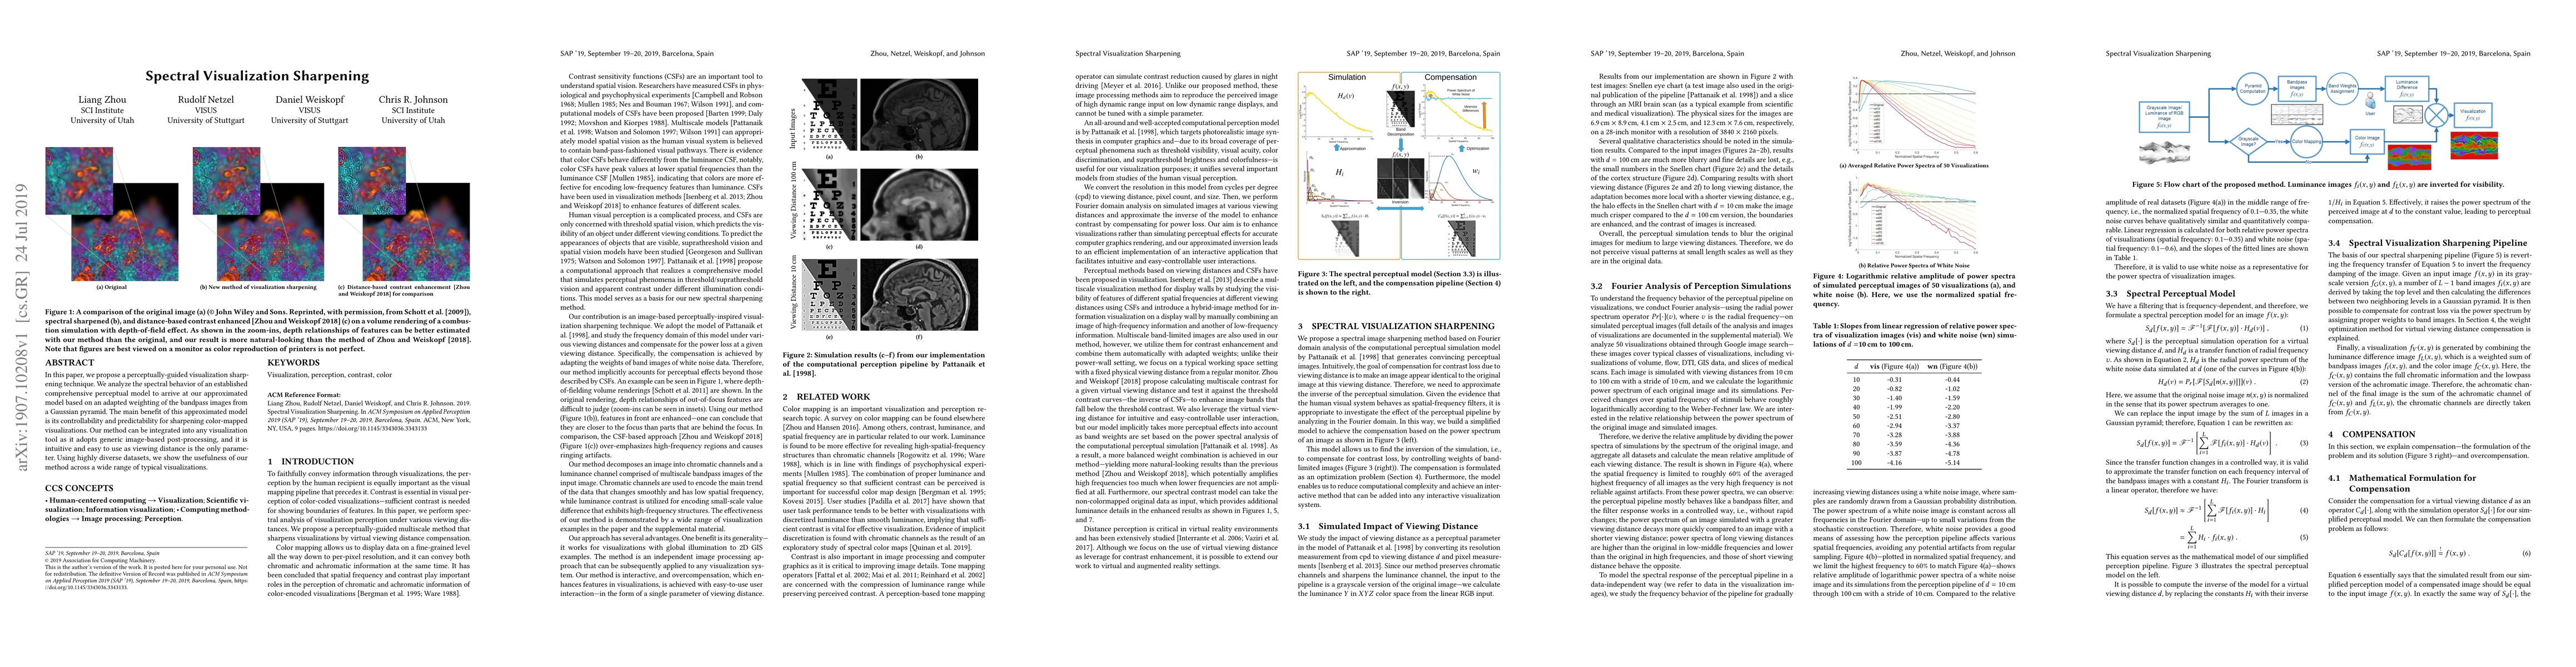
In this paper, we propose a perceptually-guided visualization sharpening technique. We analyze the spectral behavior of an established comprehensive perceptual model to arrive at our approximated mo...
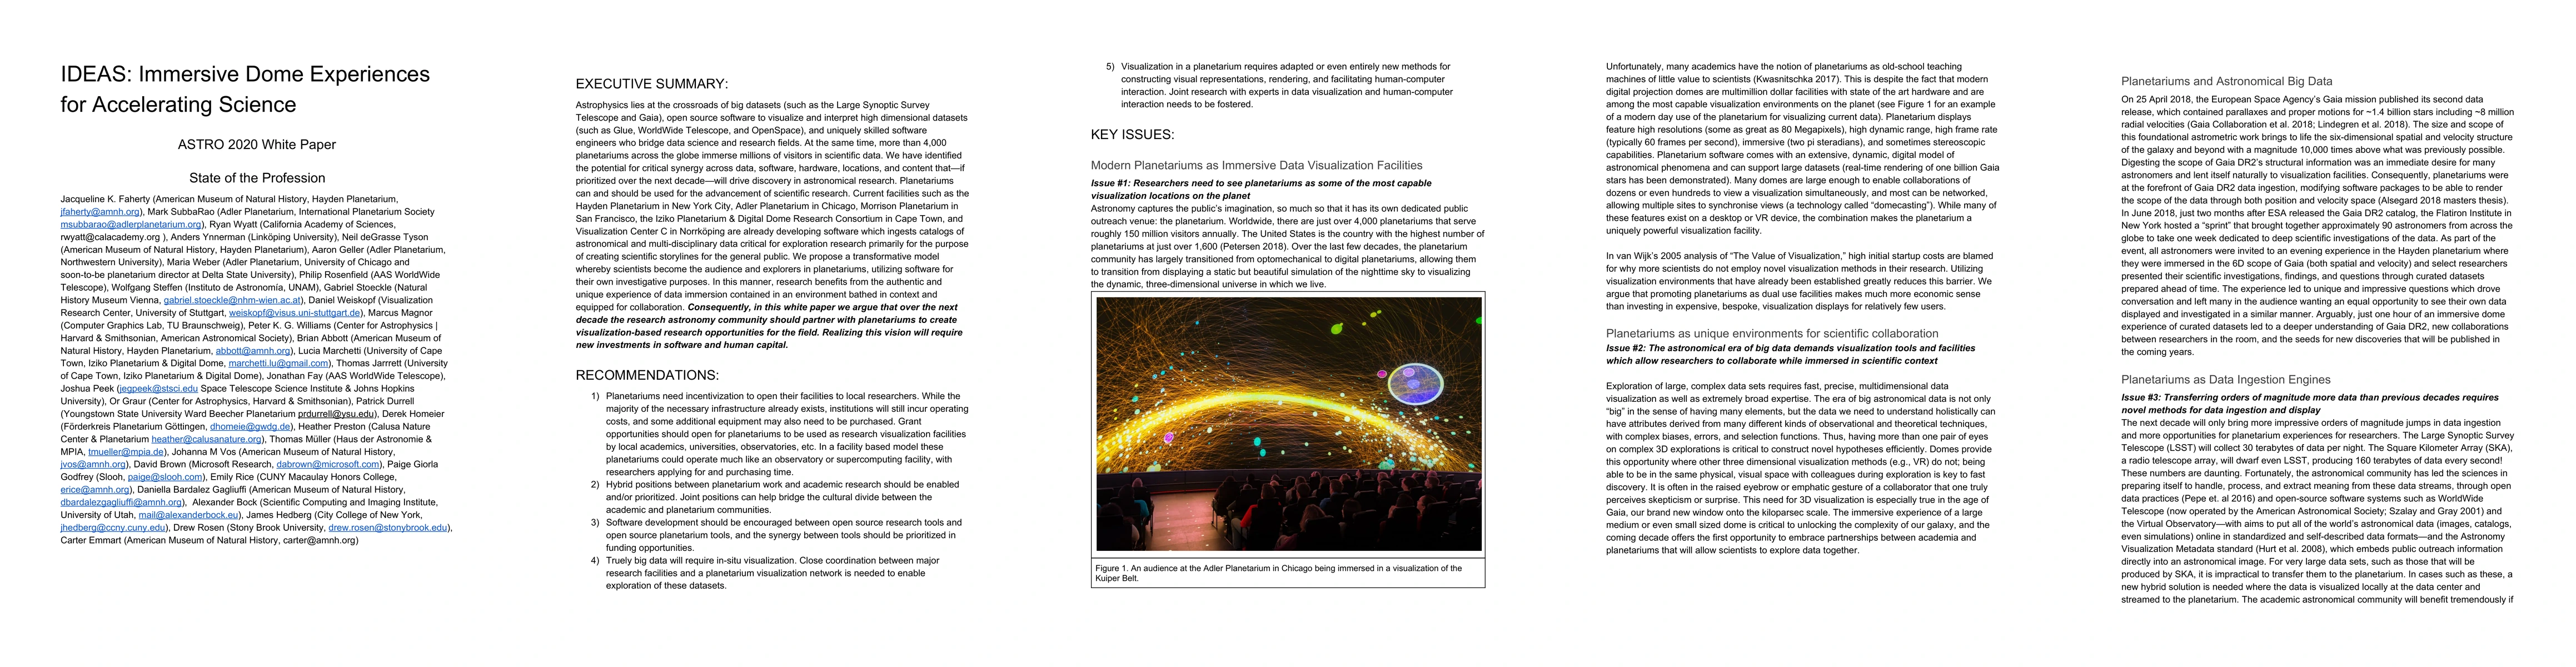
Astrophysics lies at the crossroads of big datasets (such as the Large Synoptic Survey Telescope and Gaia), open source software to visualize and interpret high dimensional datasets (such as Glue, W...
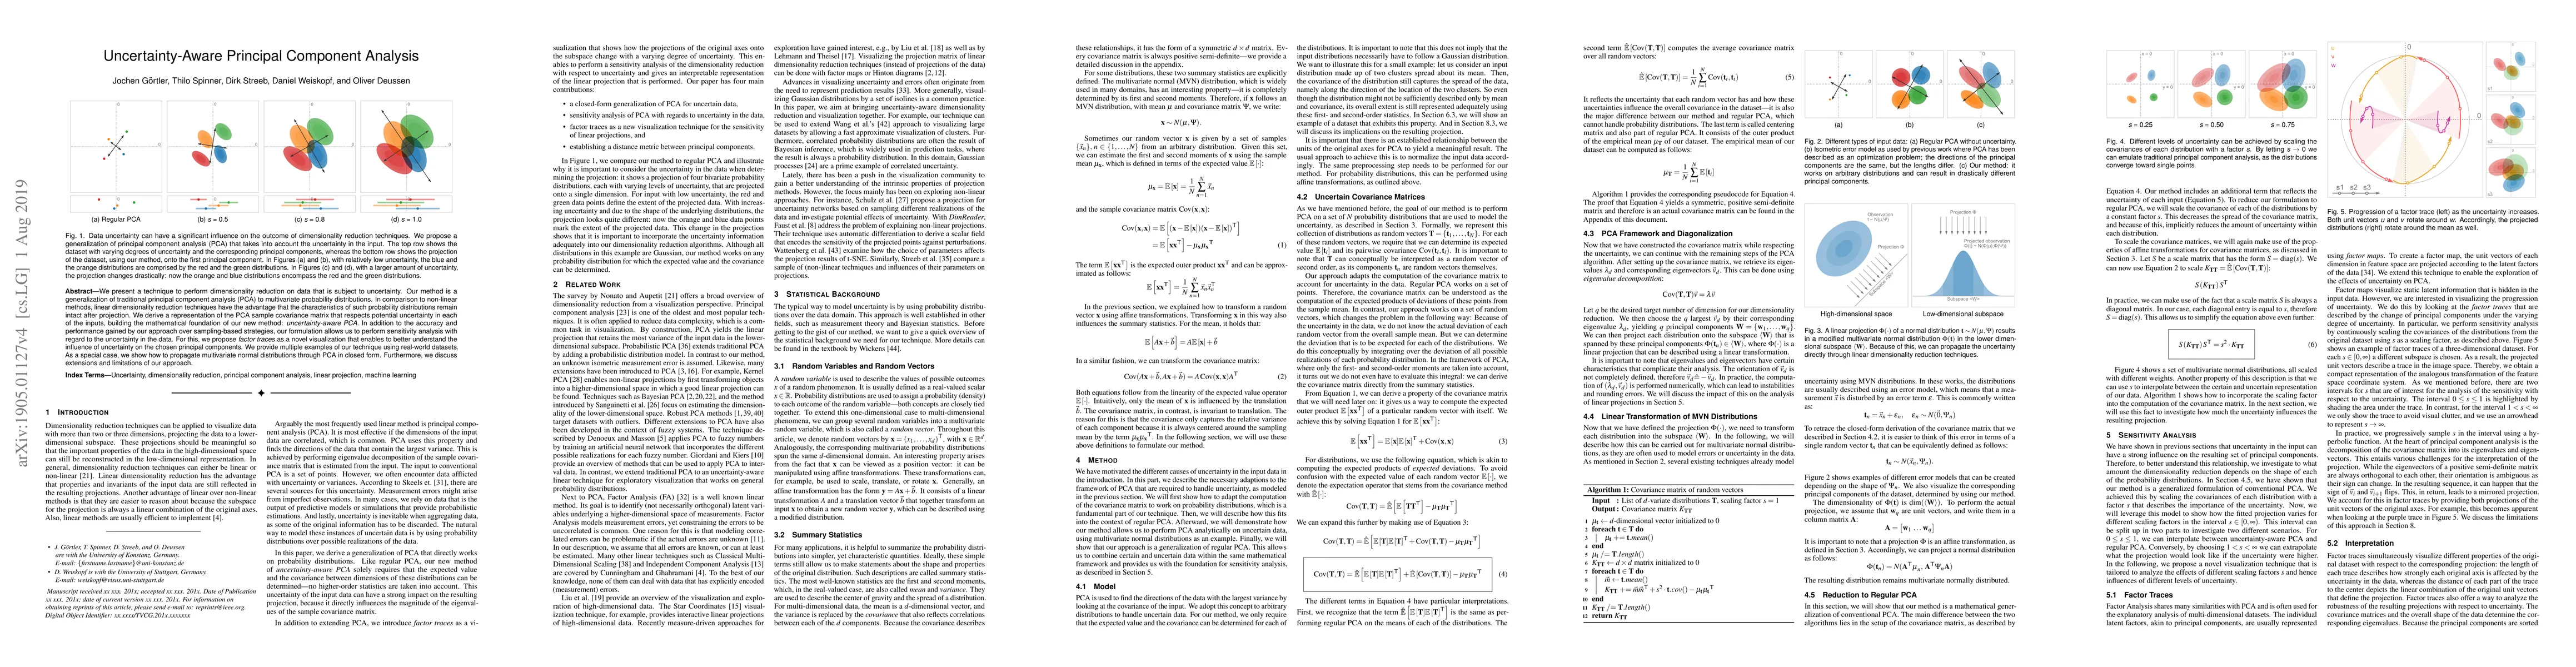
We present a technique to perform dimensionality reduction on data that is subject to uncertainty. Our method is a generalization of traditional principal component analysis (PCA) to multivariate pr...
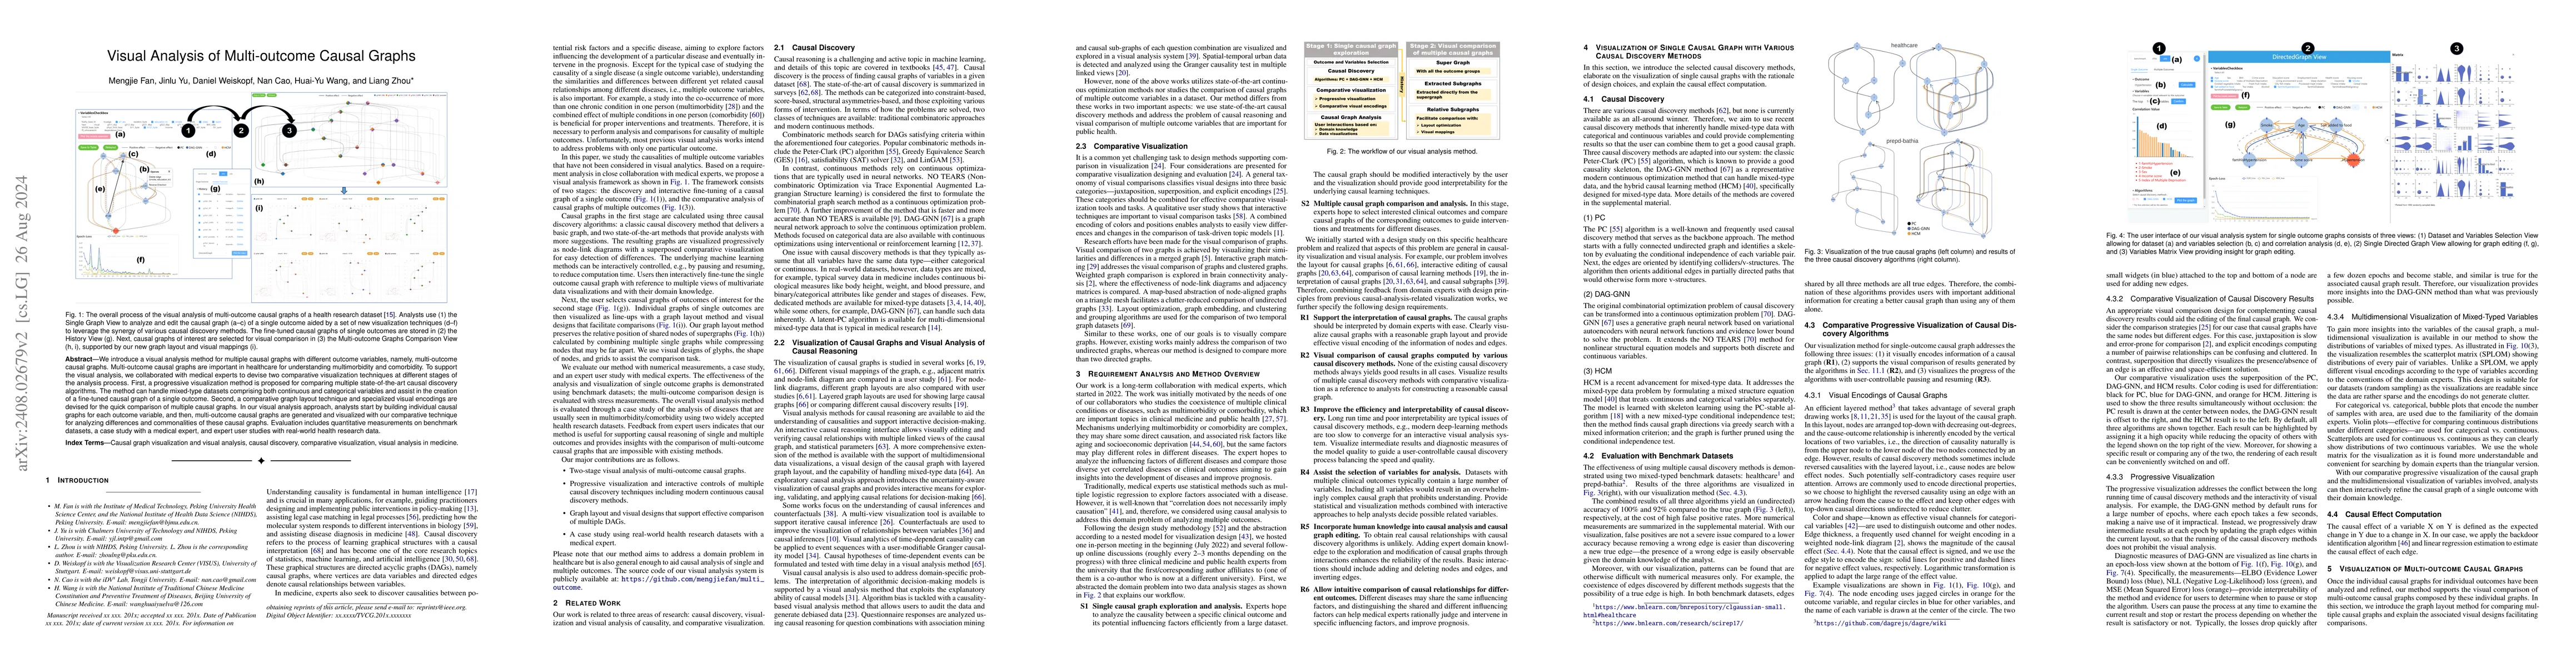
We introduce a visual analysis method for multiple causal graphs with different outcome variables, namely, multi-outcome causal graphs. Multi-outcome causal graphs are important in healthcare for unde...
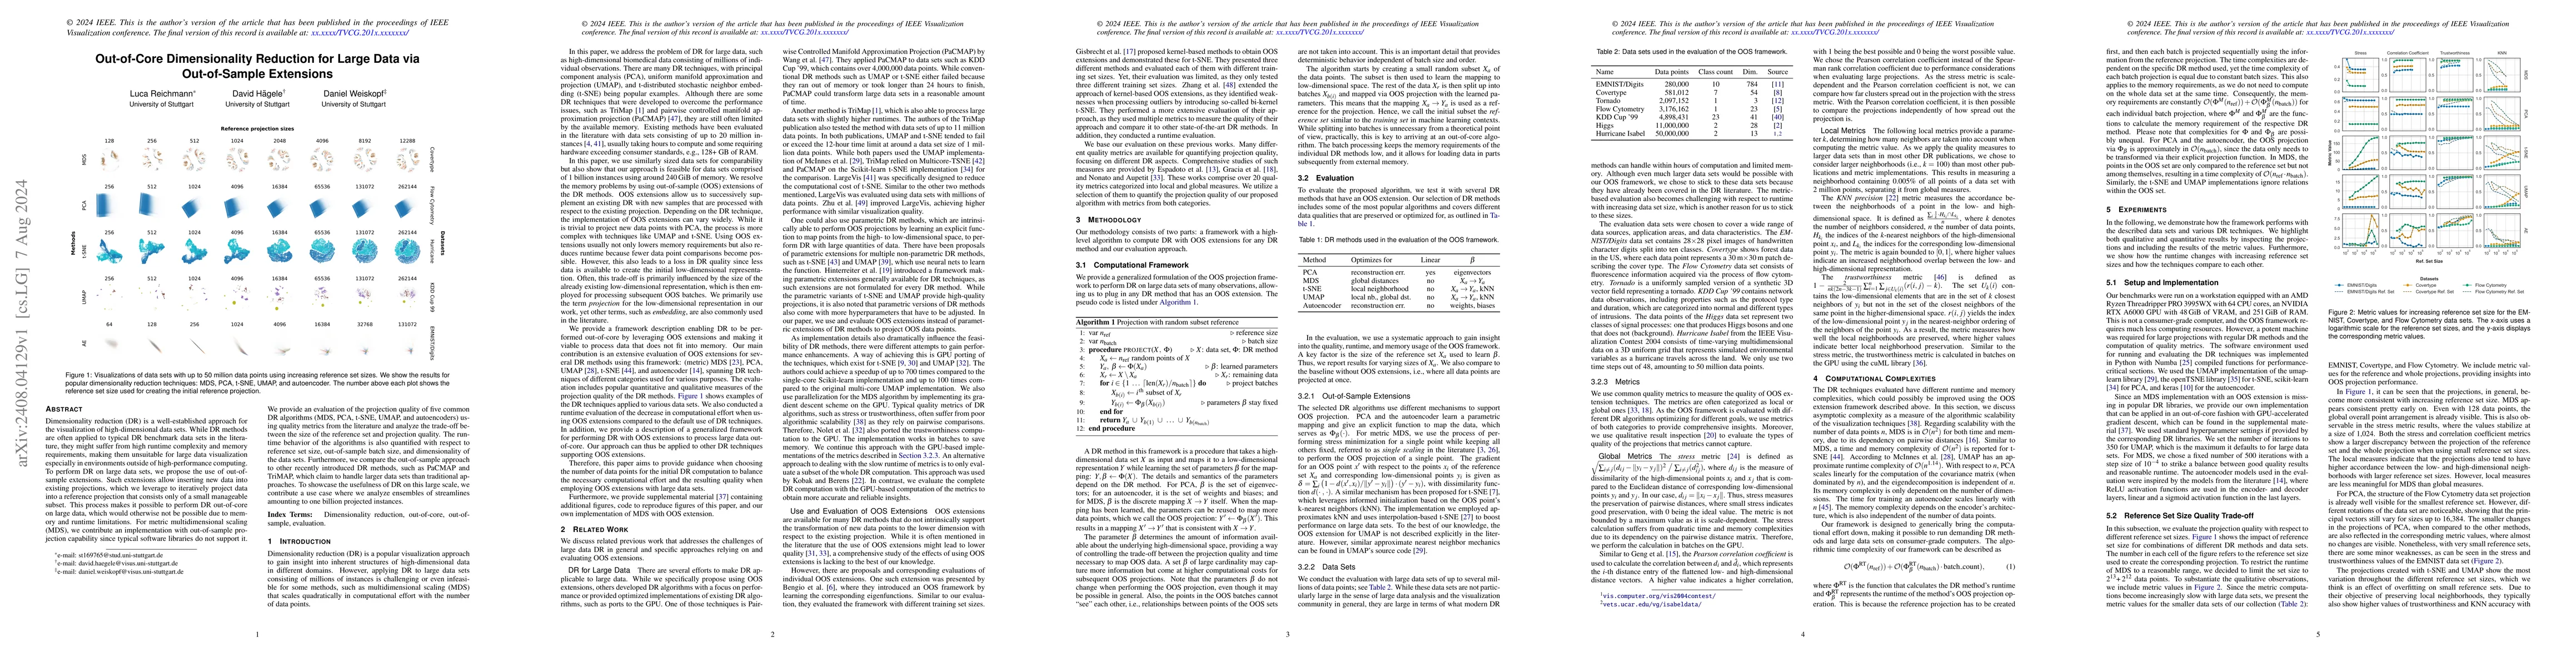
Dimensionality reduction (DR) is a well-established approach for the visualization of high-dimensional data sets. While DR methods are often applied to typical DR benchmark data sets in the literature...
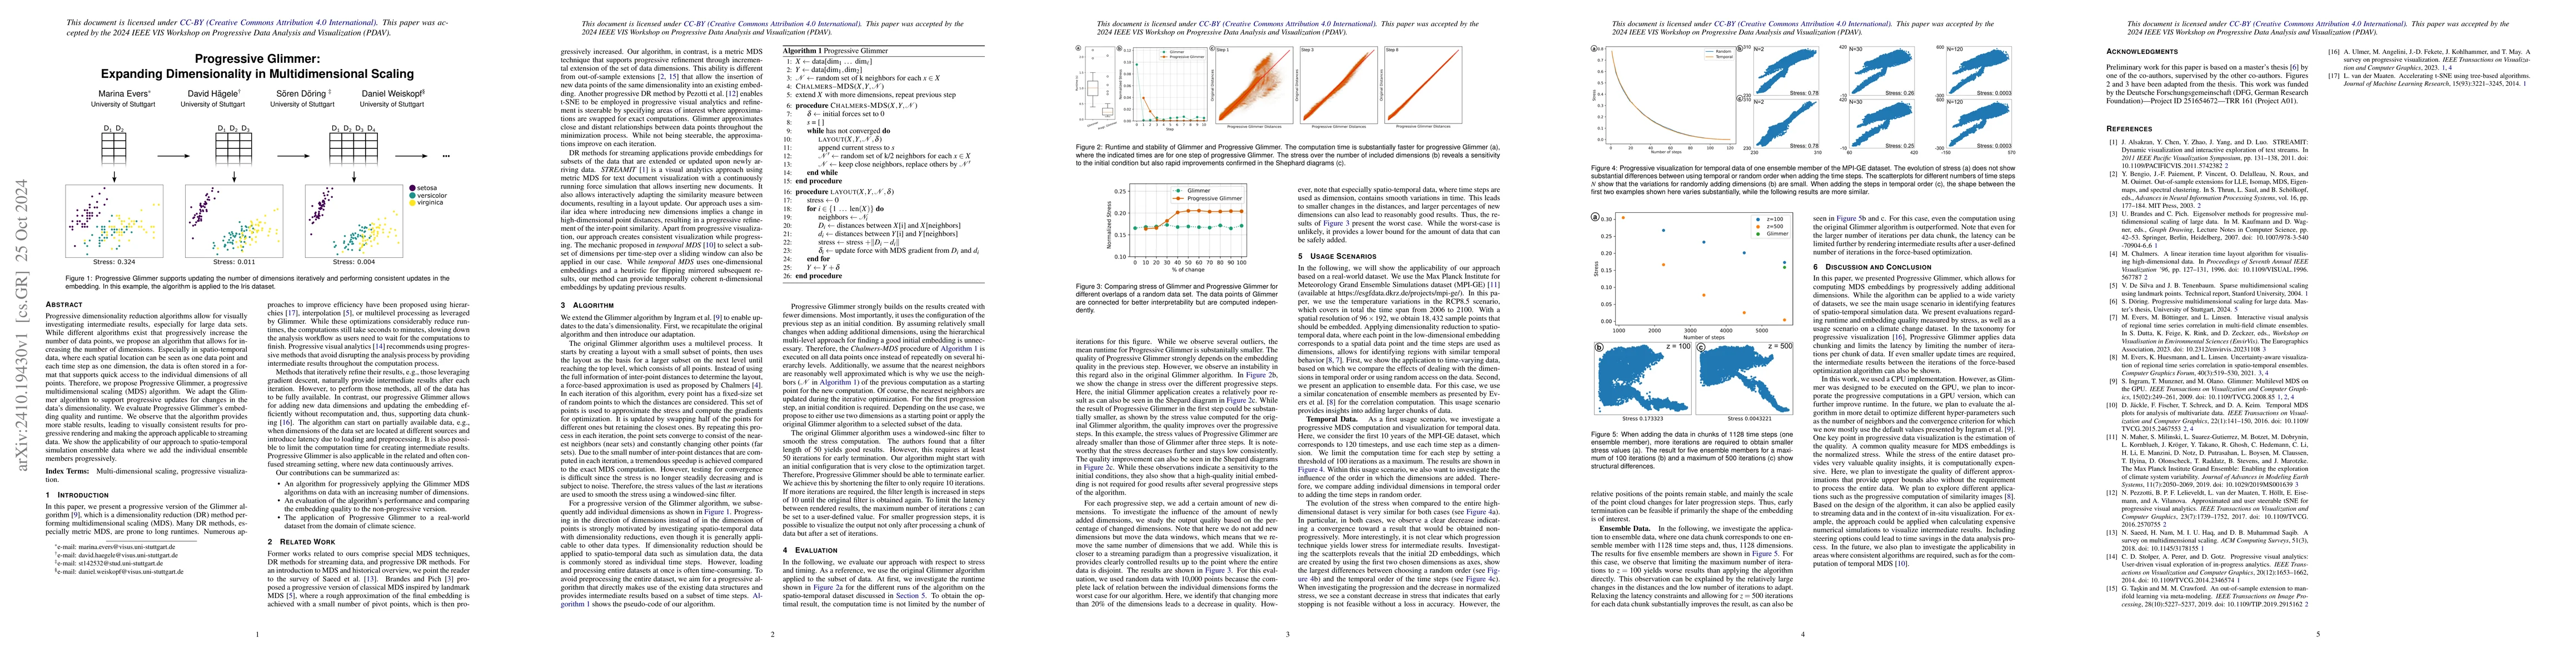
Progressive dimensionality reduction algorithms allow for visually investigating intermediate results, especially for large data sets. While different algorithms exist that progressively increase the ...
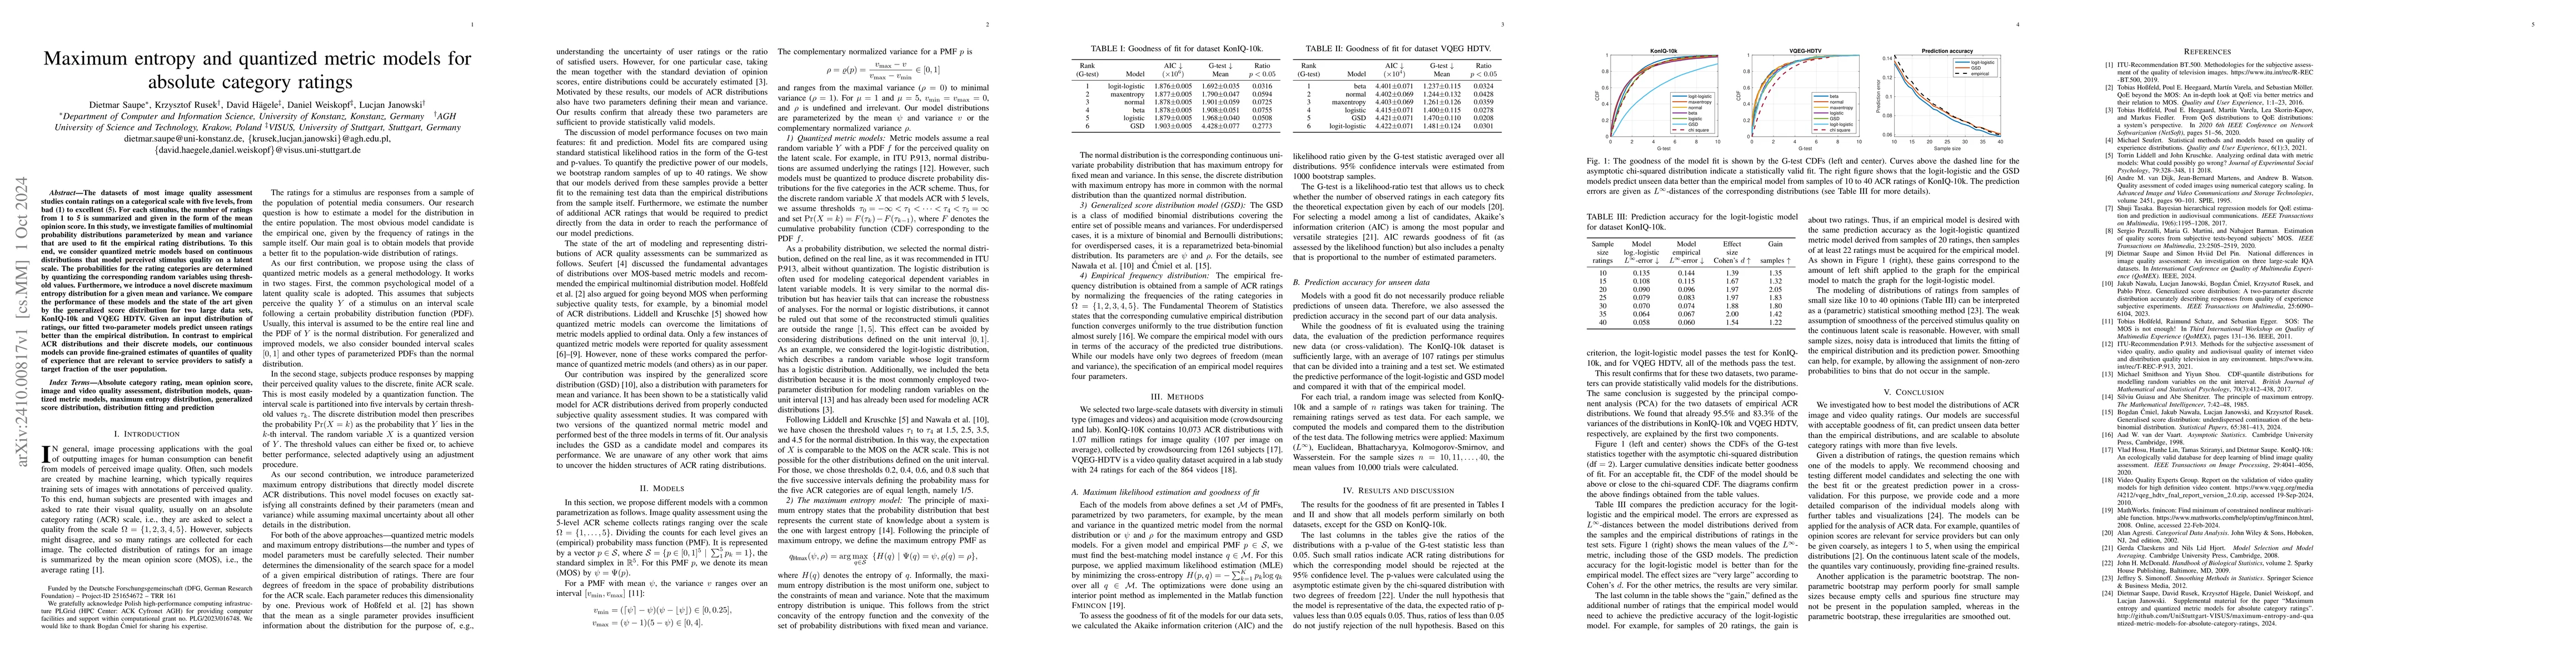
The datasets of most image quality assessment studies contain ratings on a categorical scale with five levels, from bad (1) to excellent (5). For each stimulus, the number of ratings from 1 to 5 is su...
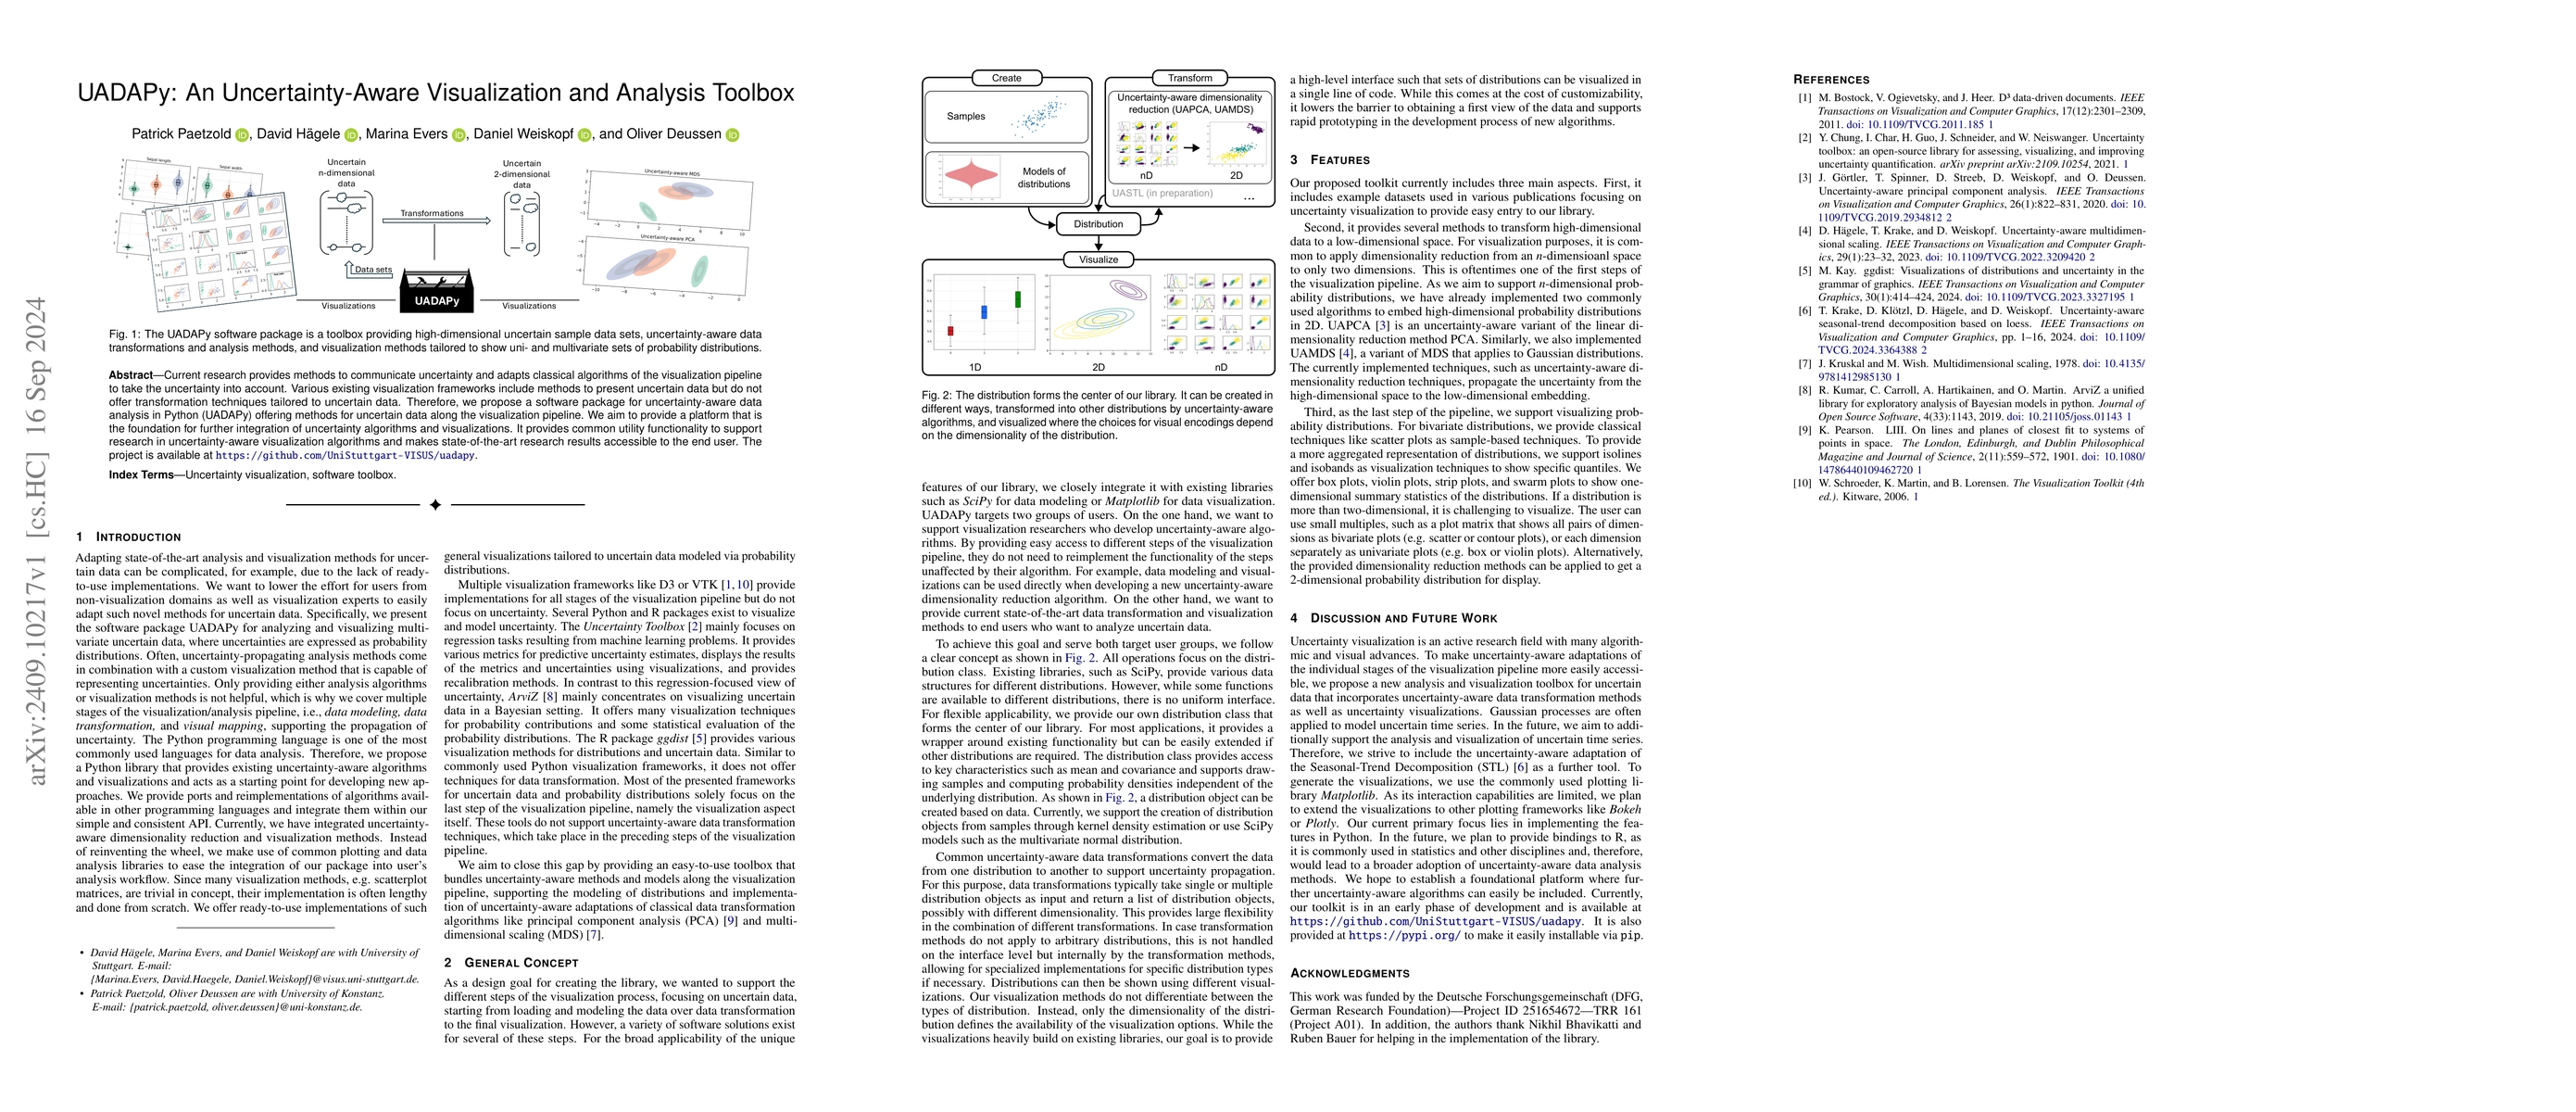
Current research provides methods to communicate uncertainty and adapts classical algorithms of the visualization pipeline to take the uncertainty into account. Various existing visualization framewor...
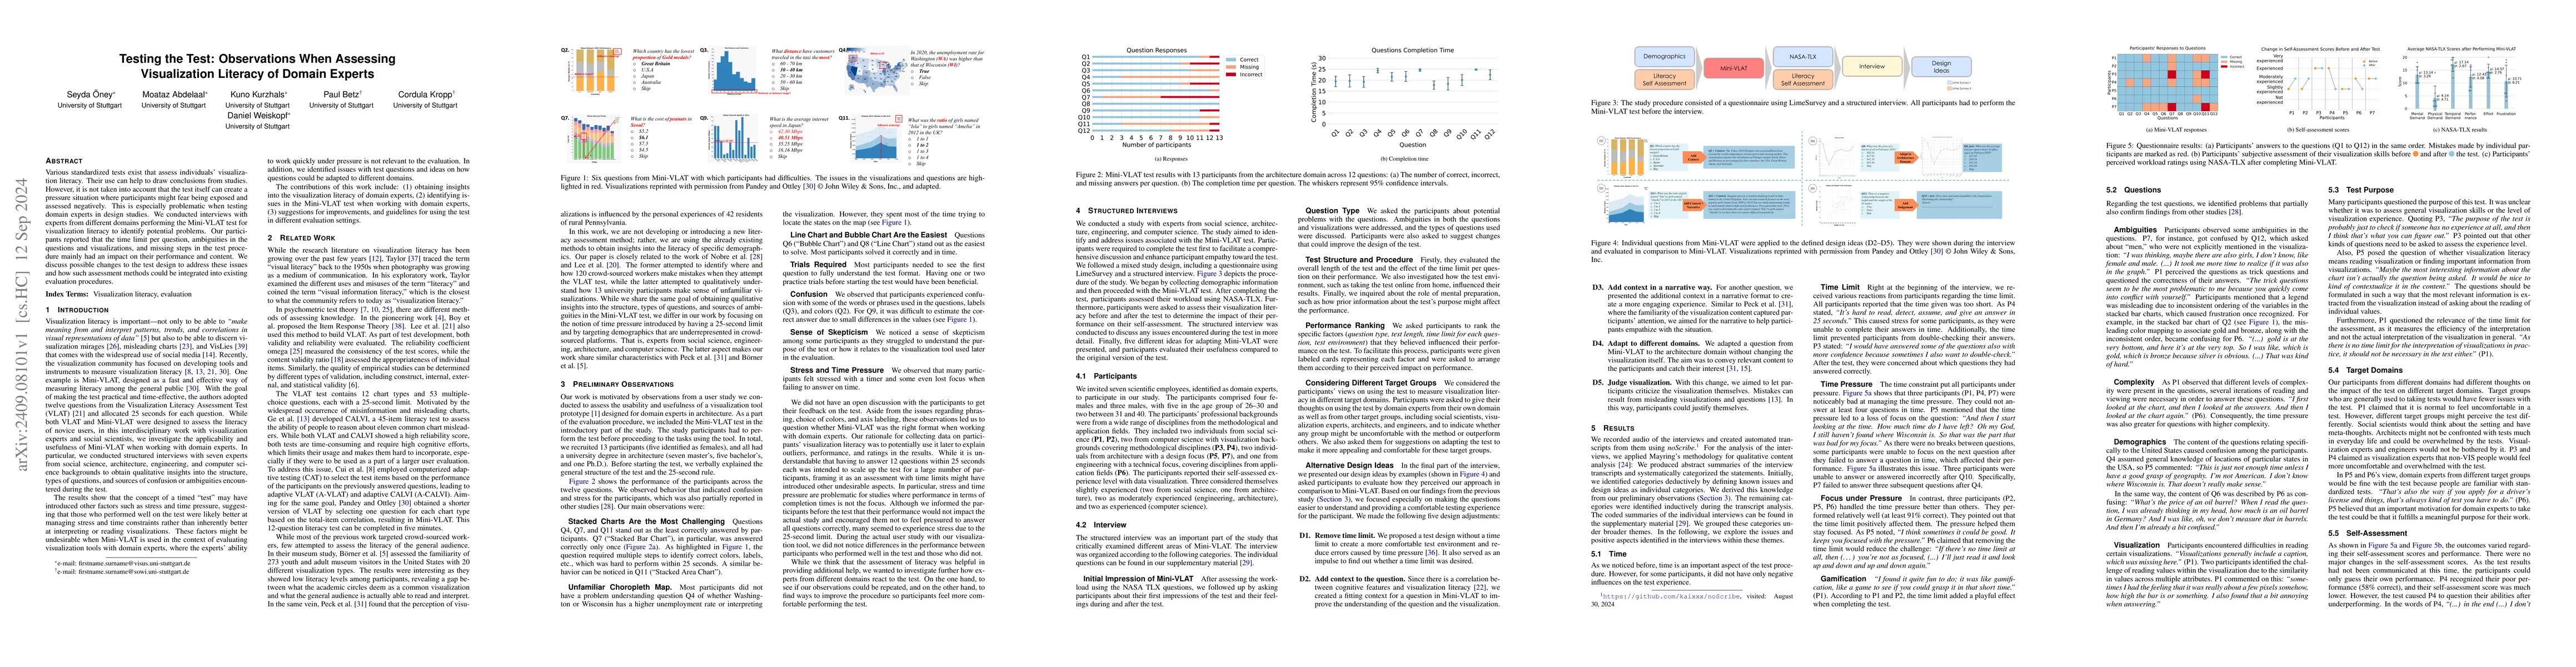
Various standardized tests exist that assess individuals' visualization literacy. Their use can help to draw conclusions from studies. However, it is not taken into account that the test itself can cr...
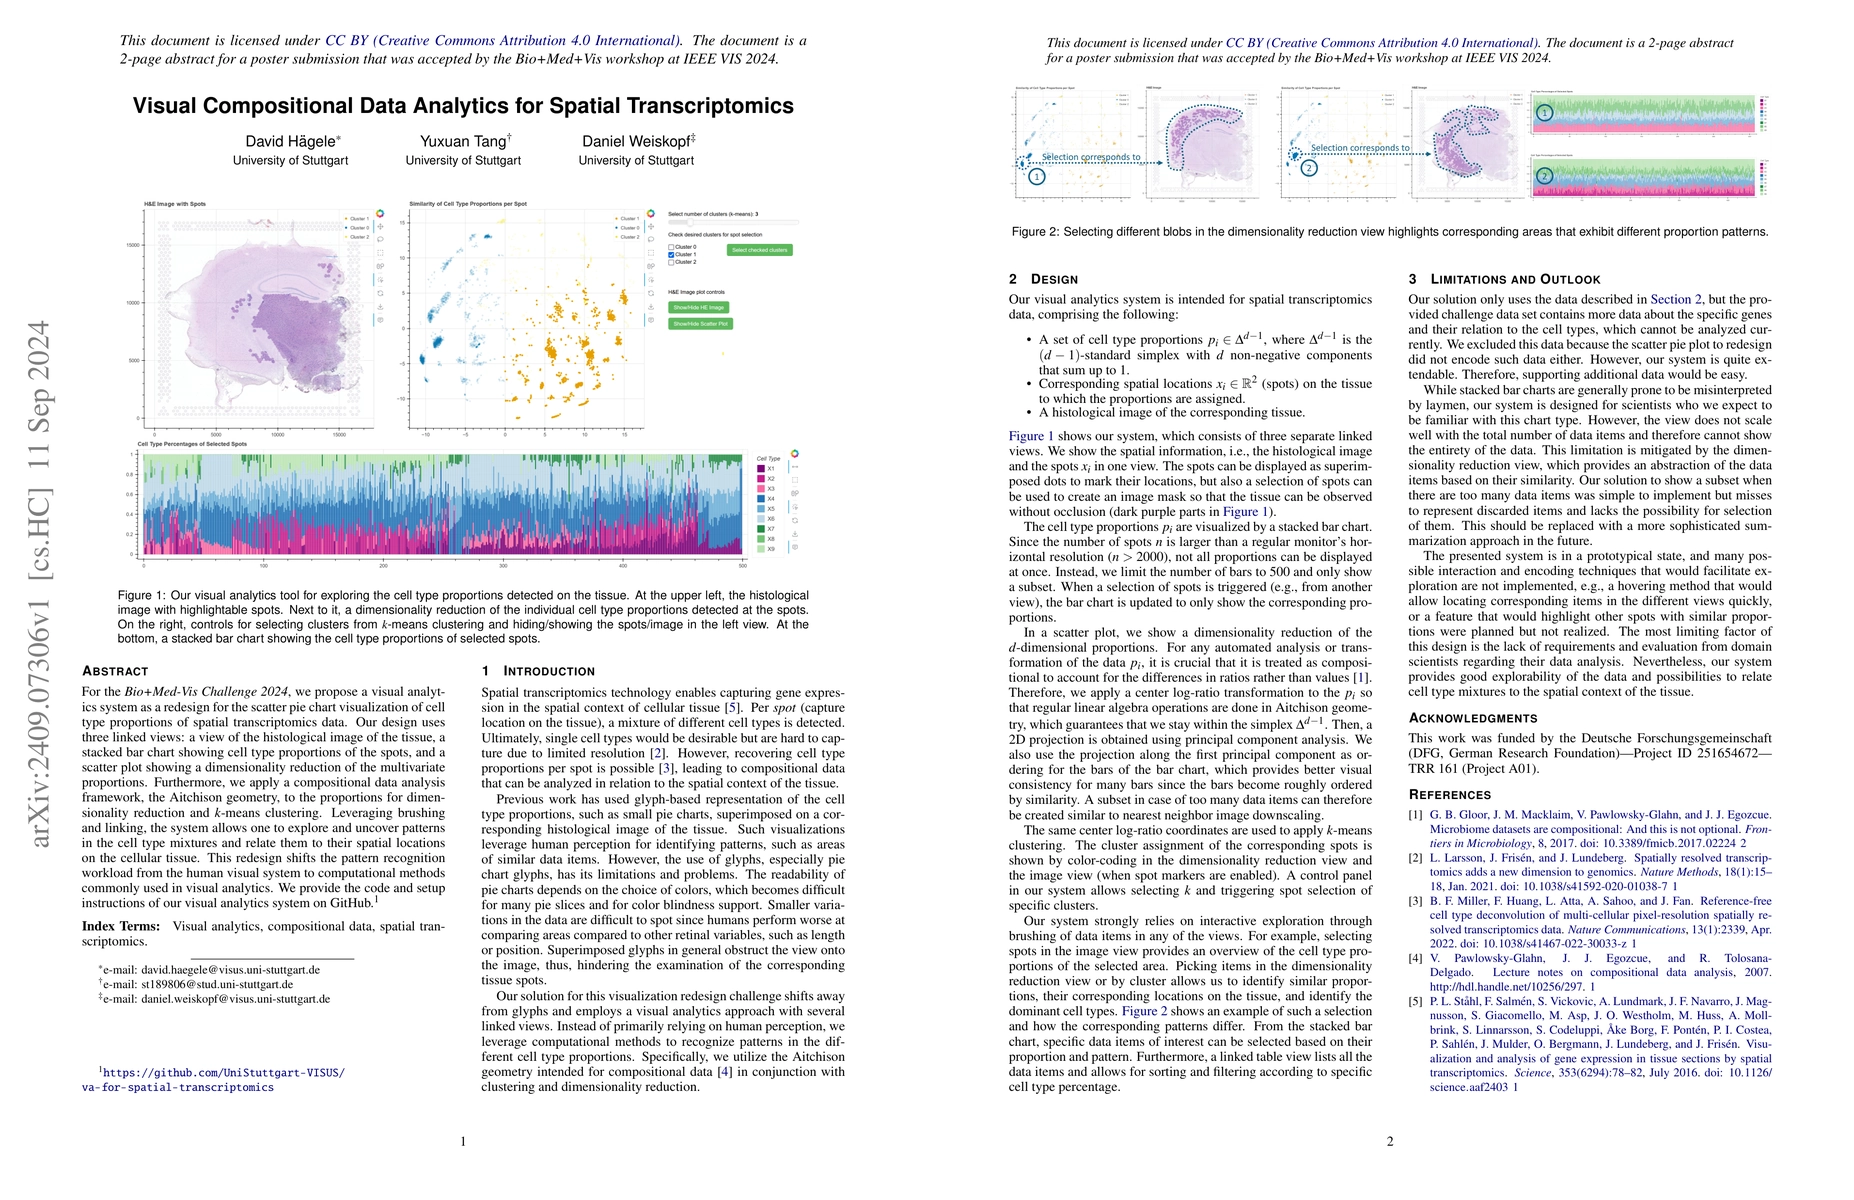
For the Bio+Med-Vis Challenge 2024, we propose a visual analytics system as a redesign for the scatter pie chart visualization of cell type proportions of spatial transcriptomics data. Our design uses...
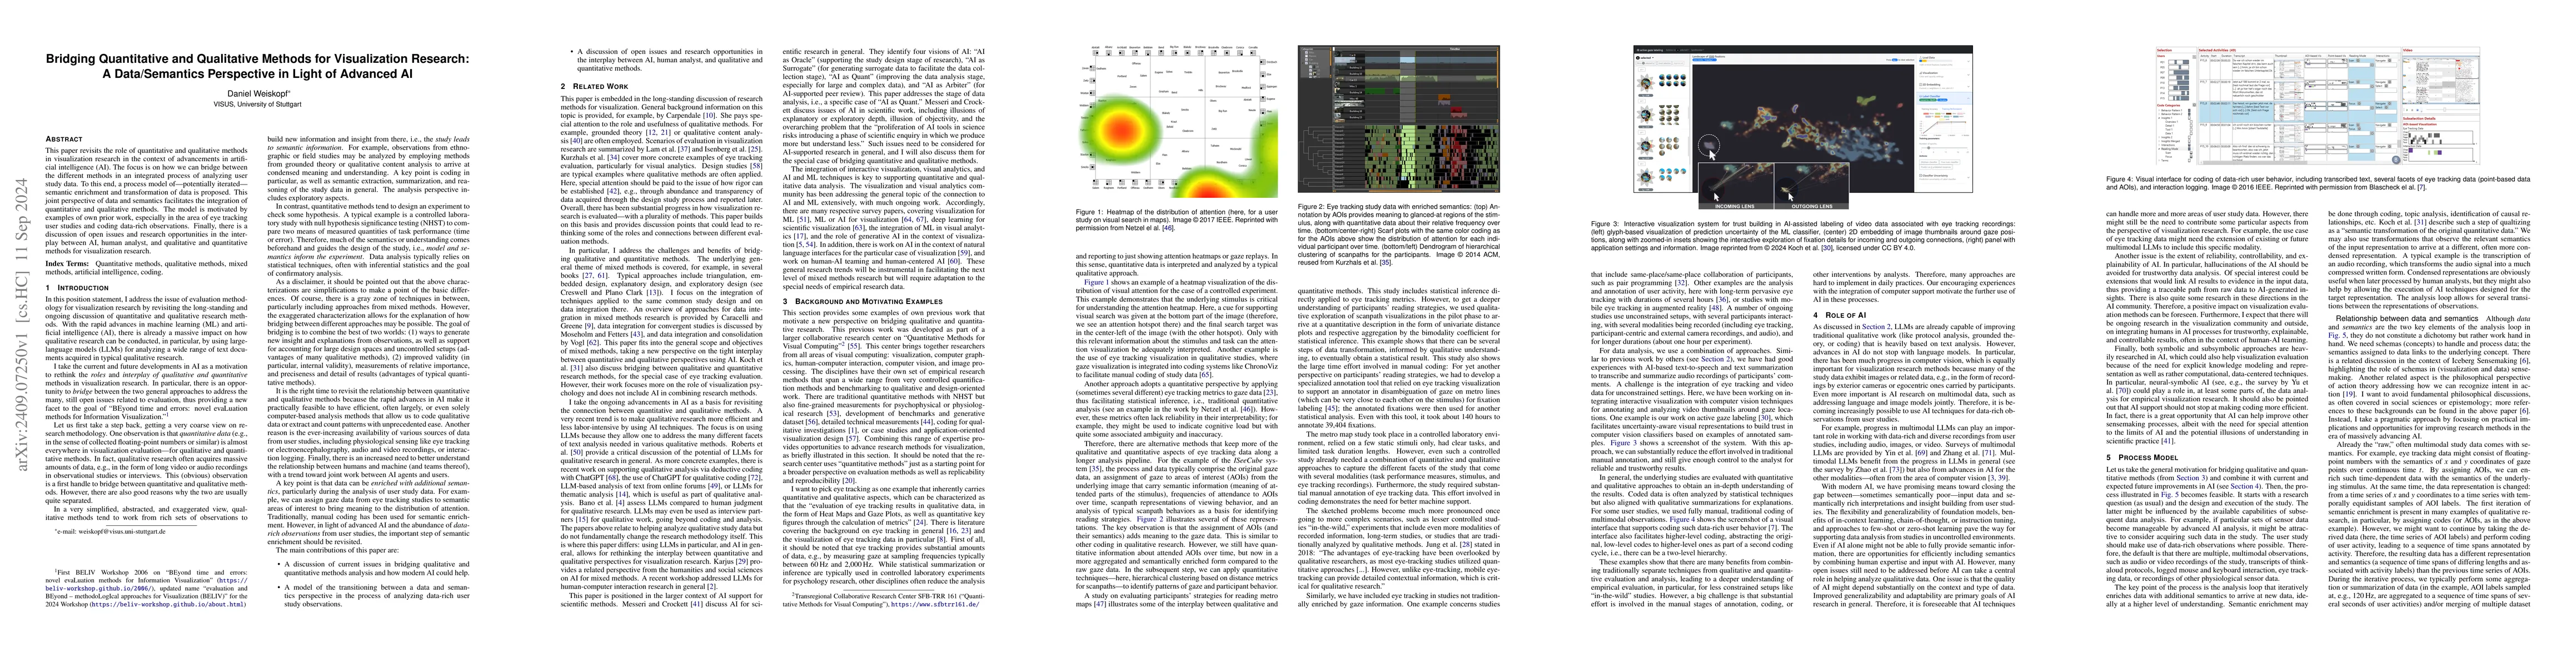
This paper revisits the role of quantitative and qualitative methods in visualization research in the context of advancements in artificial intelligence (AI). The focus is on how we can bridge between...
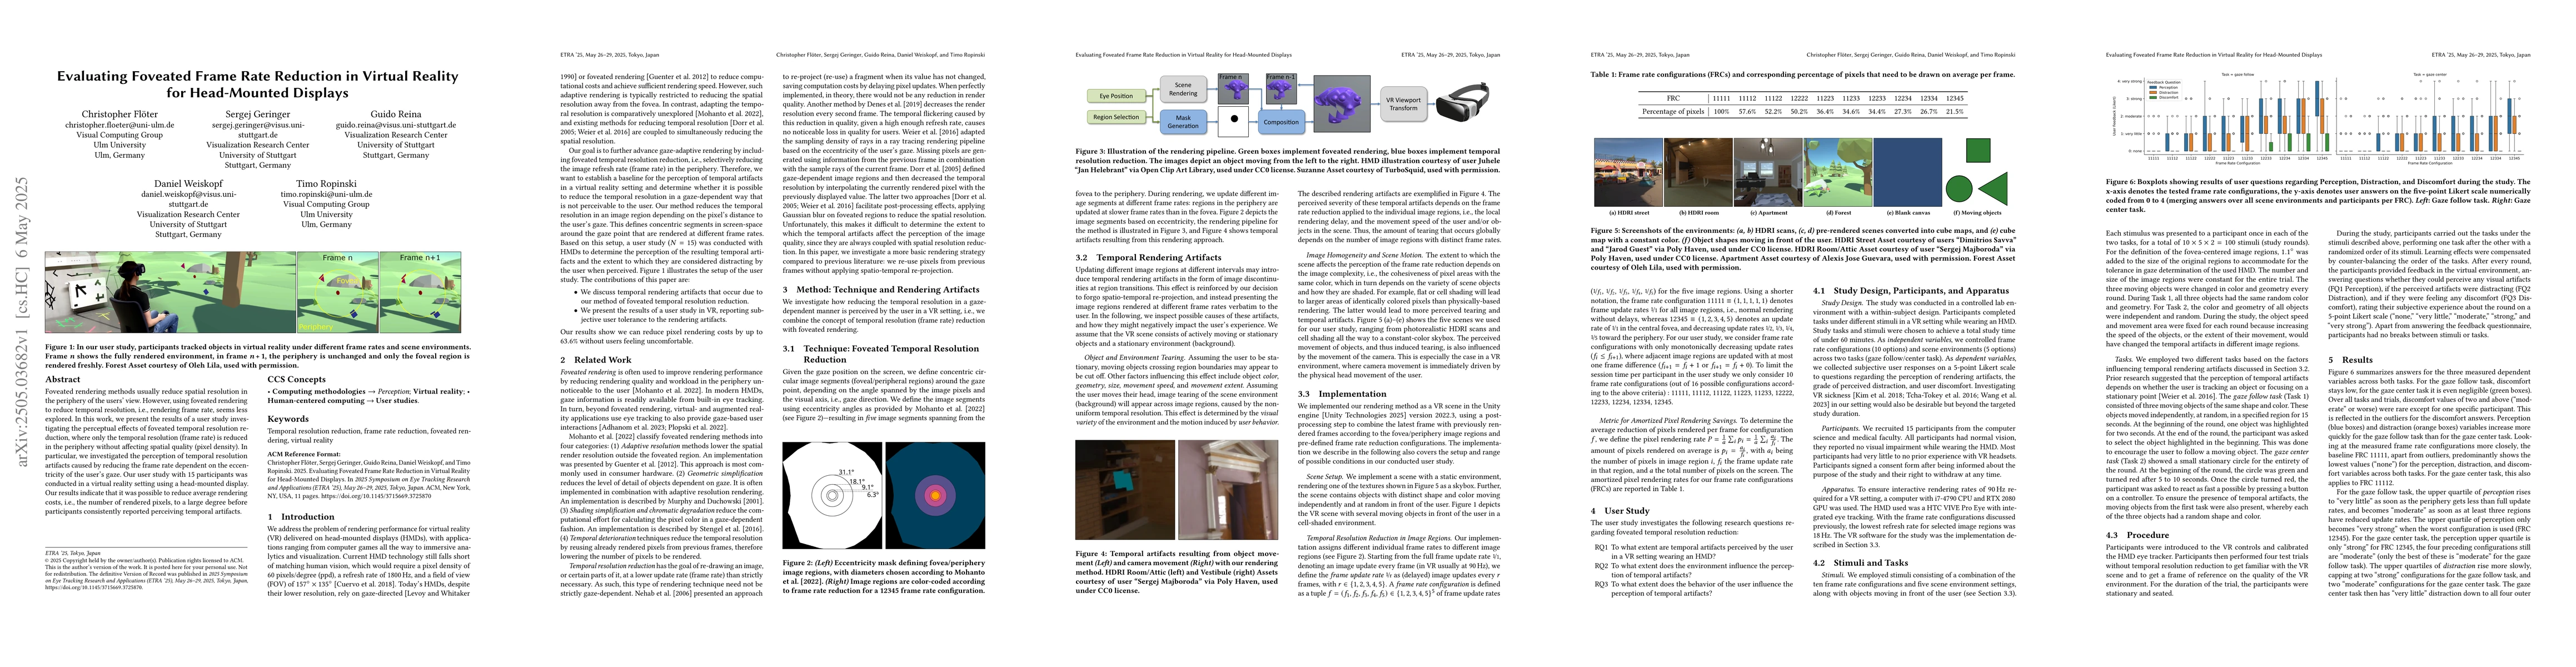
Foveated rendering methods usually reduce spatial resolution in the periphery of the users' view. However, using foveated rendering to reduce temporal resolution, i.e., rendering frame rate, seems les...
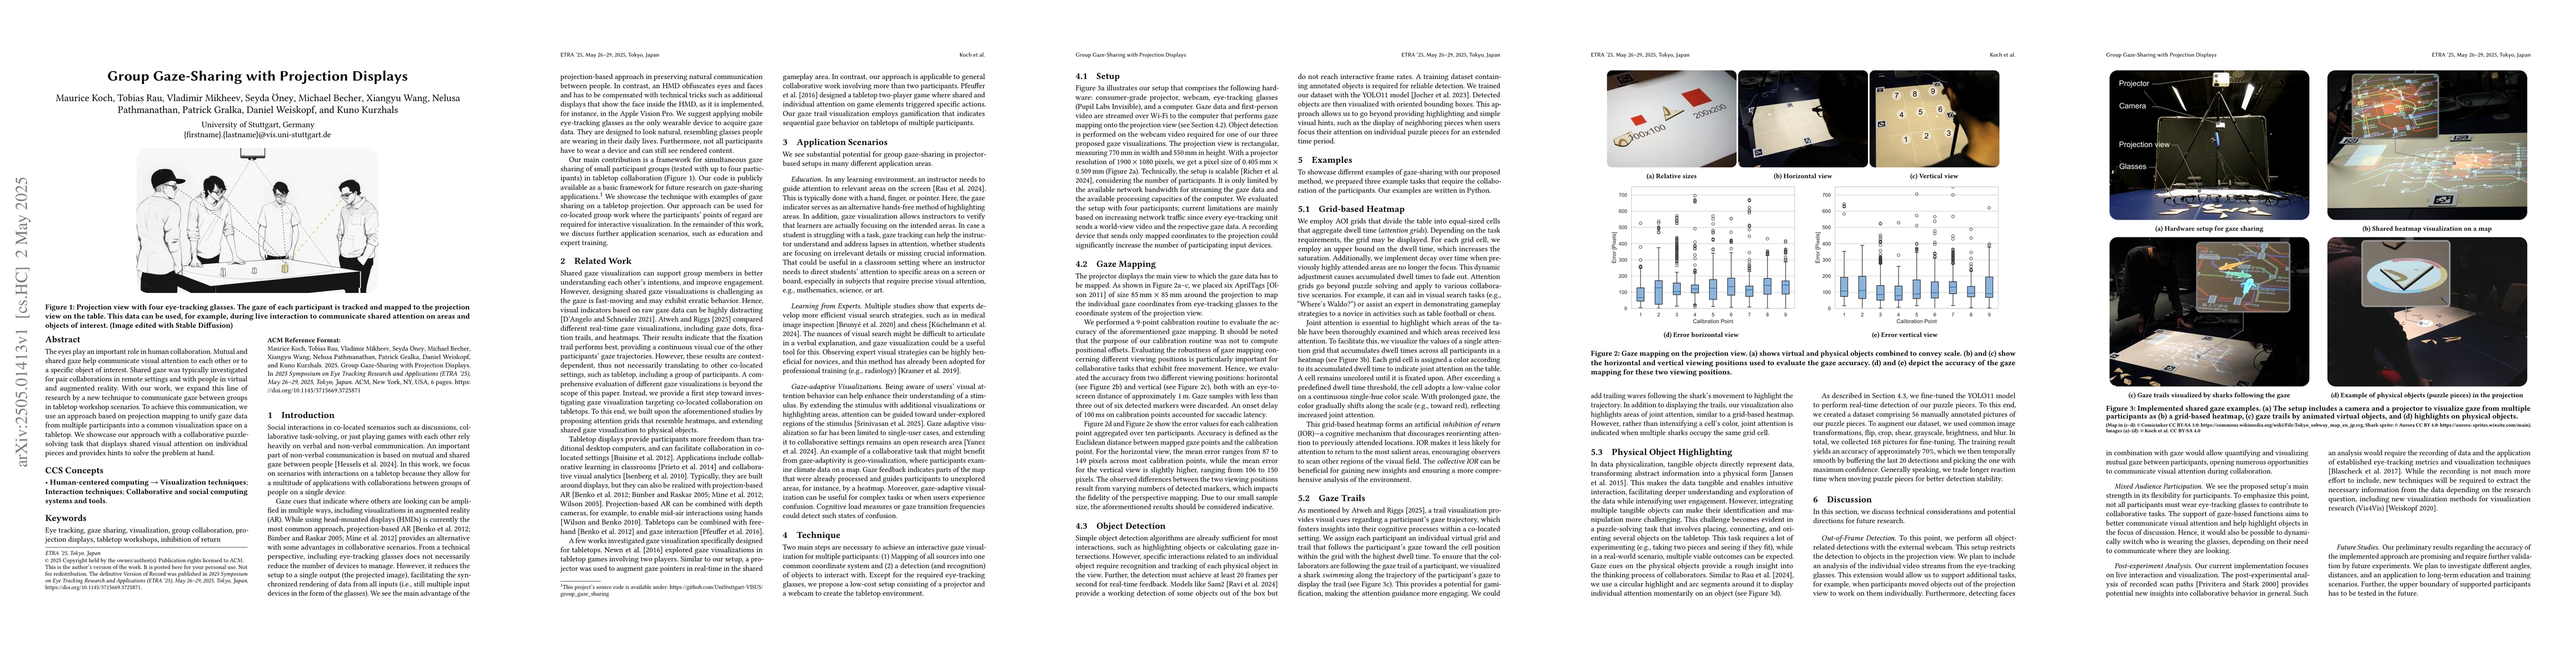
The eyes play an important role in human collaboration. Mutual and shared gaze help communicate visual attention to each other or to a specific object of interest. Shared gaze was typically investigat...
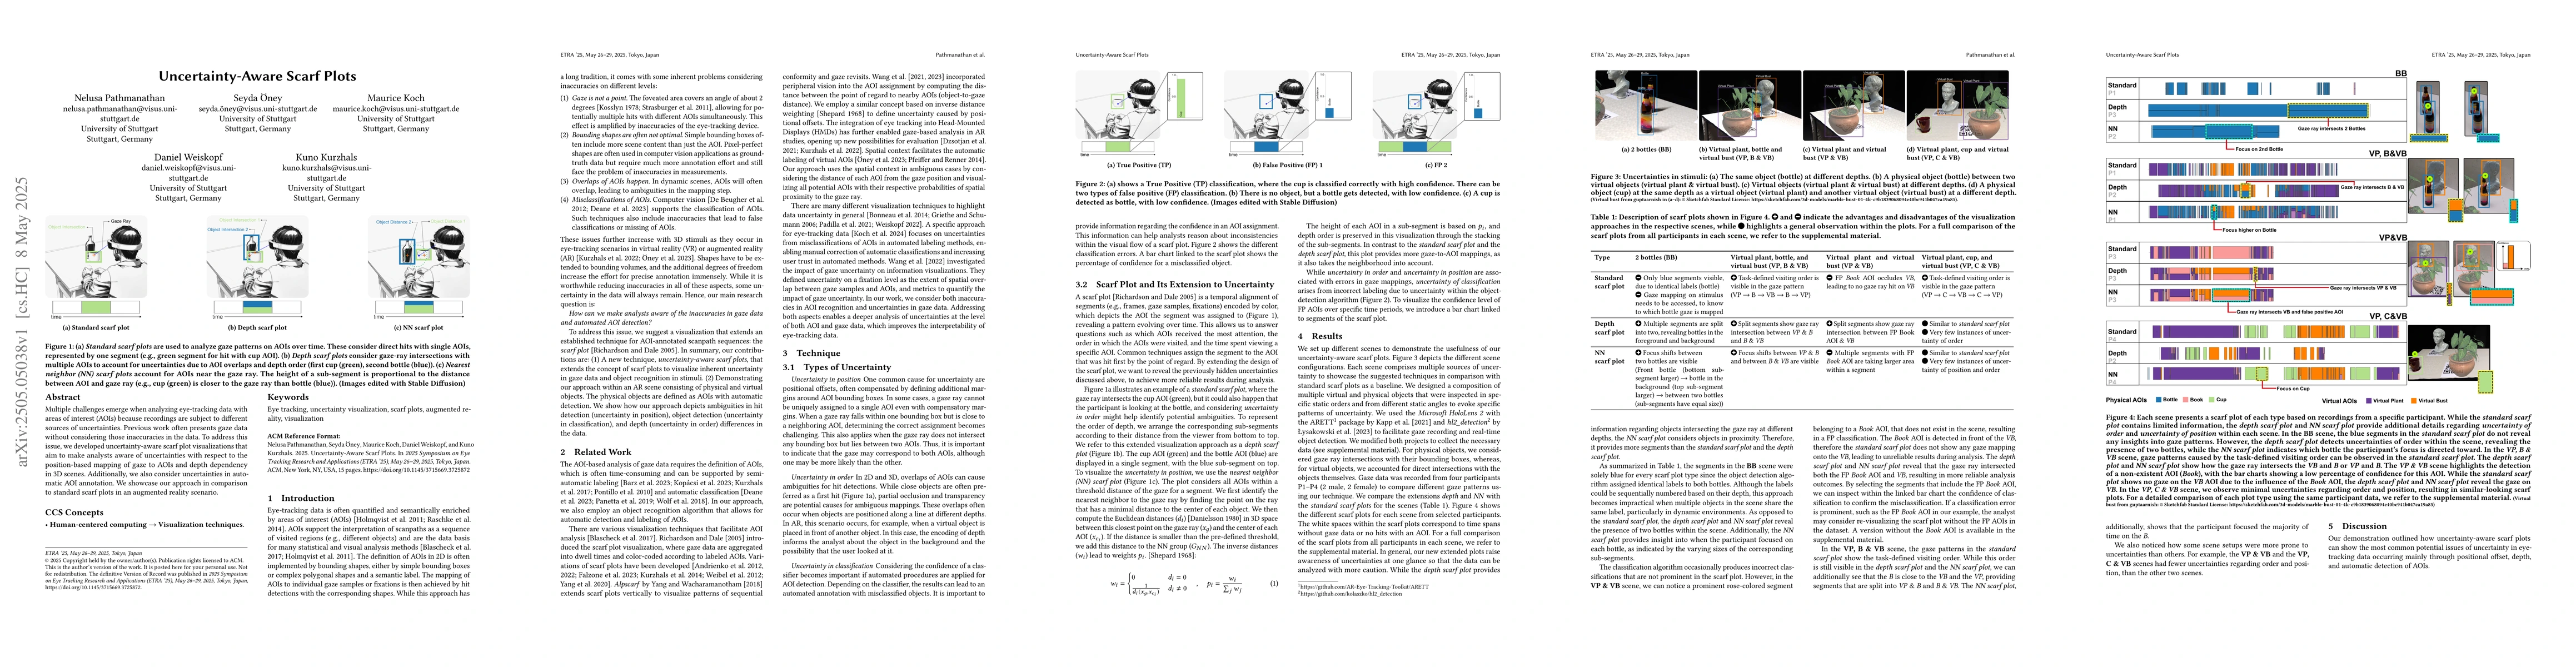
Multiple challenges emerge when analyzing eye-tracking data with areas of interest (AOIs) because recordings are subject to different sources of uncertainties. Previous work often presents gaze data w...
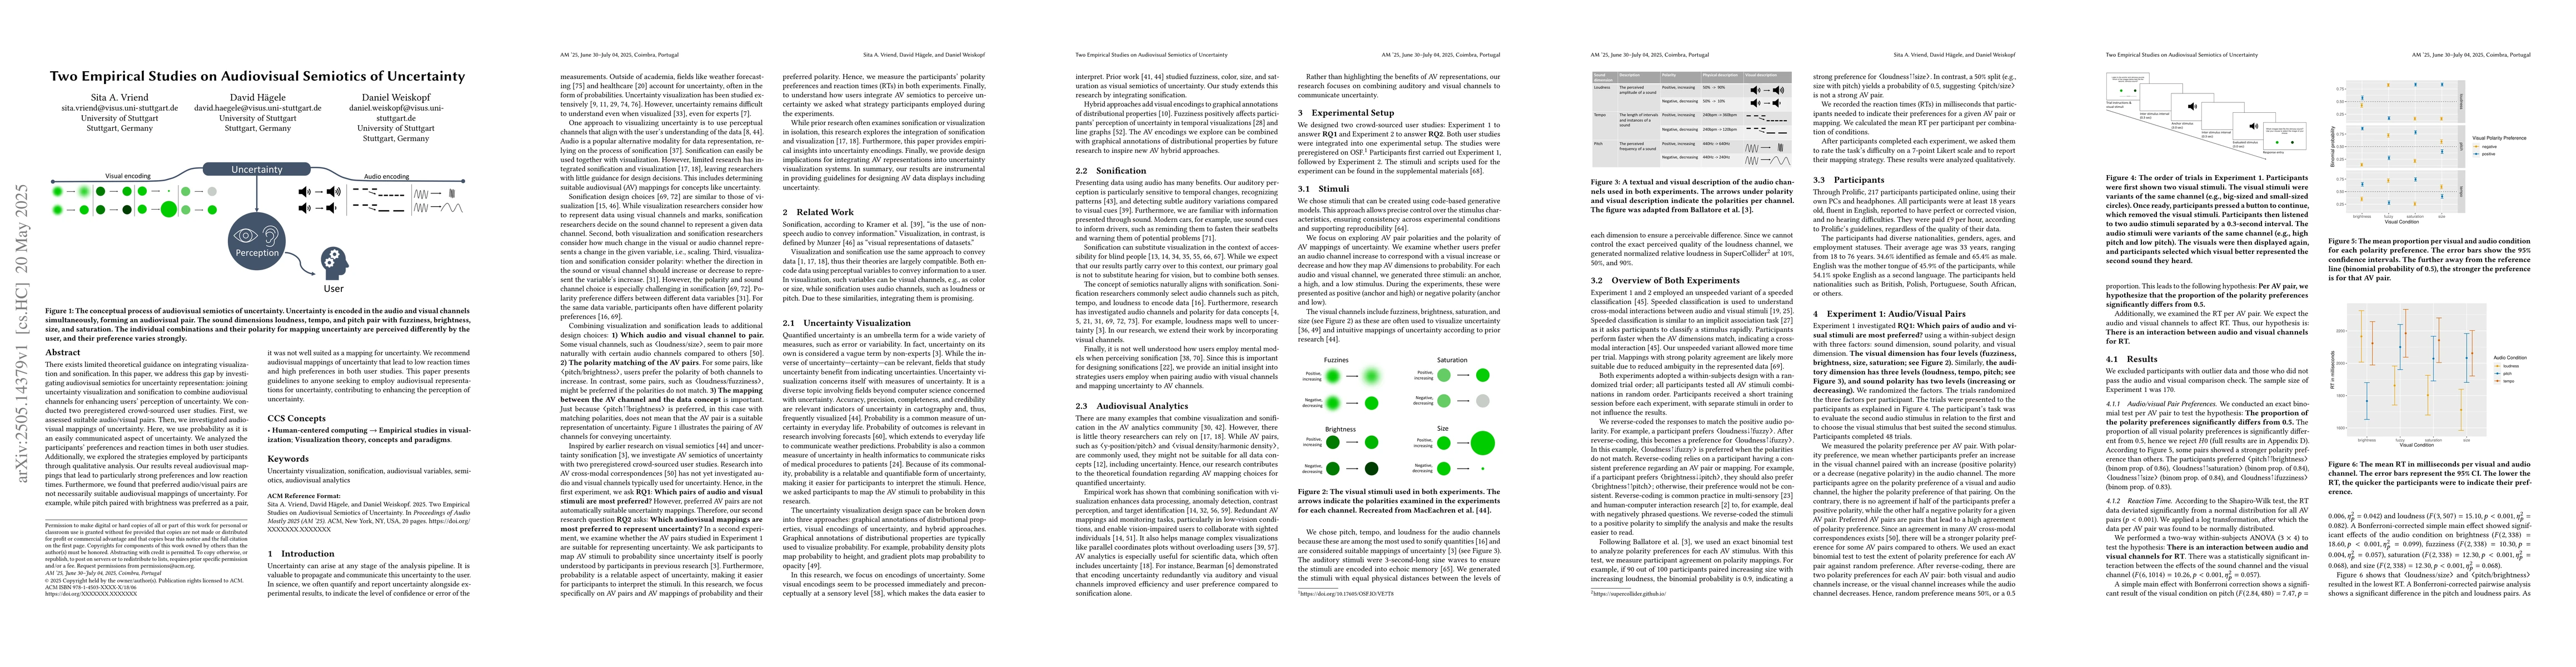
There exists limited theoretical guidance on integrating visualization and sonification. In this paper, we address this gap by investigating audiovisual semiotics for uncertainty representation: joini...
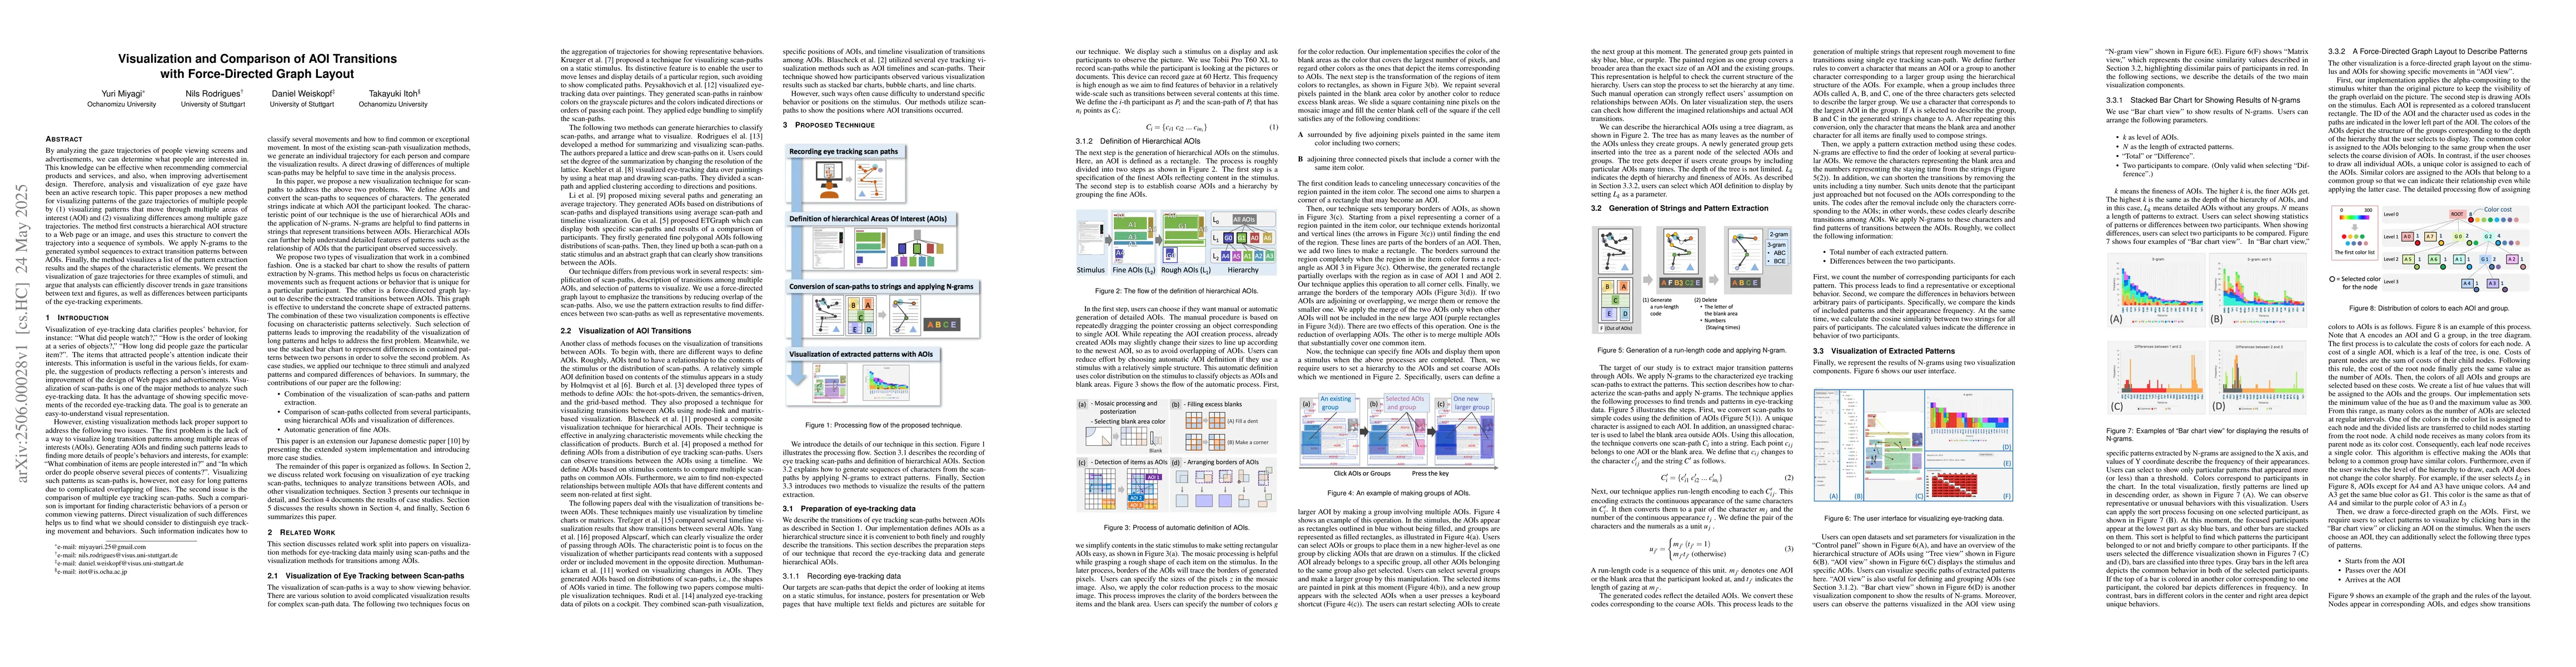
By analyzing the gaze trajectories of people viewing screens and advertisements, we can determine what people are interested in. This knowledge can be effective when recommending commercial products a...
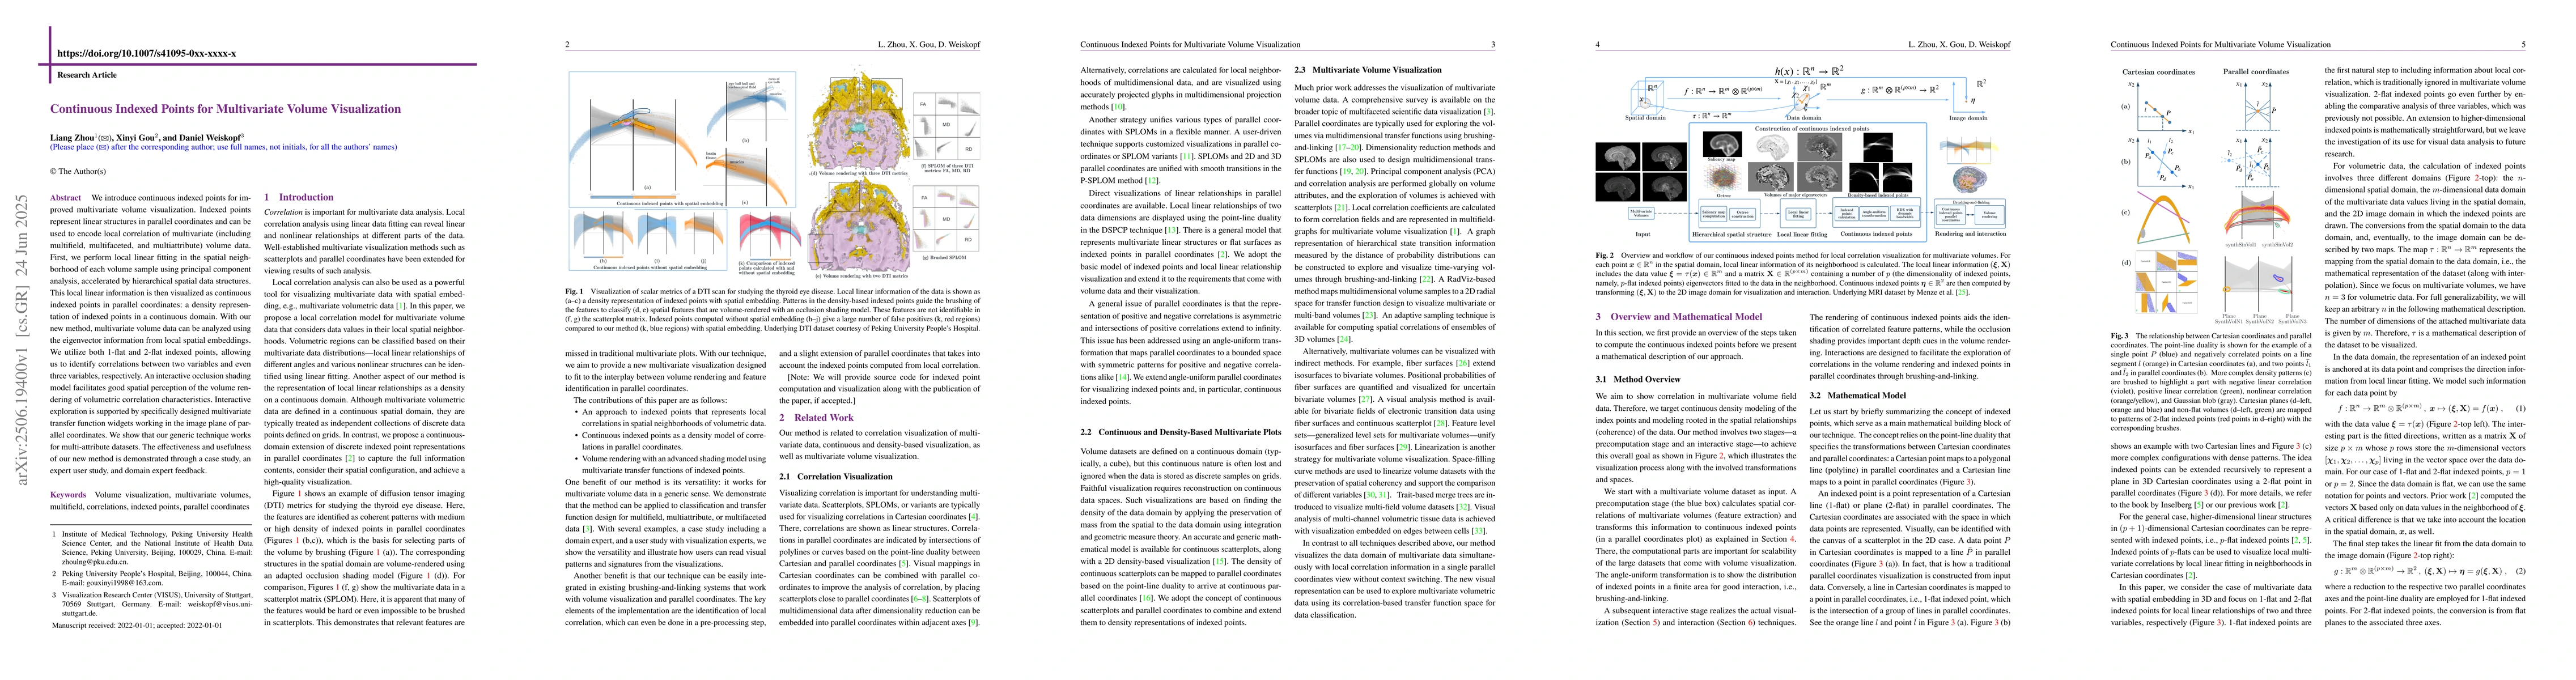
We introduce continuous indexed points for improved multivariate volume visualization. Indexed points represent linear structures in parallel coordinates and can be used to encode local correlation of...
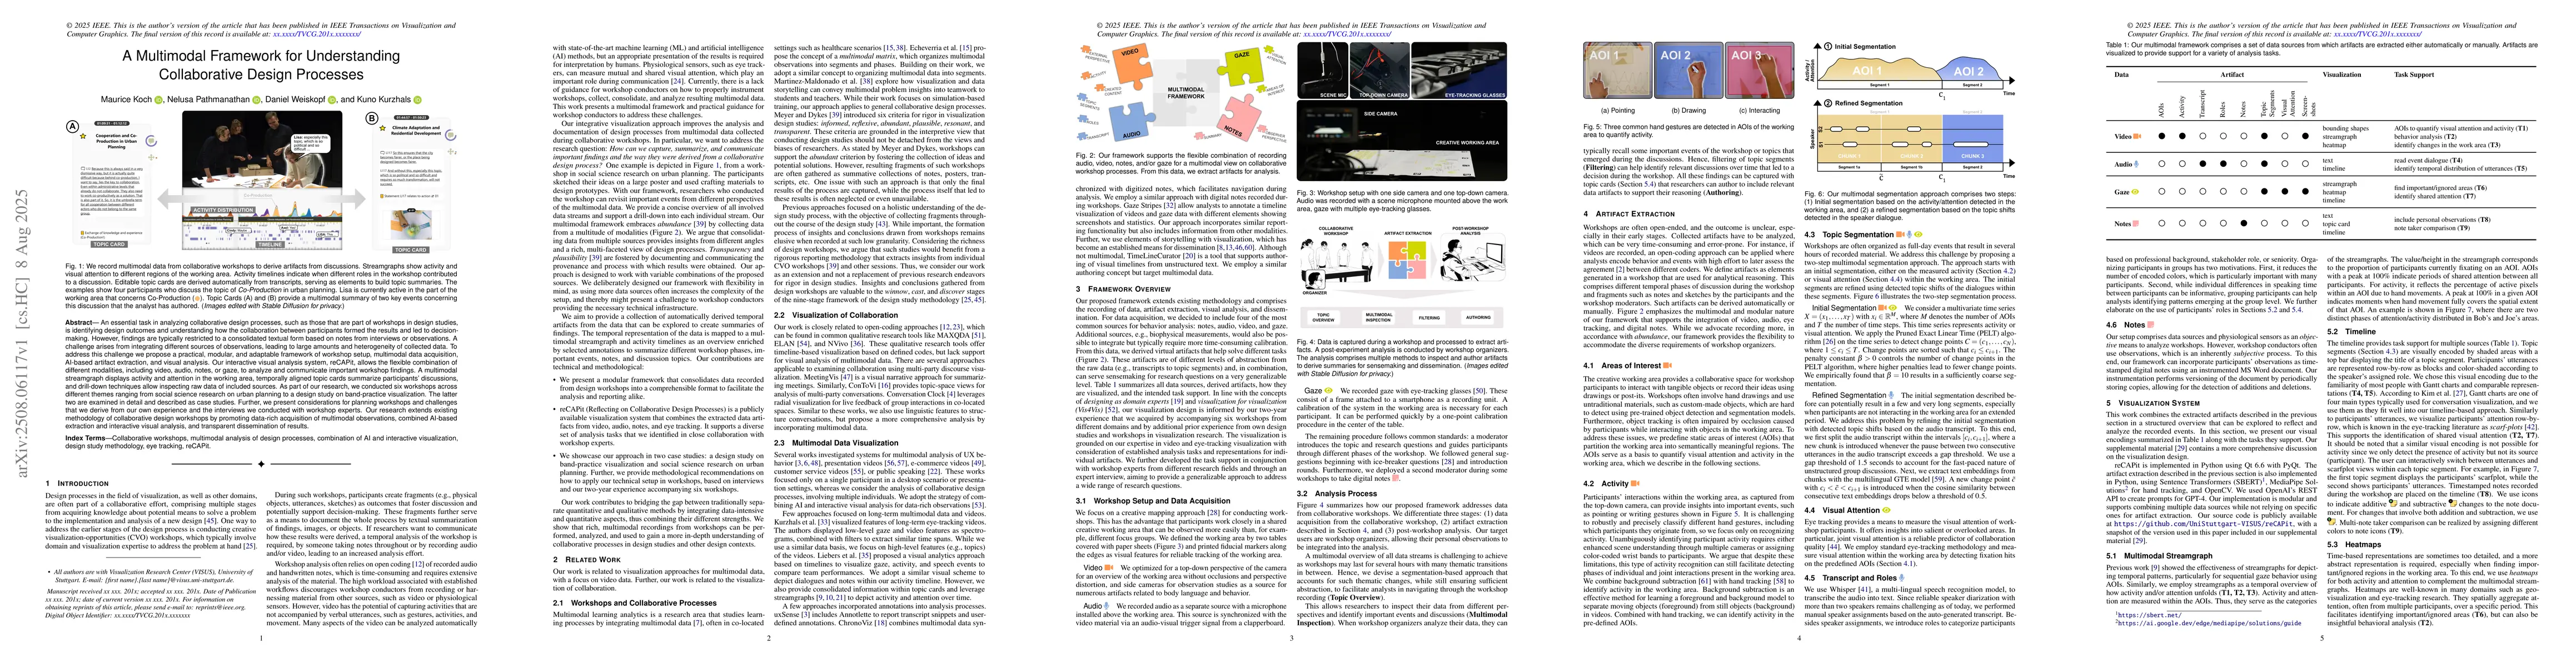
An essential task in analyzing collaborative design processes, such as those that are part of workshops in design studies, is identifying design outcomes and understanding how the collaboration betwee...
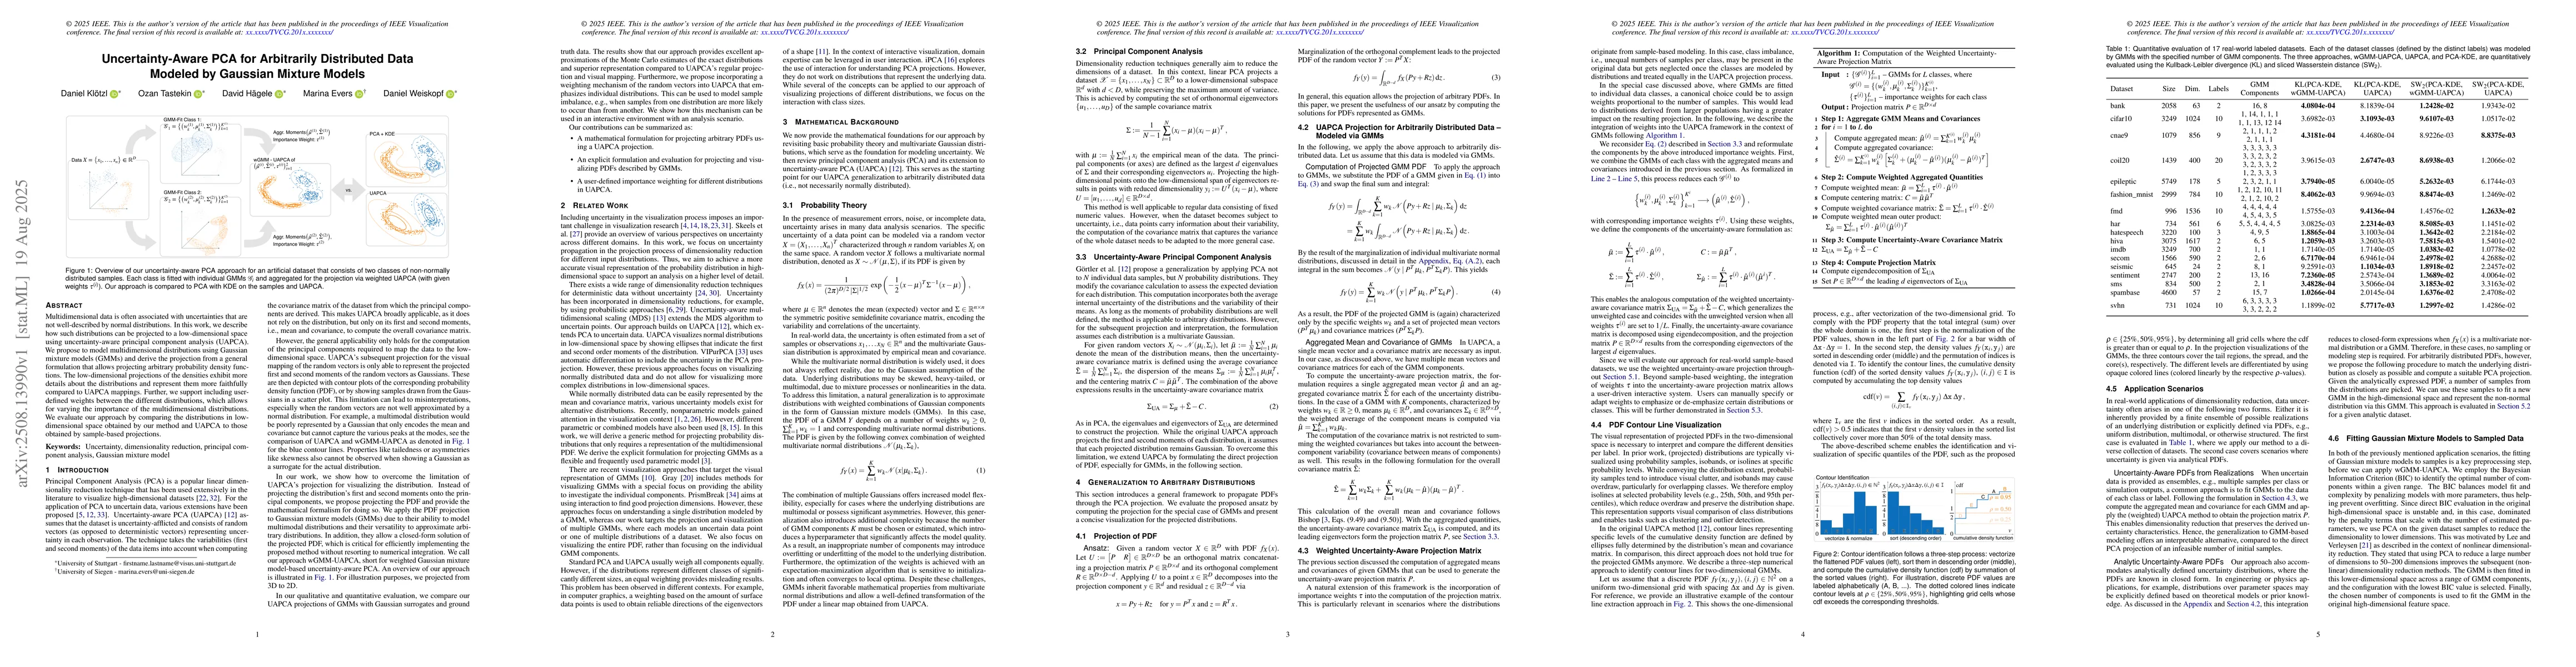
Multidimensional data is often associated with uncertainties that are not well-described by normal distributions. In this work, we describe how such distributions can be projected to a low-dimensional...
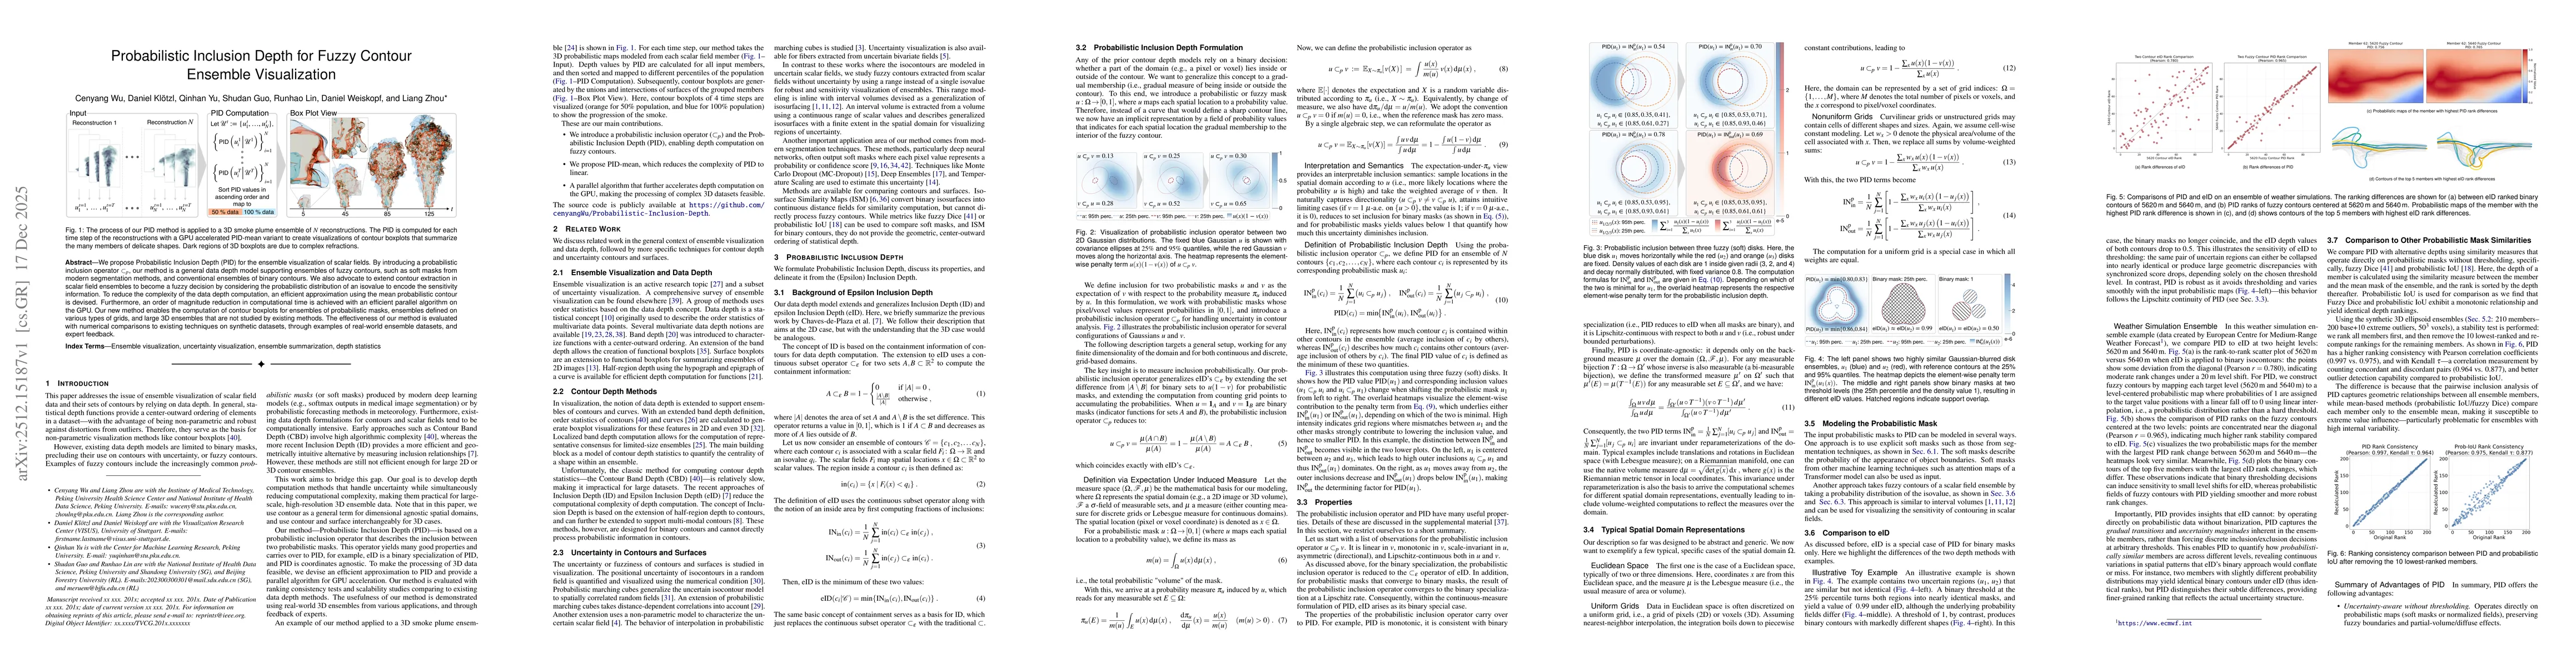
We propose Probabilistic Inclusion Depth (PID) for the ensemble visualization of scalar fields. By introducing a probabilistic inclusion operator $\subset_{\!p}$, our method is a general data depth mo...