Visual Compositional Data Analytics for Spatial Transcriptomics
Publication
Metrics
AI Quick Summary
The paper proposes a visual analytics system for spatial transcriptomics data that redesigns scatter pie charts with three linked views: a tissue image, a stacked bar chart of cell type proportions, and a scatter plot for dimensionality reduction. It employs compositional data analysis and $k$-means clustering to uncover patterns in cell type mixtures. The system leverages brushing and linking to facilitate exploration and pattern recognition.
Paper Preview
Abstract
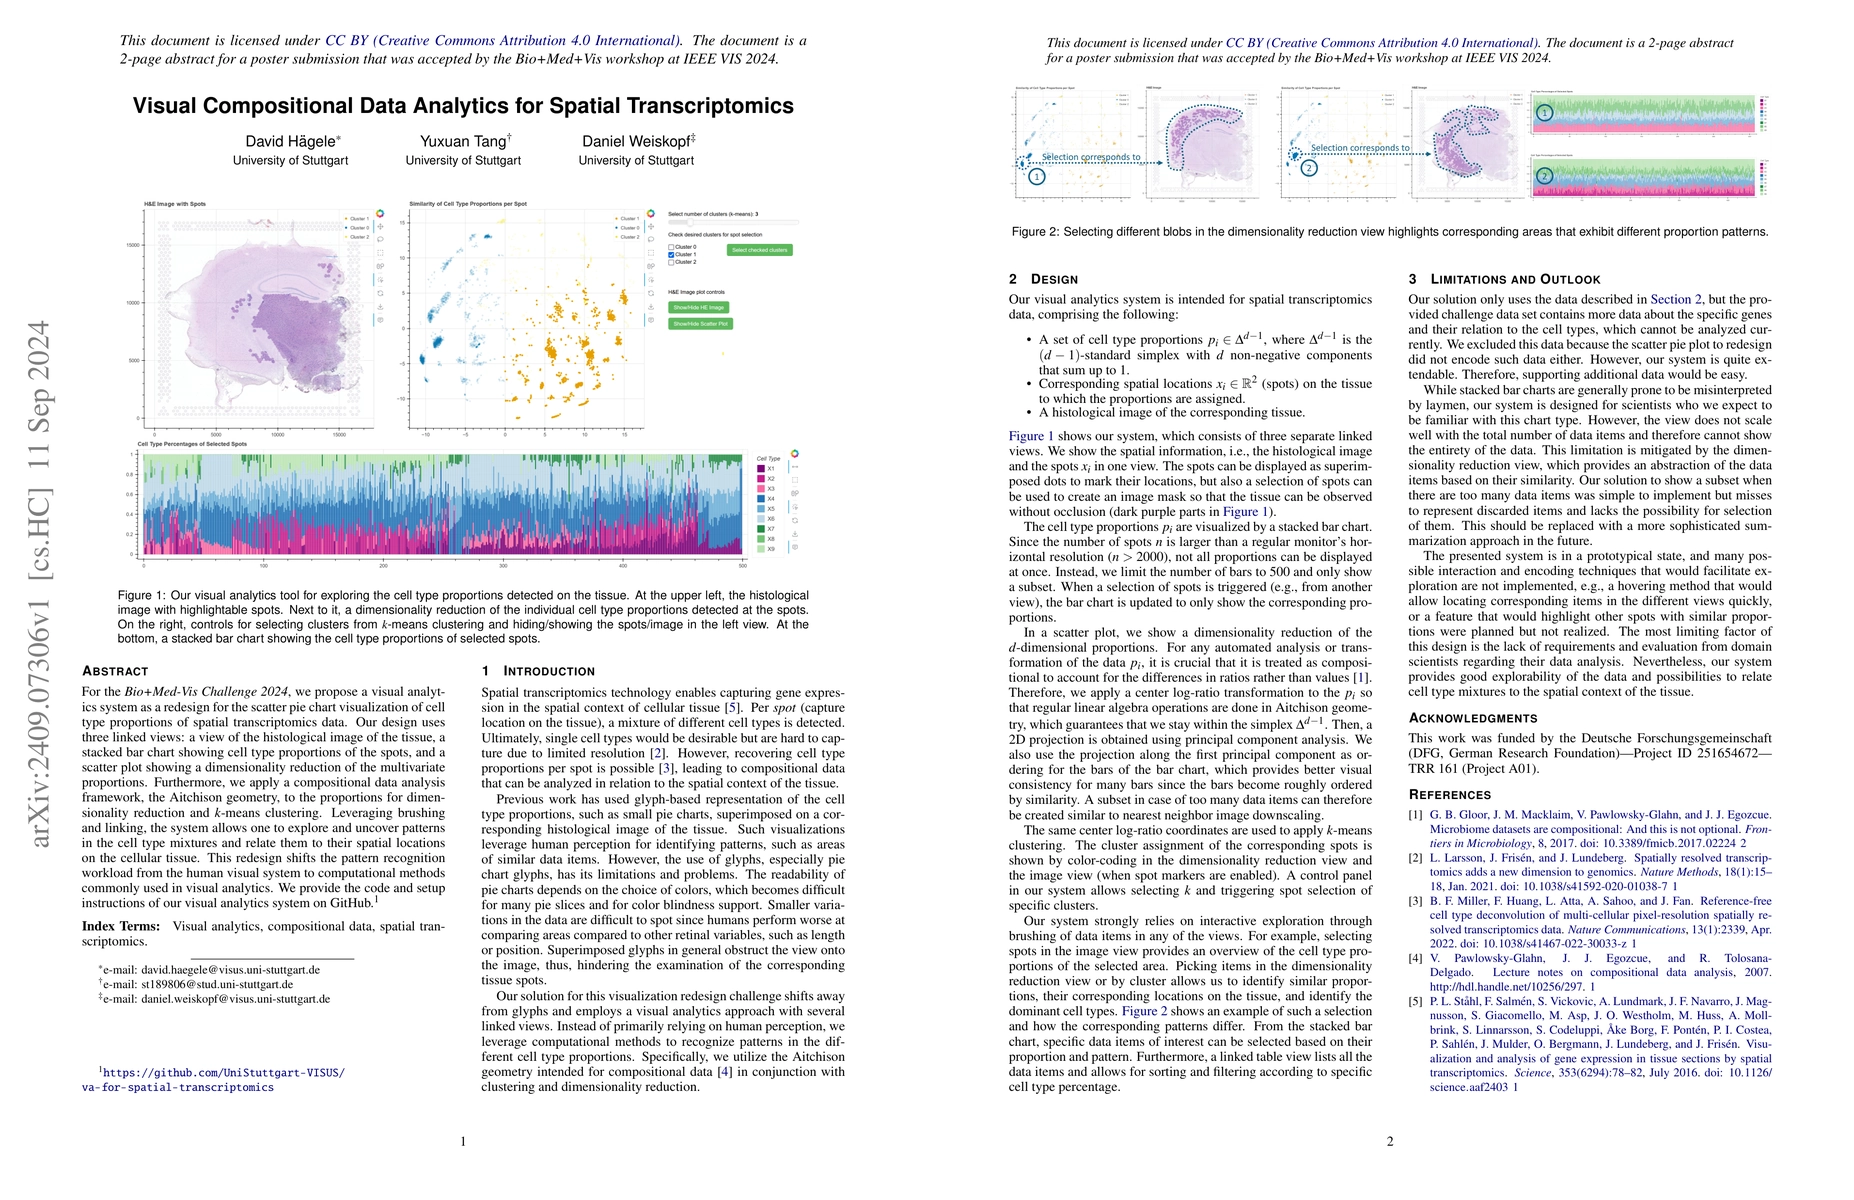
For the Bio+Med-Vis Challenge 2024, we propose a visual analytics system as a redesign for the scatter pie chart visualization of cell type proportions of spatial transcriptomics data. Our design uses three linked views: a view of the histological image of the tissue, a stacked bar chart showing cell type proportions of the spots, and a scatter plot showing a dimensionality reduction of the multivariate proportions. Furthermore, we apply a compositional data analysis framework, the Aitchison geometry, to the proportions for dimensionality reduction and $k$-means clustering. Leveraging brushing and linking, the system allows one to explore and uncover patterns in the cell type mixtures and relate them to their spatial locations on the cellular tissue. This redesign shifts the pattern recognition workload from the human visual system to computational methods commonly used in visual analytics. We provide the code and setup instructions of our visual analytics system on GitHub (https://github.com/UniStuttgart-VISUS/va-for-spatial-transcriptomics).
AI Key Findings
Get AI-generated insights about this paper's methodology, results, significance, and more — seven facets brought into focus.
Impact
Paper Details
Authors
PDF Preview
Citation Network
Current paper (gray), citations (green), references (blue)
Display is limited for performance on very large graphs.
Discussion 0