Quick Summary:

This study compares node-link diagrams, adjacency matrices, and bipartite layouts for visualizing large, directed networks, focusing on overview tasks. Bipartite layouts were found effective for overall network structure, while adjacency matrices performed best across all tasks.

Summary

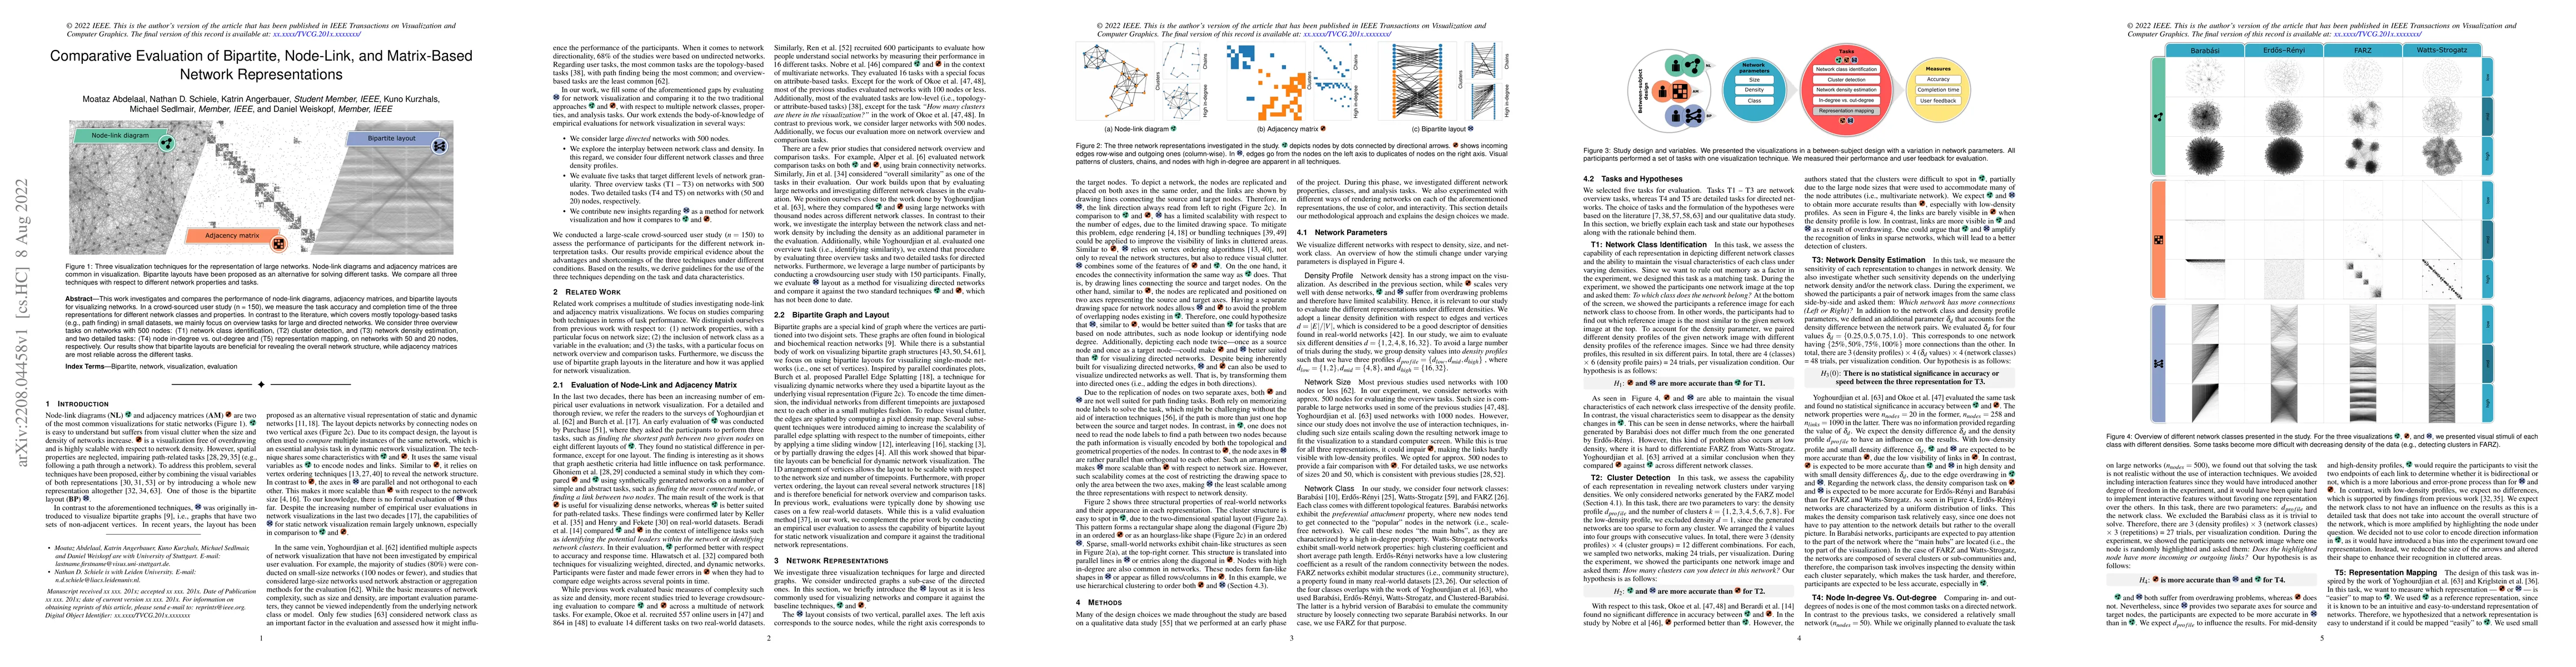
This work investigates and compares the performance of node-link diagrams, adjacency matrices, and bipartite layouts for visualizing networks. In a crowd-sourced user study (n = 150), we measure the task accuracy and completion time of the three representations for different network classes and properties. In contrast to the literature, which covers mostly topology-based tasks (e.g., path finding) in small datasets, we mainly focus on overview tasks for large and directed networks. We consider three overview tasks on networks with 500 nodes: (T1) network class identification, (T2) cluster detection, and (T3) network density estimation, and two detailed tasks: (T4) node in-degree vs. out-degree and (T5) representation mapping, on networks with 50 and 20 nodes, respectively. Our results show that bipartite layouts are beneficial for revealing the overall network structure, while adjacency matrices are most reliable across the different tasks.

AI Key Findings

Get AI-generated insights about this paper's methodology, results, and significance.

Paper Details

PDF Preview

Download PDF

Key Terms

adjacency (0.280)
tasks (0.255)
bipartite (0.251)
tasks (0.250)
bipartite (0.242)
overview (0.227)
overview (0.223)
node (0.215)
networks (0.214)
networks (0.211)
node (0.208)
nodes (0.200)
network (0.199)
matrices (0.198)
nodes (0.197)
network (0.197)
matrices (0.194)
degree (0.180)
degree (0.172)
sourced (0.161)
Title Authors Year Actions
Crowdsourced Think-Aloud Studies
Zach Cutler, Lane Harrison, C. Nobre, Alexander Lex
2025
View Paper
Bridging Network Science and Vision Science: Mapping Perceptual Mechanisms to Network Visualization Tasks.
S. Bae, Kyle Cave, Carsten Görg, Paul Rosen, D. Szafir, Cindy Xiong Bearfield
2025
View Paper
The Census-Stub Graph Invariant Descriptor
Matt I. B. Oddo, S. Kobourov, Tamara Munzner
2024
View Paper
Me! Me! Me! Me! A study and comparison of ego network representations
Henry Ehlers, Daniel Pahr, V. Filipov, Hsiang-Yun Wu, R. Raidou
2024
View Paper
AdaMotif: Graph Simplification via Adaptive Motif Design
Hong Zhou, Peifeng Lai, Zhida Sun, Xiangyuan Chen, Yang Chen, Huisi Wu, Yong Wang
2024
View Paper
Improved Visual Saliency of Graph Clusters with Orderable Node-Link Layouts
Nora Al-Naami, N. Médoc, Matteo Magnani, M. Ghoniem
2024
View Paper
STEP: Sequence of time-aligned edge plots
Moataz Abdelaal, Fabian Kannenberg, Antoine Lhuillier, Marcel Hlawatsch, Achim Menges, Daniel Weiskopf
2024
View Paper
Eye Tracking on Text Reading with Visual Enhancements
Franziska Huth, Maurice Koch, Miriam Awad-Mohammed, D. Weiskopf, K. Kurzhals
2024
View Paper
HINTs: Sensemaking on large collections of documents with Hypergraph visualization and INTelligent agents
Sam Yu-Te Lee, Kwan-Liu Ma
2024
View Paper
Snowflake: visualizing microbiome abundance tables as multivariate bipartite graphs
Jannes Peeters, Daniël M. Bot, Gustavo Rovelo, Jan Aerts
2024
View Paper
A Comparative Study on Fixed-Order Event Sequence Visualizations: Gantt, Extended Gantt, and Stringline Charts
Junxiu Tang, Fumeng Yang, Jiang Wu, Yifang Wang, Jiayi Zhou, Xiwen Cai, Lingyun Yu, Yingcai Wu
2024
View Paper
On Network Structural and Temporal Encodings: A Space and Time Odyssey
V. Filipov, Alessio Arleo, M. Bögl, S. Miksch
2023
View Paper
: A Visual Analytics Approach for Understanding the Dual Frontiers of Science and Technology
Yifang Wang, Yifan Qian, Xiaoyu Qi, Nan Cao, Dashun Wang
2023
View Paper
Unfolding Edges: Adding Context to Edges in Multivariate Graph Visualization
Mark-Jan Bludau, Marian Dörk, C. Tominski
2023
View Paper
visMOP – A Visual Analytics Approach for Multi‐omics Pathways
N. Brich, Nadine Schacherer, M. Hoene, C. Weigert, Rainer Lehmann, Michael Krone
2023
View Paper
Matrix Snap&Go: Visualization of Paths on Matrices
Zeyang Huang, Daniel Archambault, Rita Borgo, A. Kerren
2024
View Paper
Perception in Network Visualization
∗. KarstenKlein, ∗. StephenKobourov, ∗. BerniceE.Rogowitz, ∗. DanielleSzafir, †. JacobMiller, Executive Summary, Tim Dwyer, P. Eades, Henry Förster, Seok-Hee Hong, Felix Klesen, Stephen Ko-bourov, Giuseppe Liotta, Kazuo Misue, F. Montecchiani, Alexander Pastukhov, T. Mchedlidze, A. Telea, Marius Raab, C. Hurter, Natalia Melnik, M. Nöllenburg, Michael Aichem, M. Ghoniem, O. Kohlbacher, Mauro Martino, H. Purchase, Mark Wallinger, Hsiang-Yun Wu, Cindy Xiong, C. Görg, Paul Rosen License, Paul Rosen, Carolina Nobre, Daniel Archambault, R. Borgo, A. License, A. Kerren
2023
View Paper
Visualizing Mappings Between Pairwise Ontologies - An Empirical Study of Matrix and Linked Indented List in Their User Support During Class Mapping Creation and Evaluation
Bo Fu, Allison Austin, Max Garcia
2023
View Paper

Comments (0)

This website uses cookies to ensure you get the best experience. Learn more