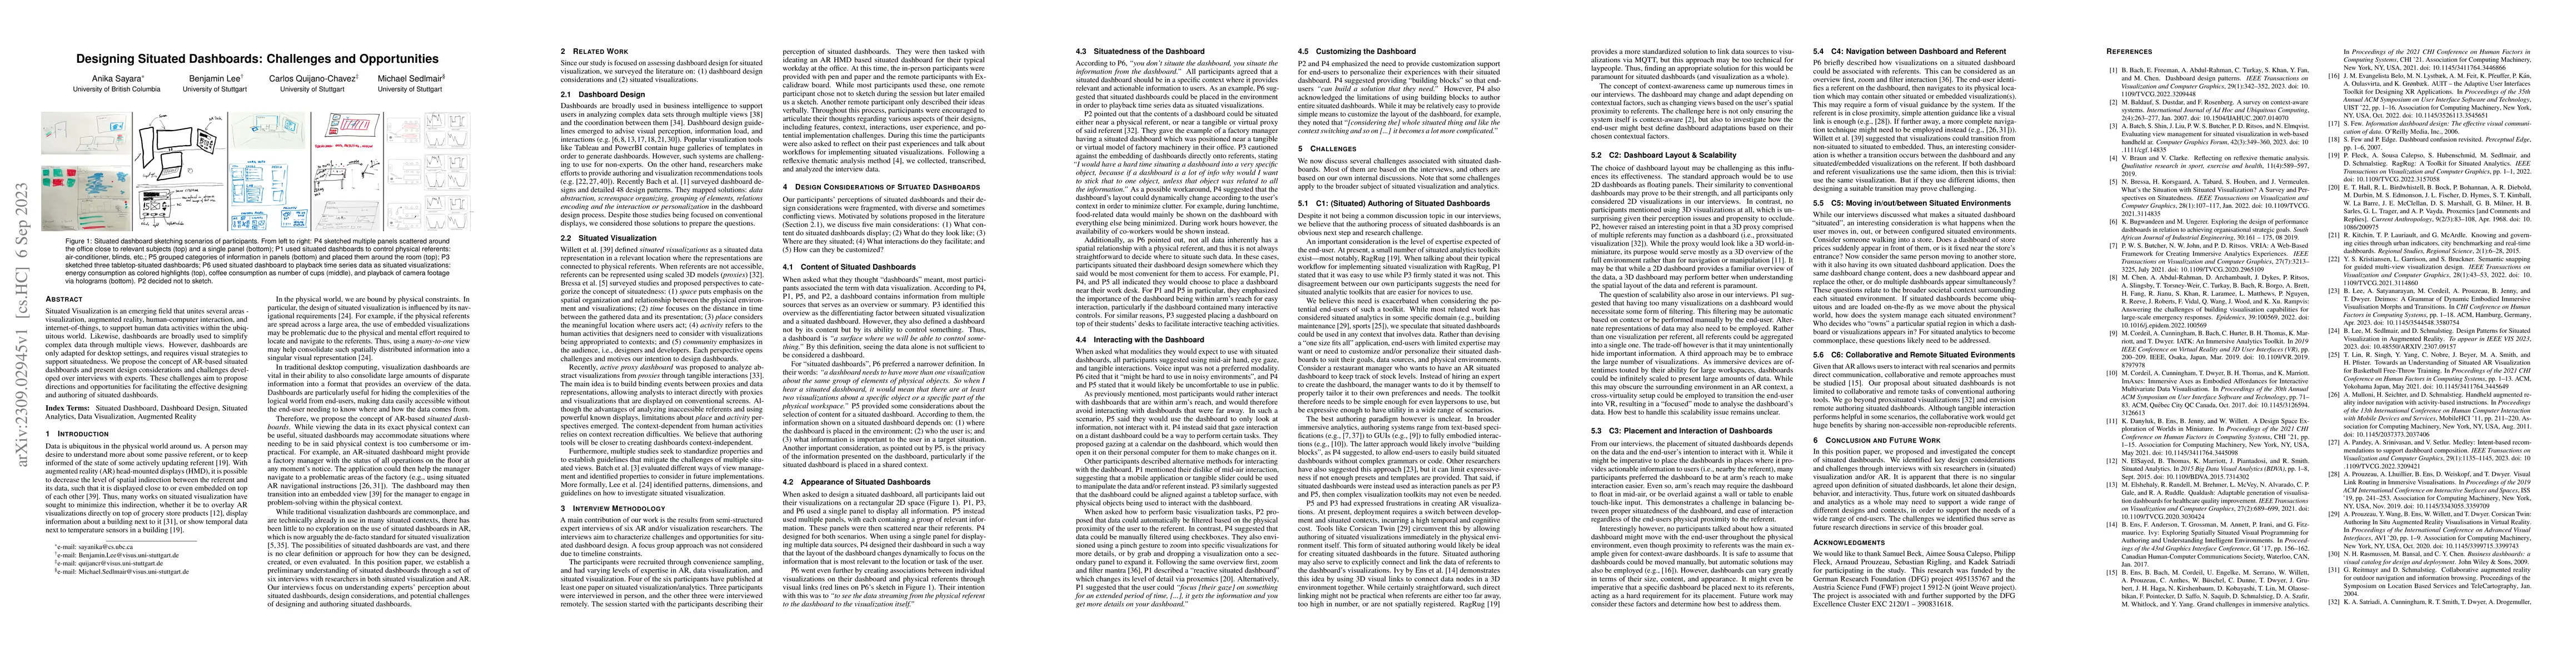
Academic Profile
Statistics
Similar Authors
Papers on arXiv
We present the results of a comprehensive analysis of visualization paper keywords supplied for 4366 papers submitted to five main visualization conferences. We describe main keywords, topic areas, ...
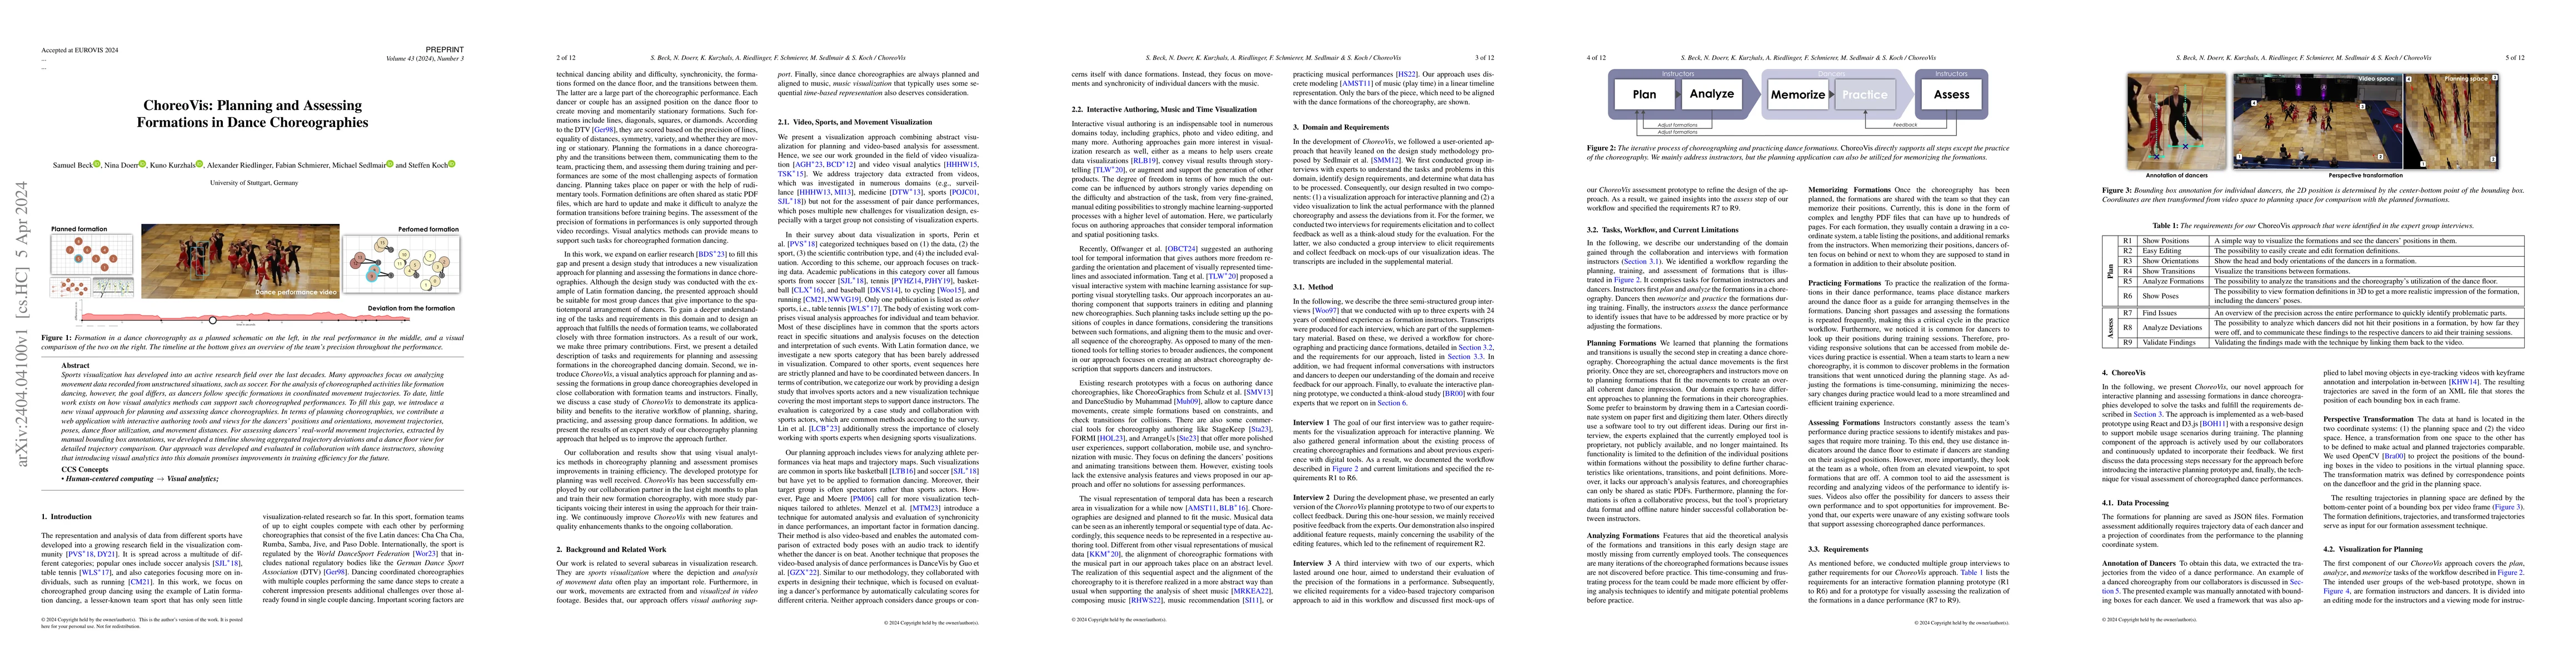
Sports visualization has developed into an active research field over the last decades. Many approaches focus on analyzing movement data recorded from unstructured situations, such as soccer. For th...
Brushing and linking is widely used for visual analytics in desktop environments. However, using this approach to link many data items between situated (e.g., a virtual screen with data) and embedde...
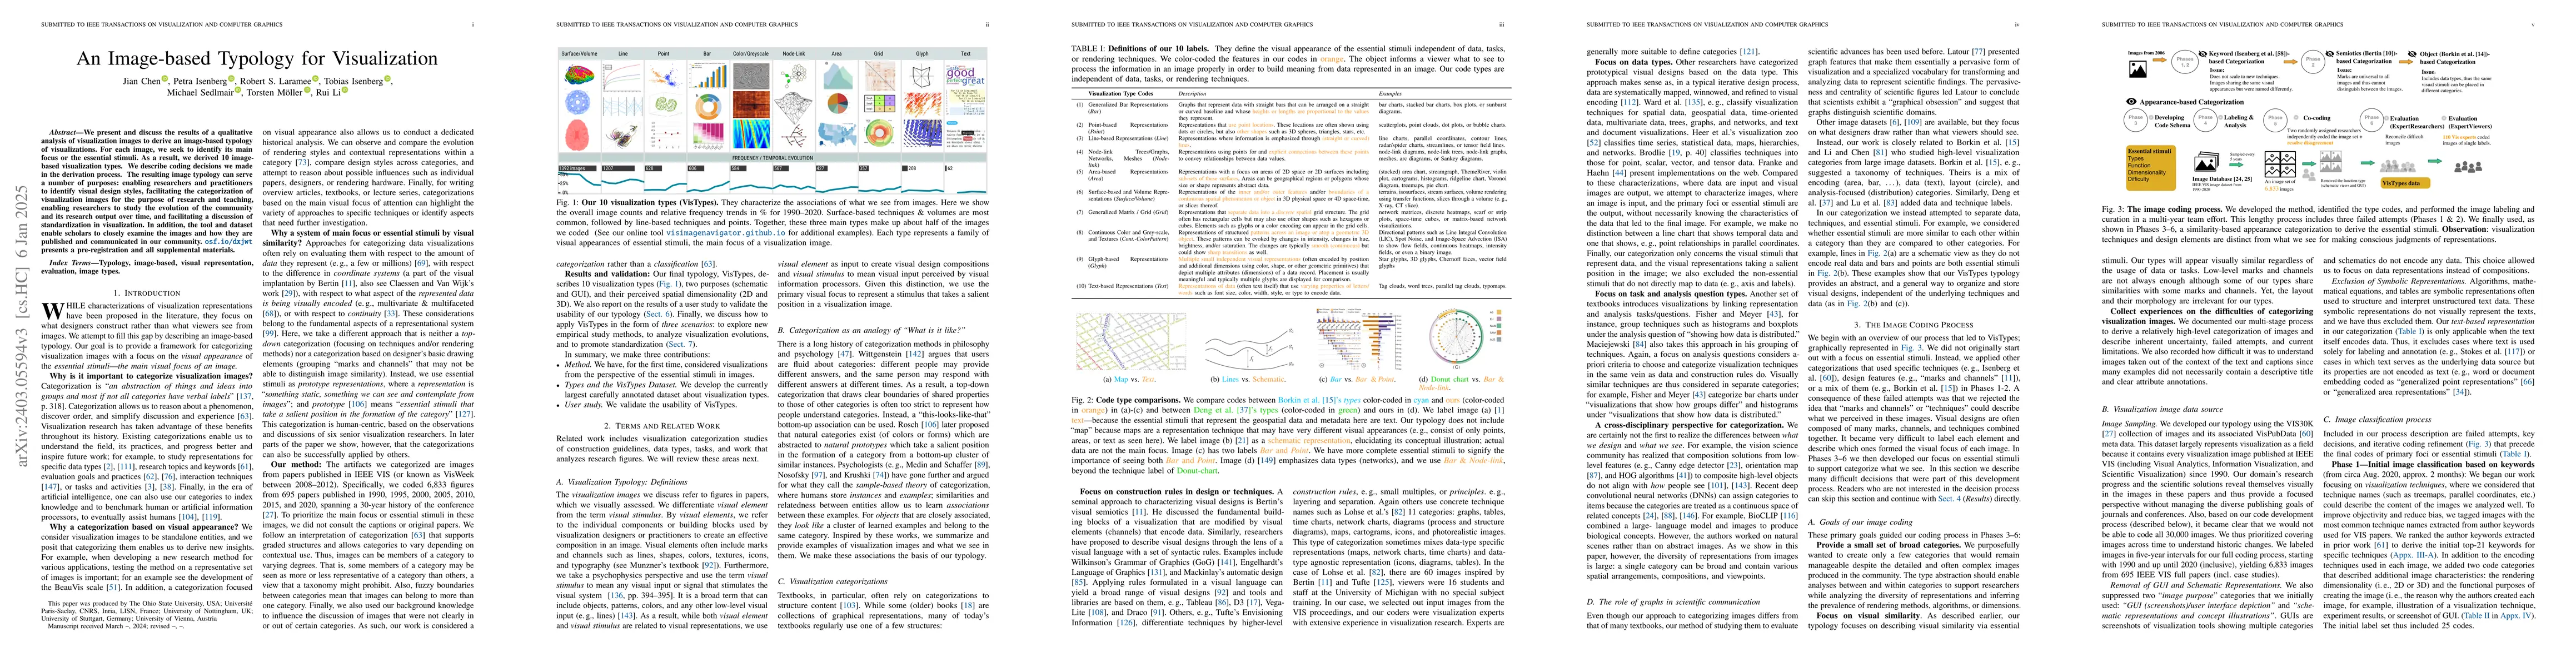
We present and discuss the results of a qualitative analysis of visual representations from images. We labeled each image's essential stimuli, the removal of which would render a visualization unint...
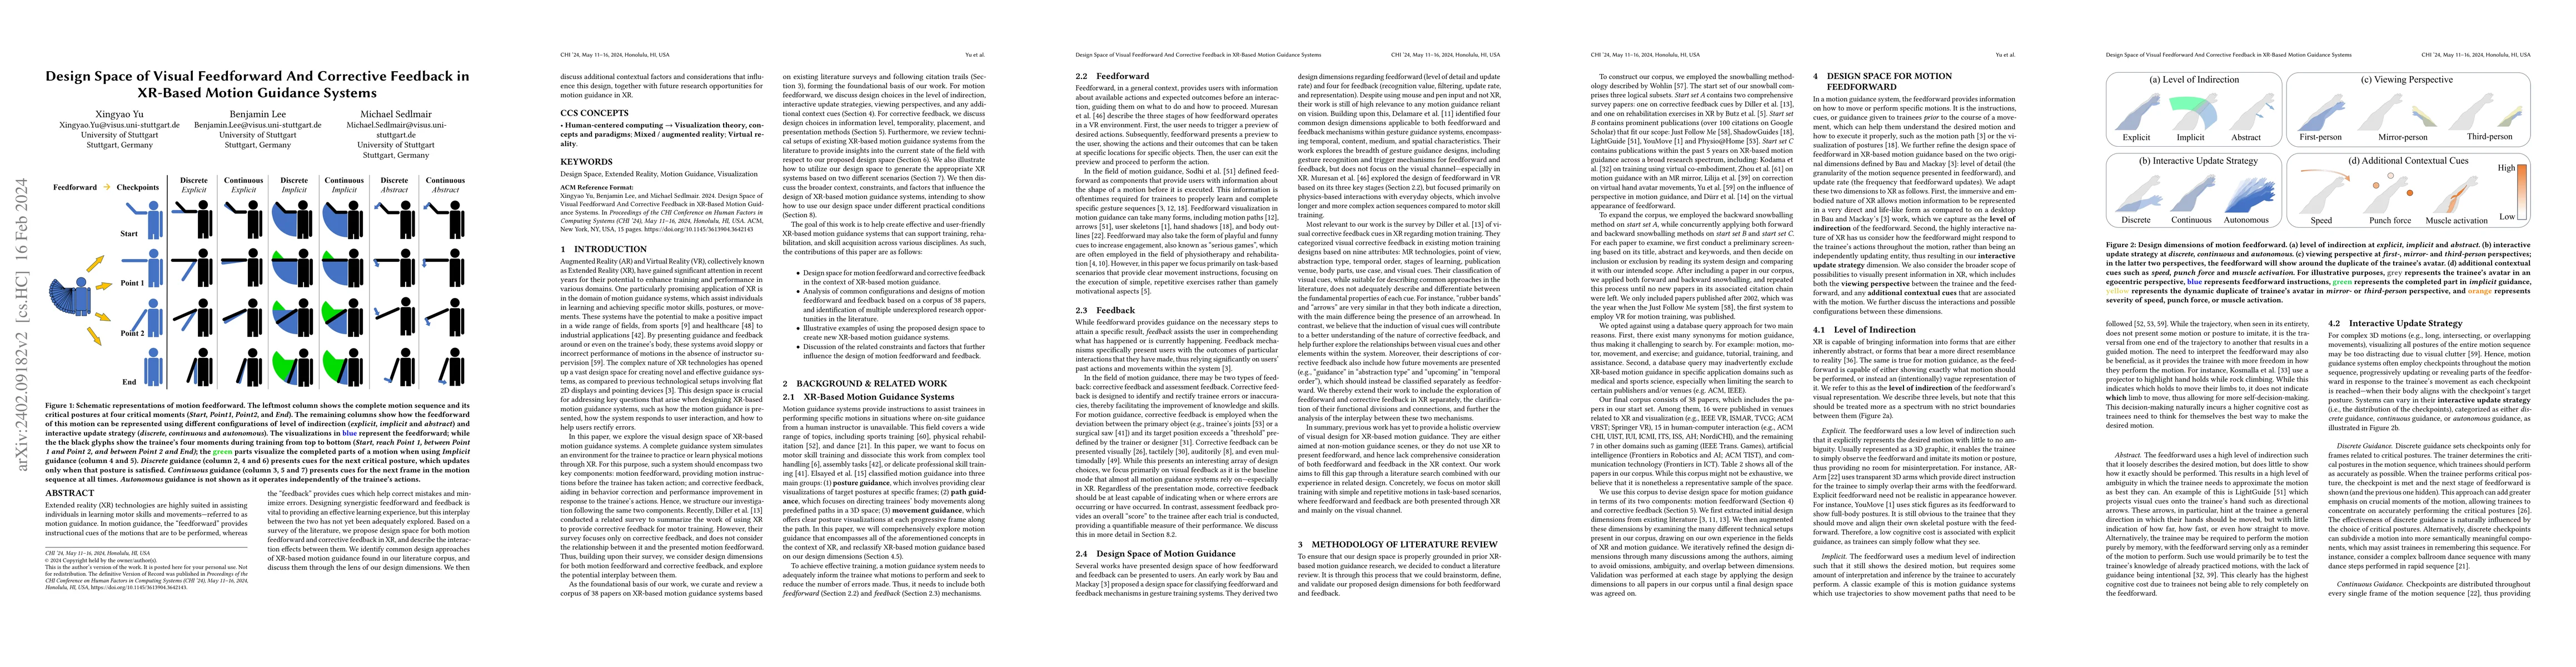
Extended reality (XR) technologies are highly suited in assisting individuals in learning motor skills and movements -- referred to as motion guidance. In motion guidance, the "feedforward" provides...
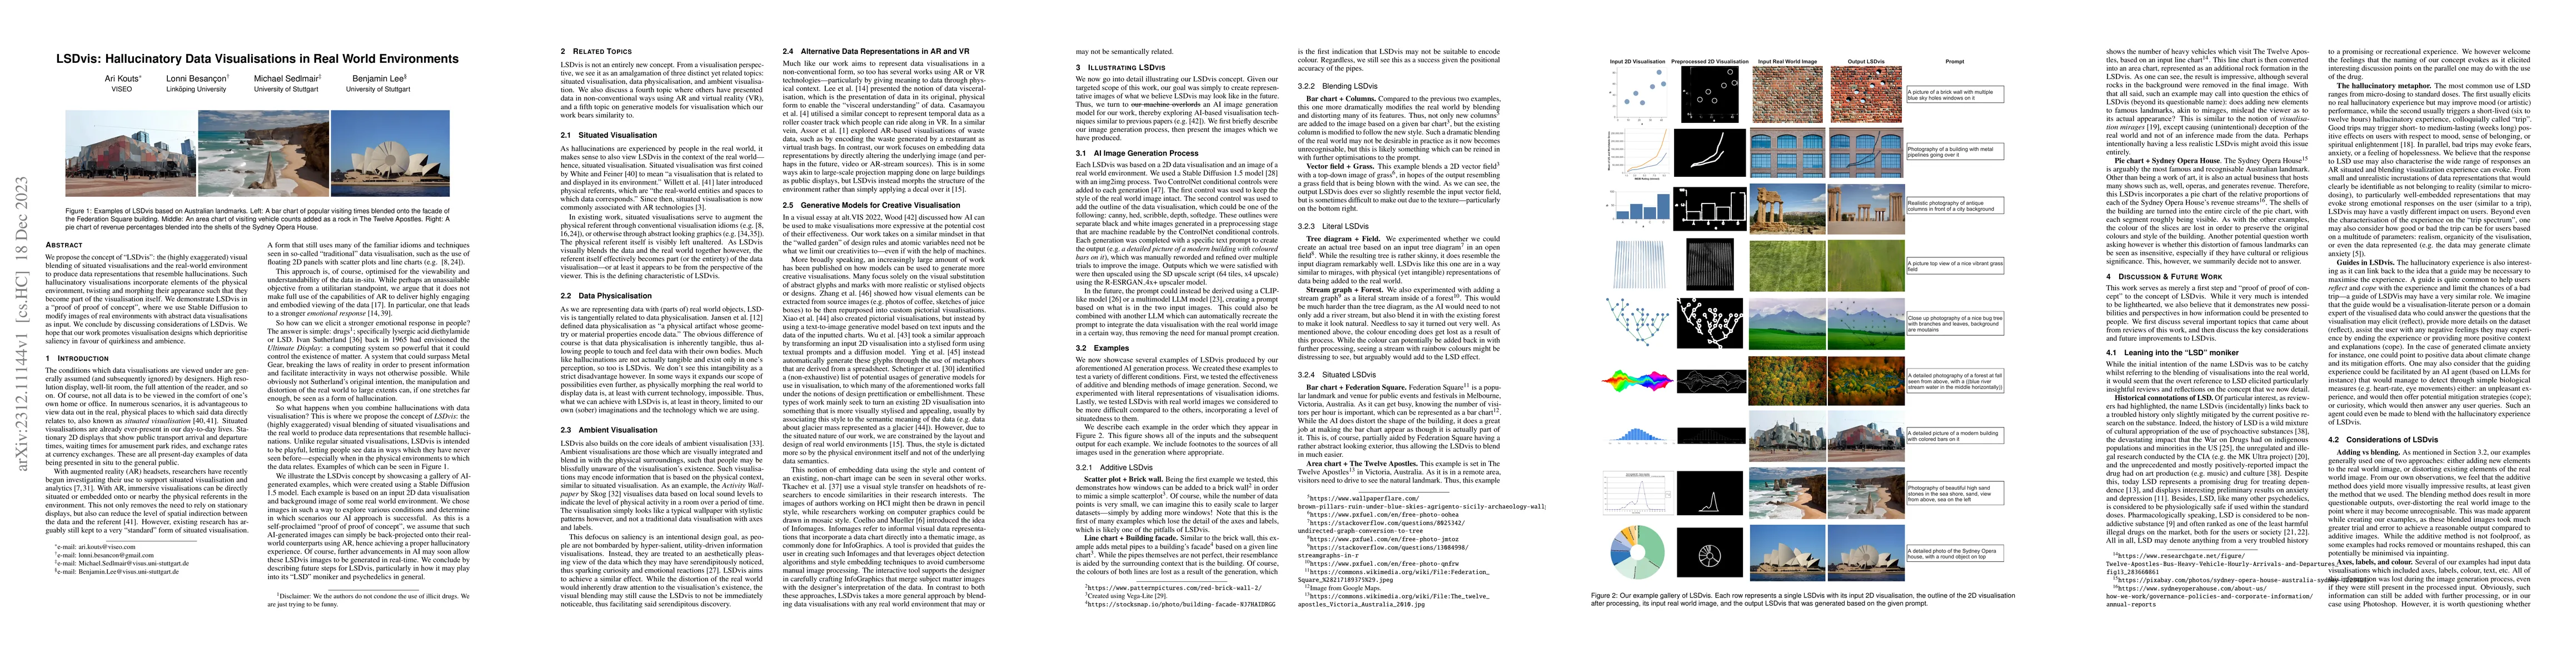
We propose the concept of "LSDvis": the (highly exaggerated) visual blending of situated visualisations and the real-world environment to produce data representations that resemble hallucinations. S...
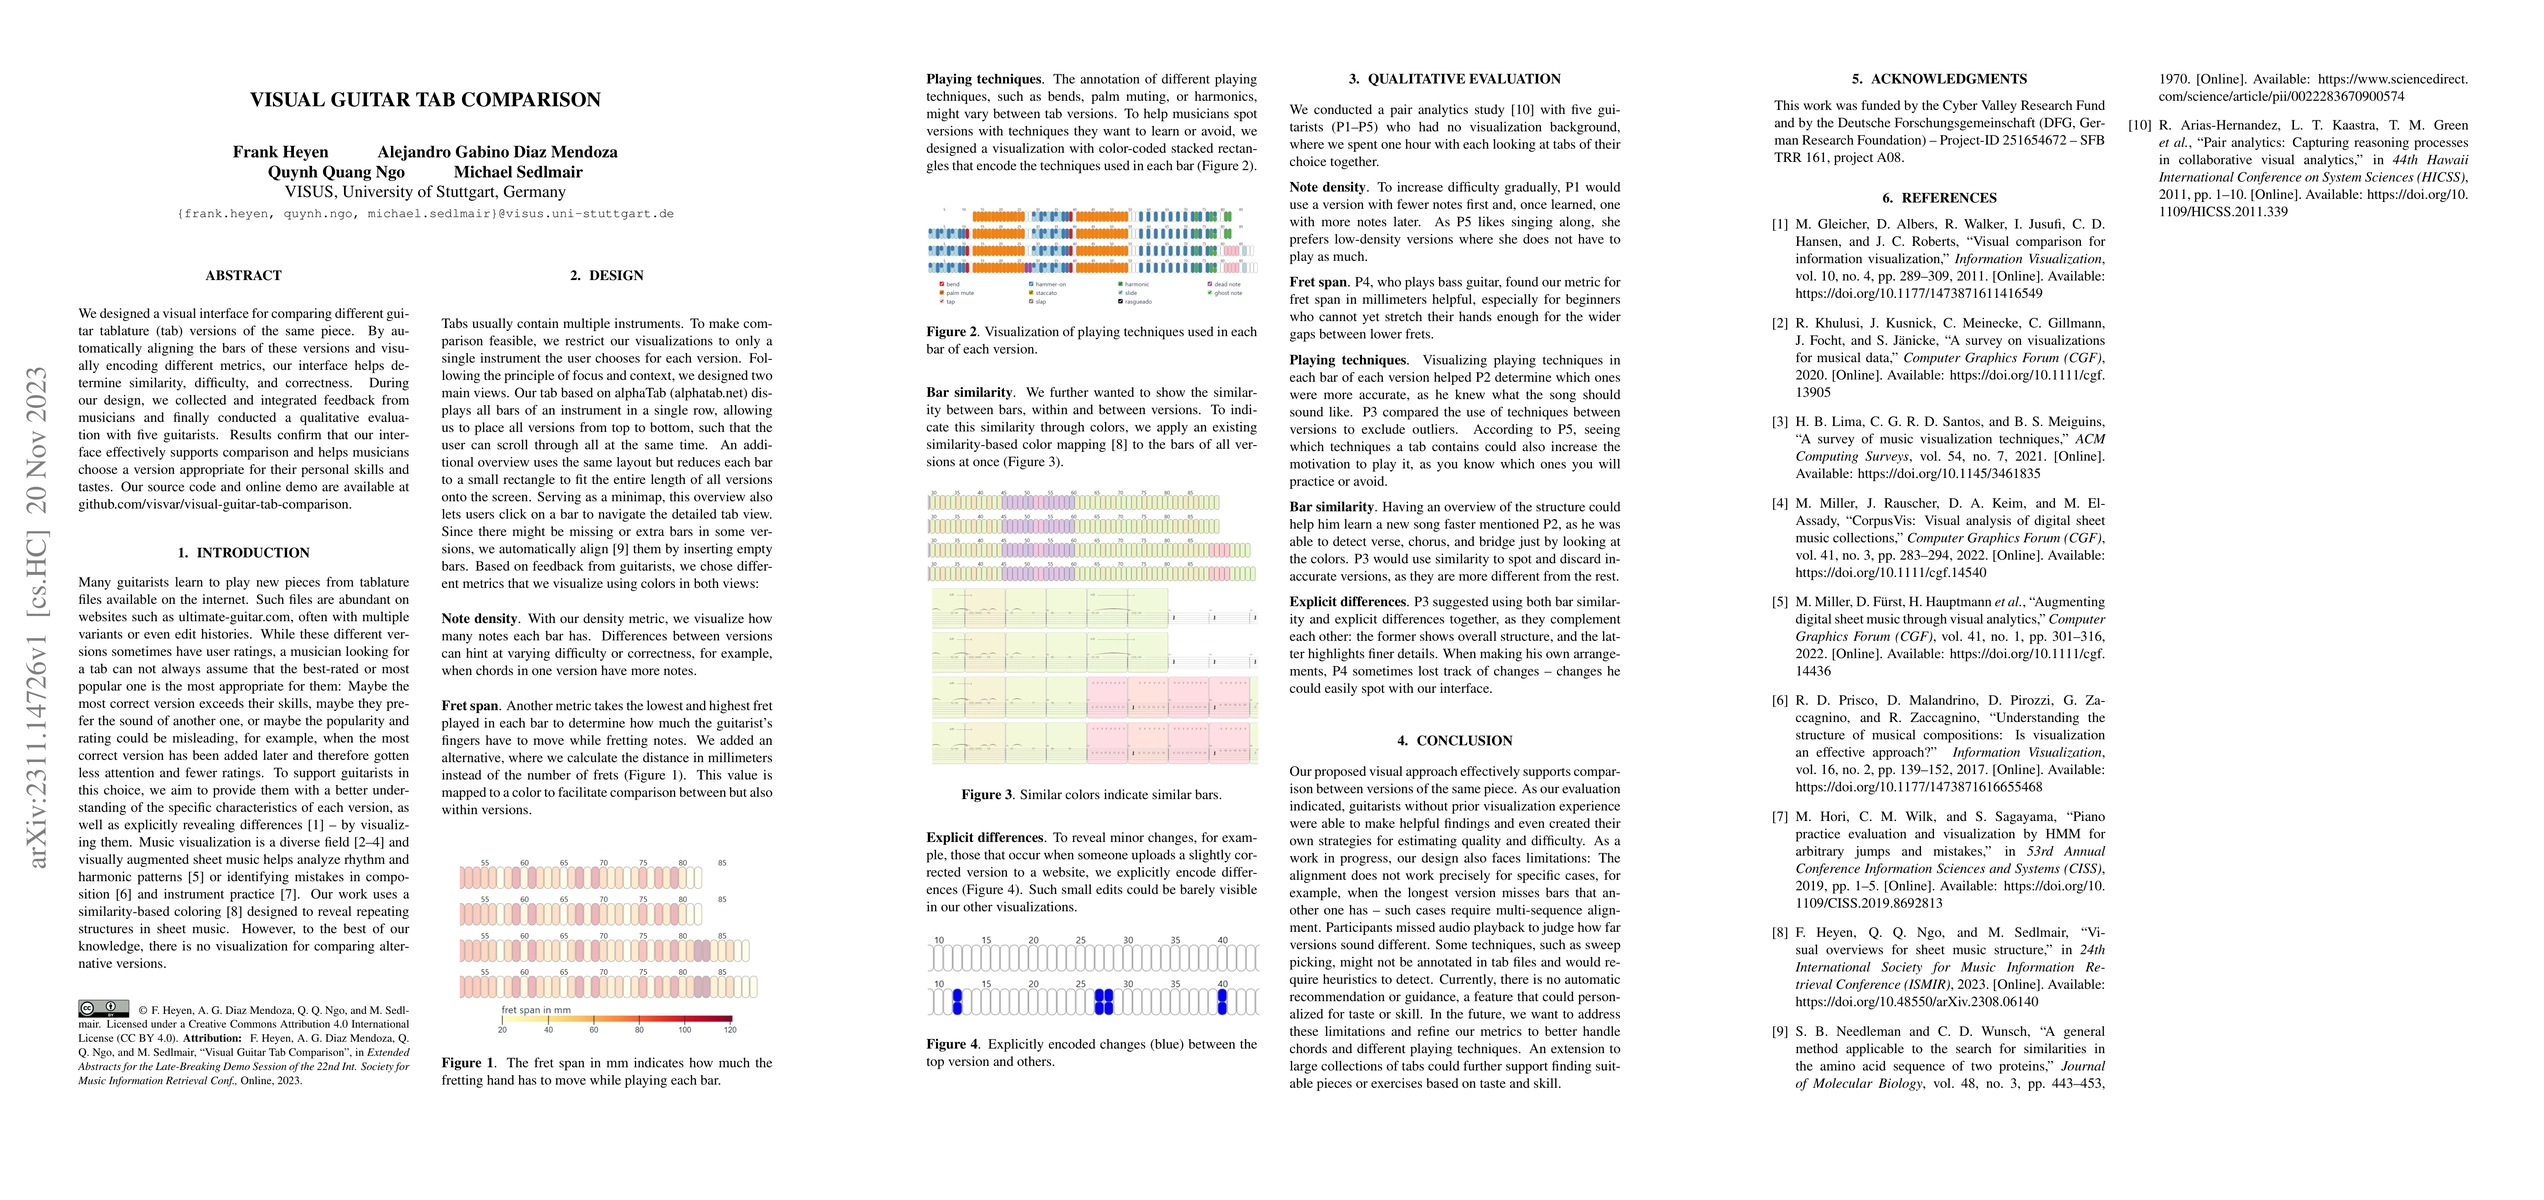
We designed a visual interface for comparing different guitar tablature (tab) versions of the same piece. By automatically aligning the bars of these versions and visually encoding different metrics...
Situated Visualization is an emerging field that unites several areas - visualization, augmented reality, human-computer interaction, and internet-of-things, to support human data activities within ...
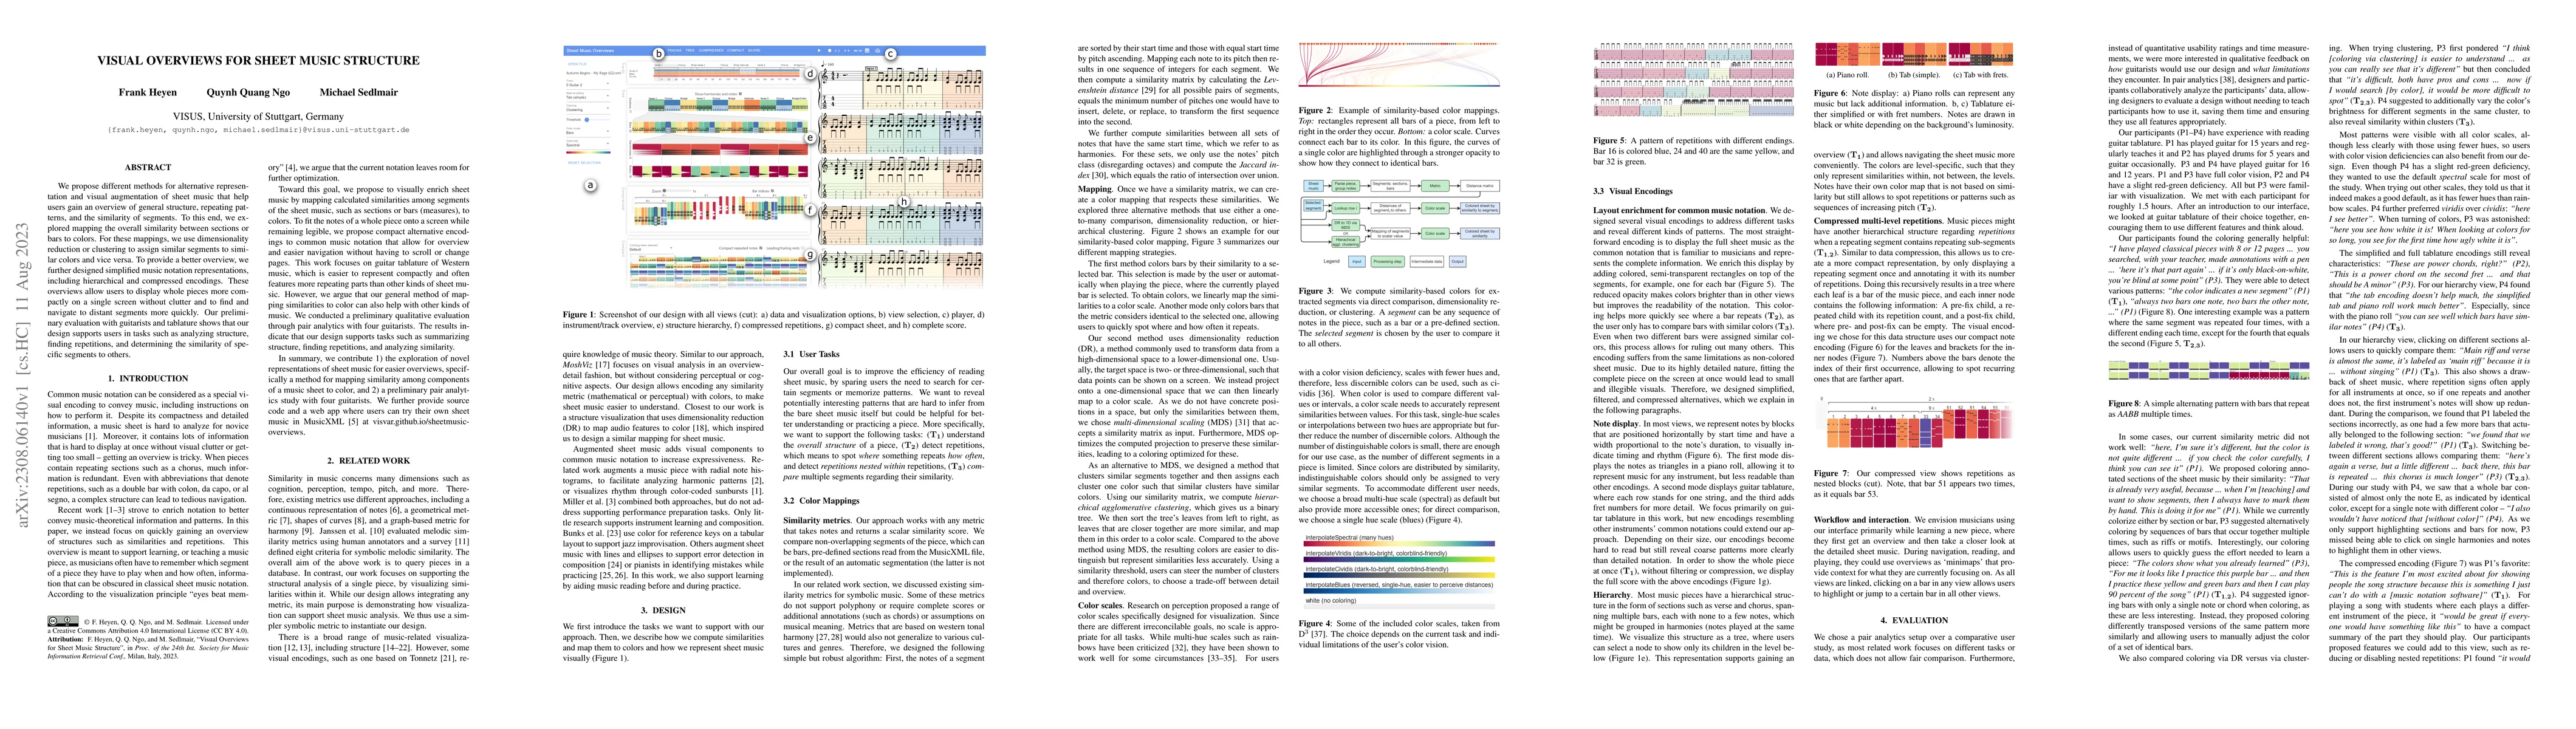
We propose different methods for alternative representation and visual augmentation of sheet music that help users gain an overview of general structure, repeating patterns, and the similarity of se...
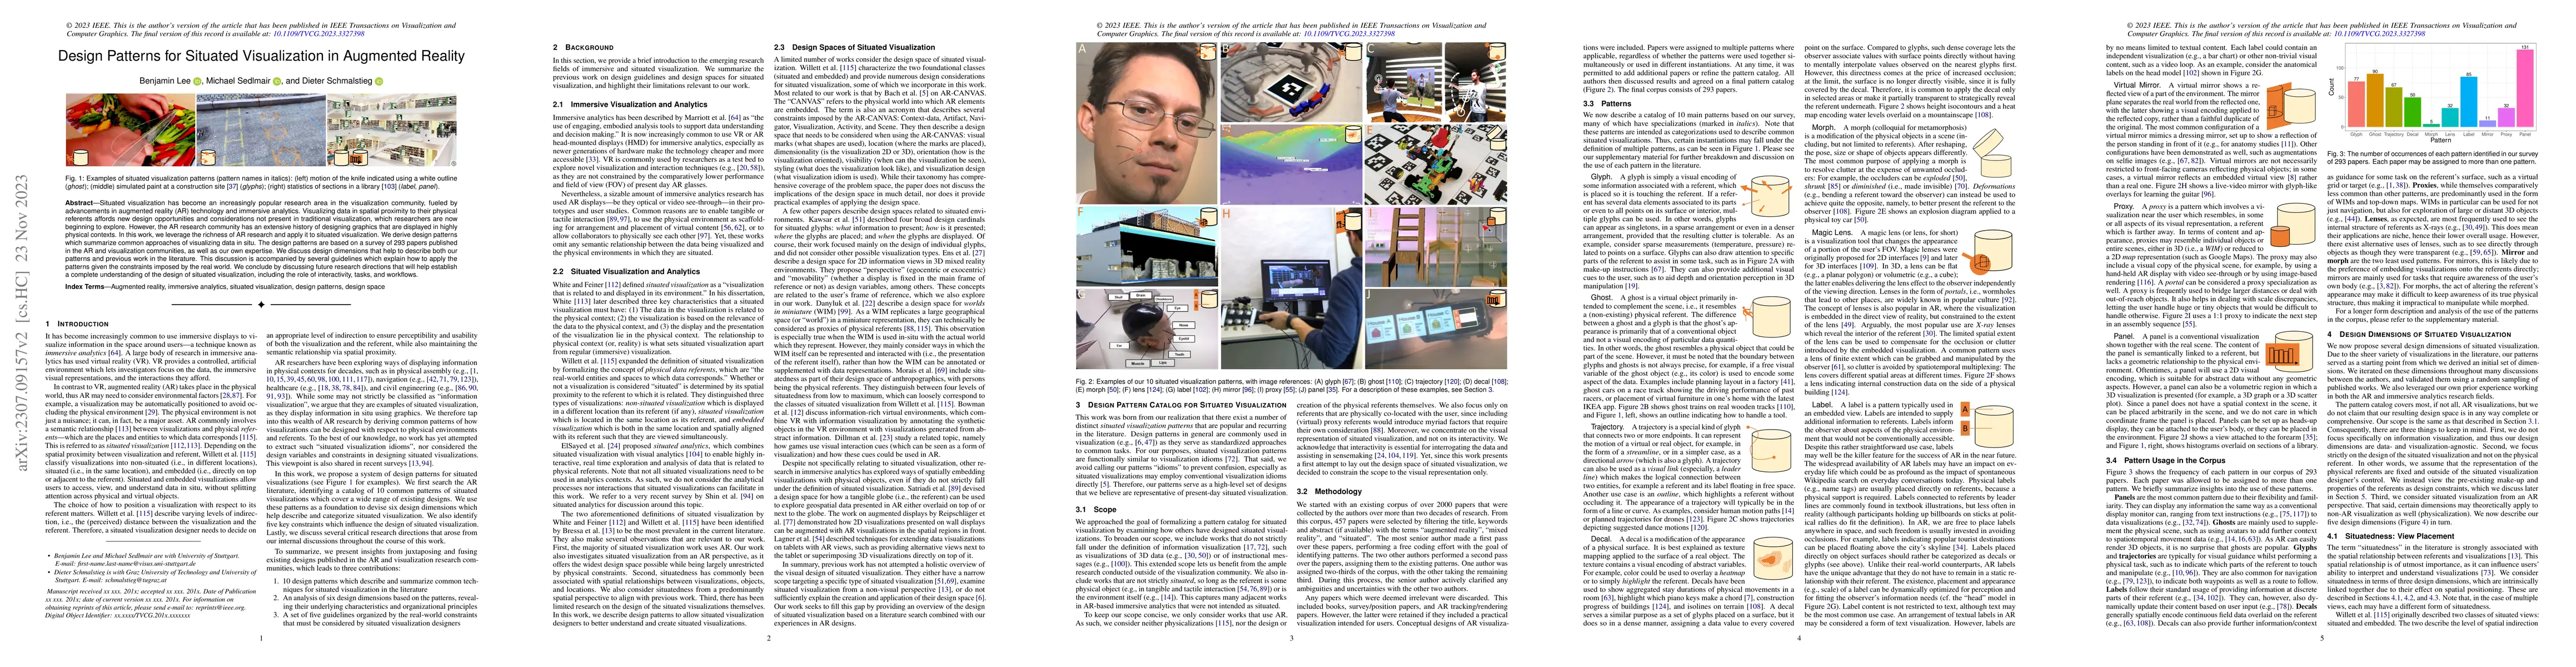
Situated visualization has become an increasingly popular research area in the visualization community, fueled by advancements in augmented reality (AR) technology and immersive analytics. Visualizi...
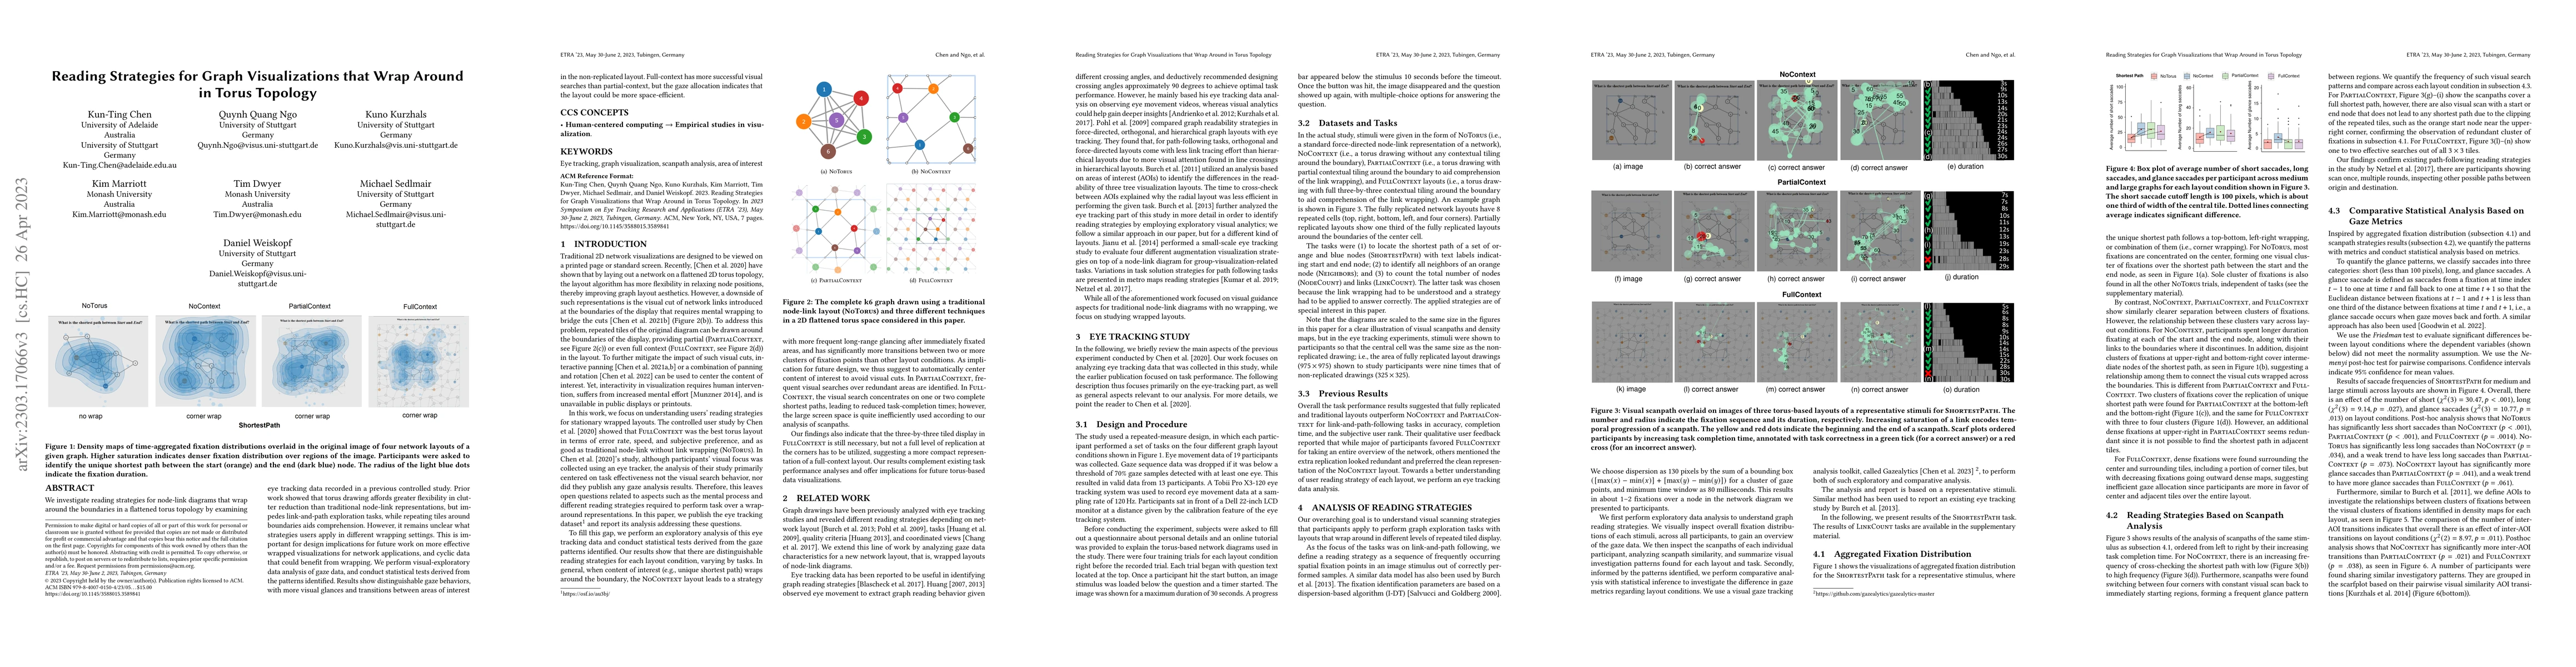
We investigate reading strategies for node-link diagrams that wrap around the boundaries in a flattened torus topology by examining eye tracking data recorded in a previous controlled study. Prior w...
We study the question of how visual analysis can support the comparison of spatio-temporal ensemble data of liquid and gas flow in porous media. To this end, we focus on a case study, in which nine ...
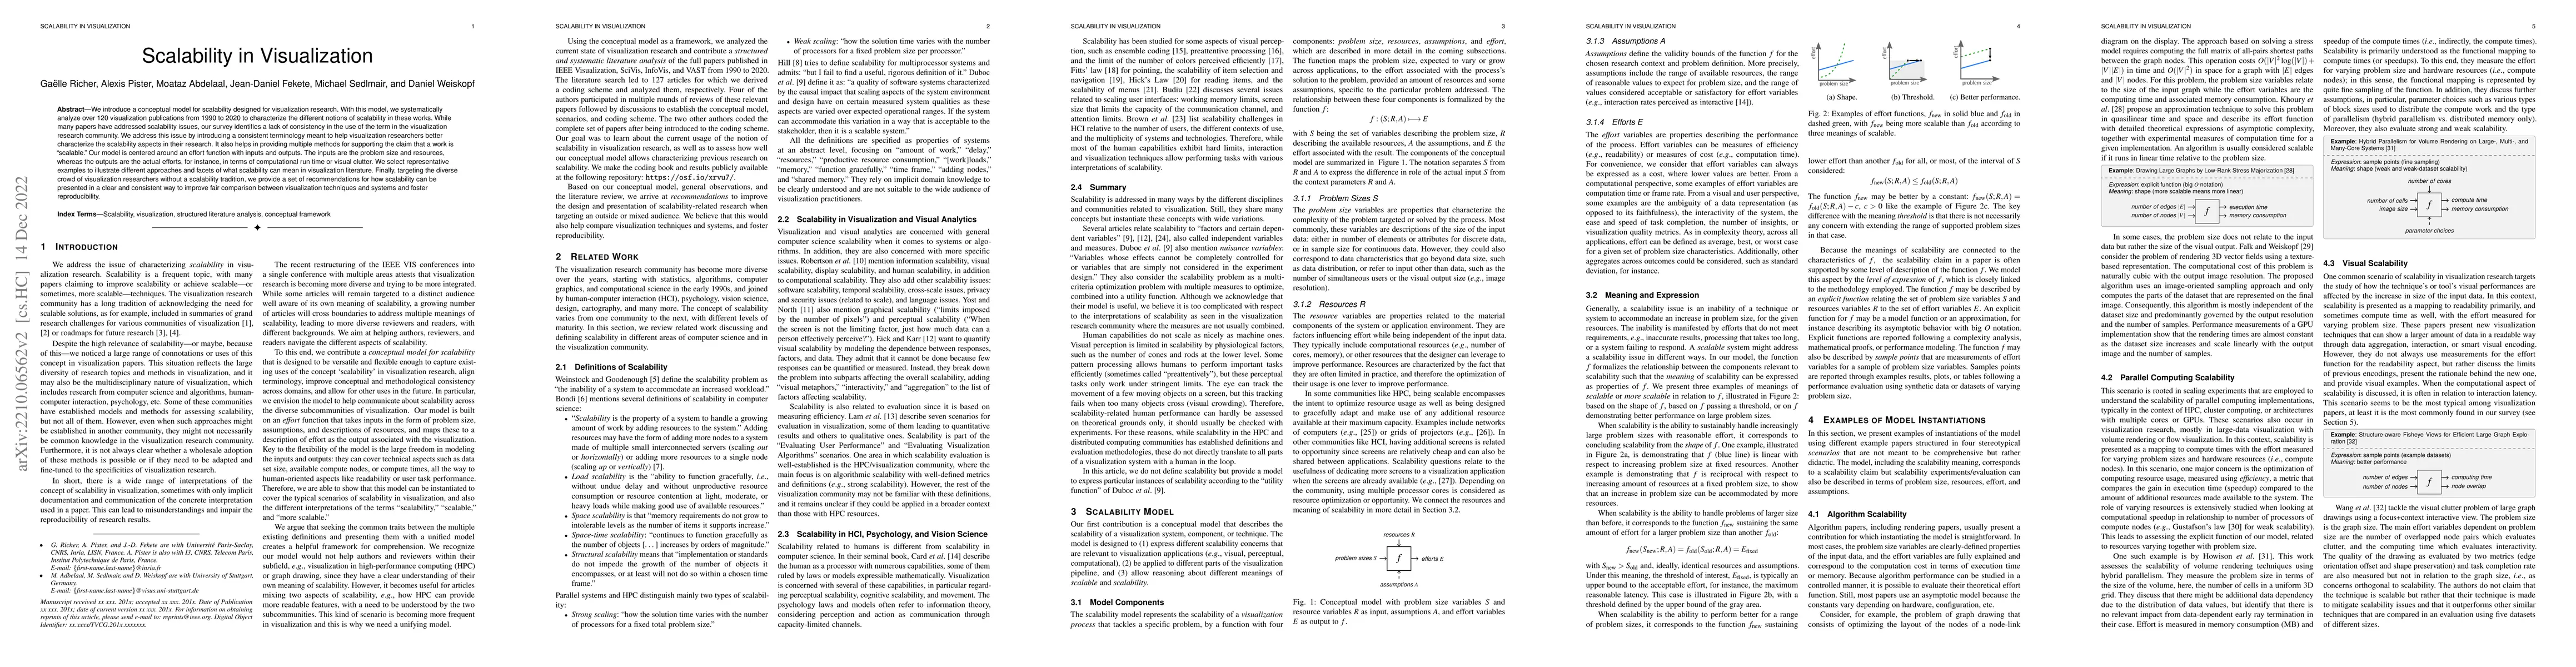
We introduce a conceptual model for scalability designed for visualization research. With this model, we systematically analyze over 120 visualization publications from 1990-2020 to characterize the...
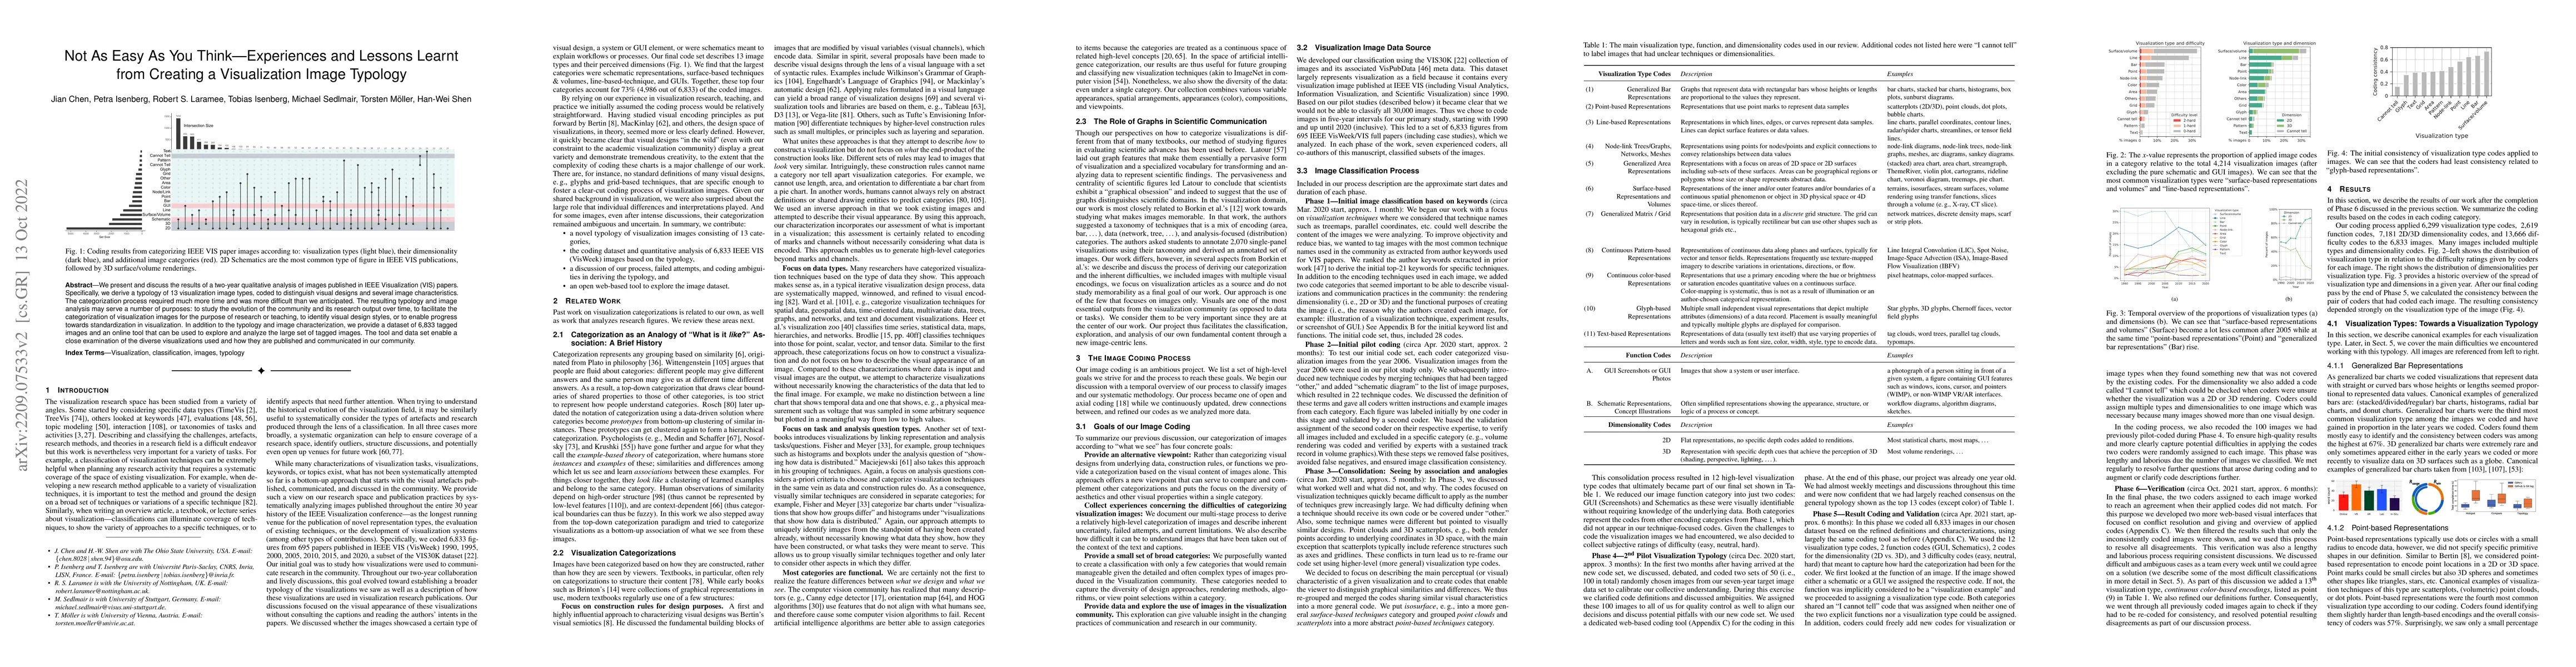
We present and discuss the results of a two-year qualitative analysis of images published in IEEE Visualization (VIS) papers. Specifically, we derive a typology of 13 visualization image types, code...
Inclusion and accessibility in visualization research have gained increasing attention in recent years. However, many challenges still remain to be solved on the road toward a more inclusive, shared...
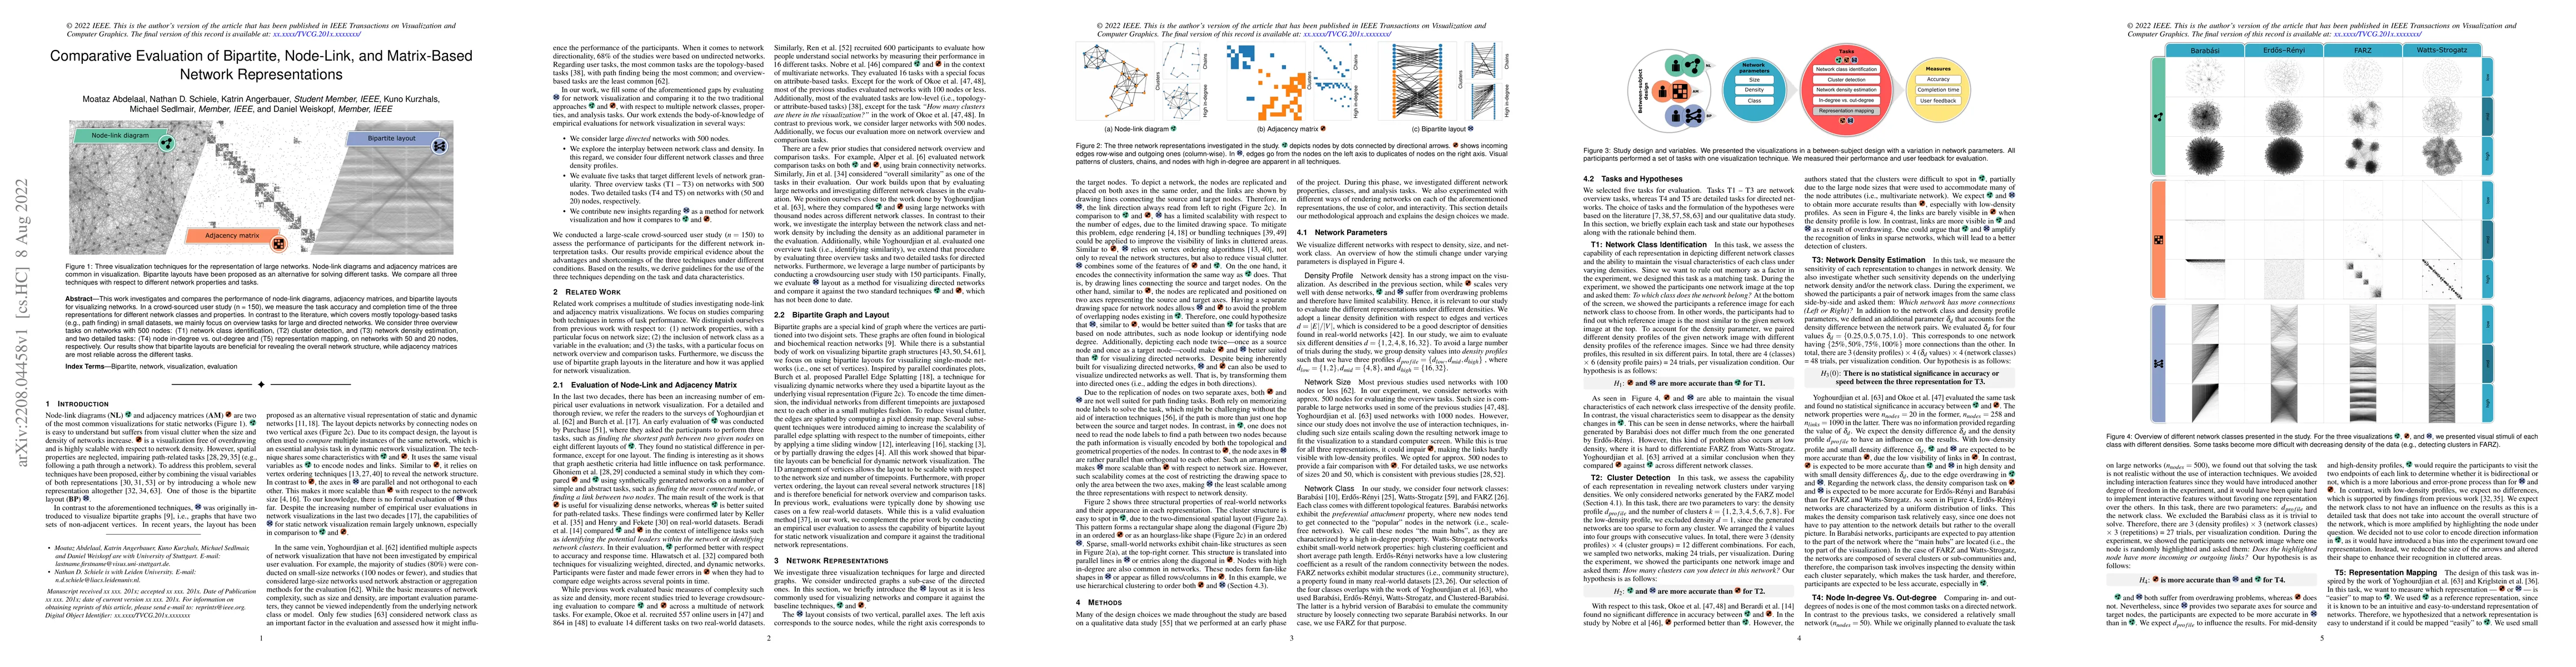
This work investigates and compares the performance of node-link diagrams, adjacency matrices, and bipartite layouts for visualizing networks. In a crowd-sourced user study (n = 150), we measure the...
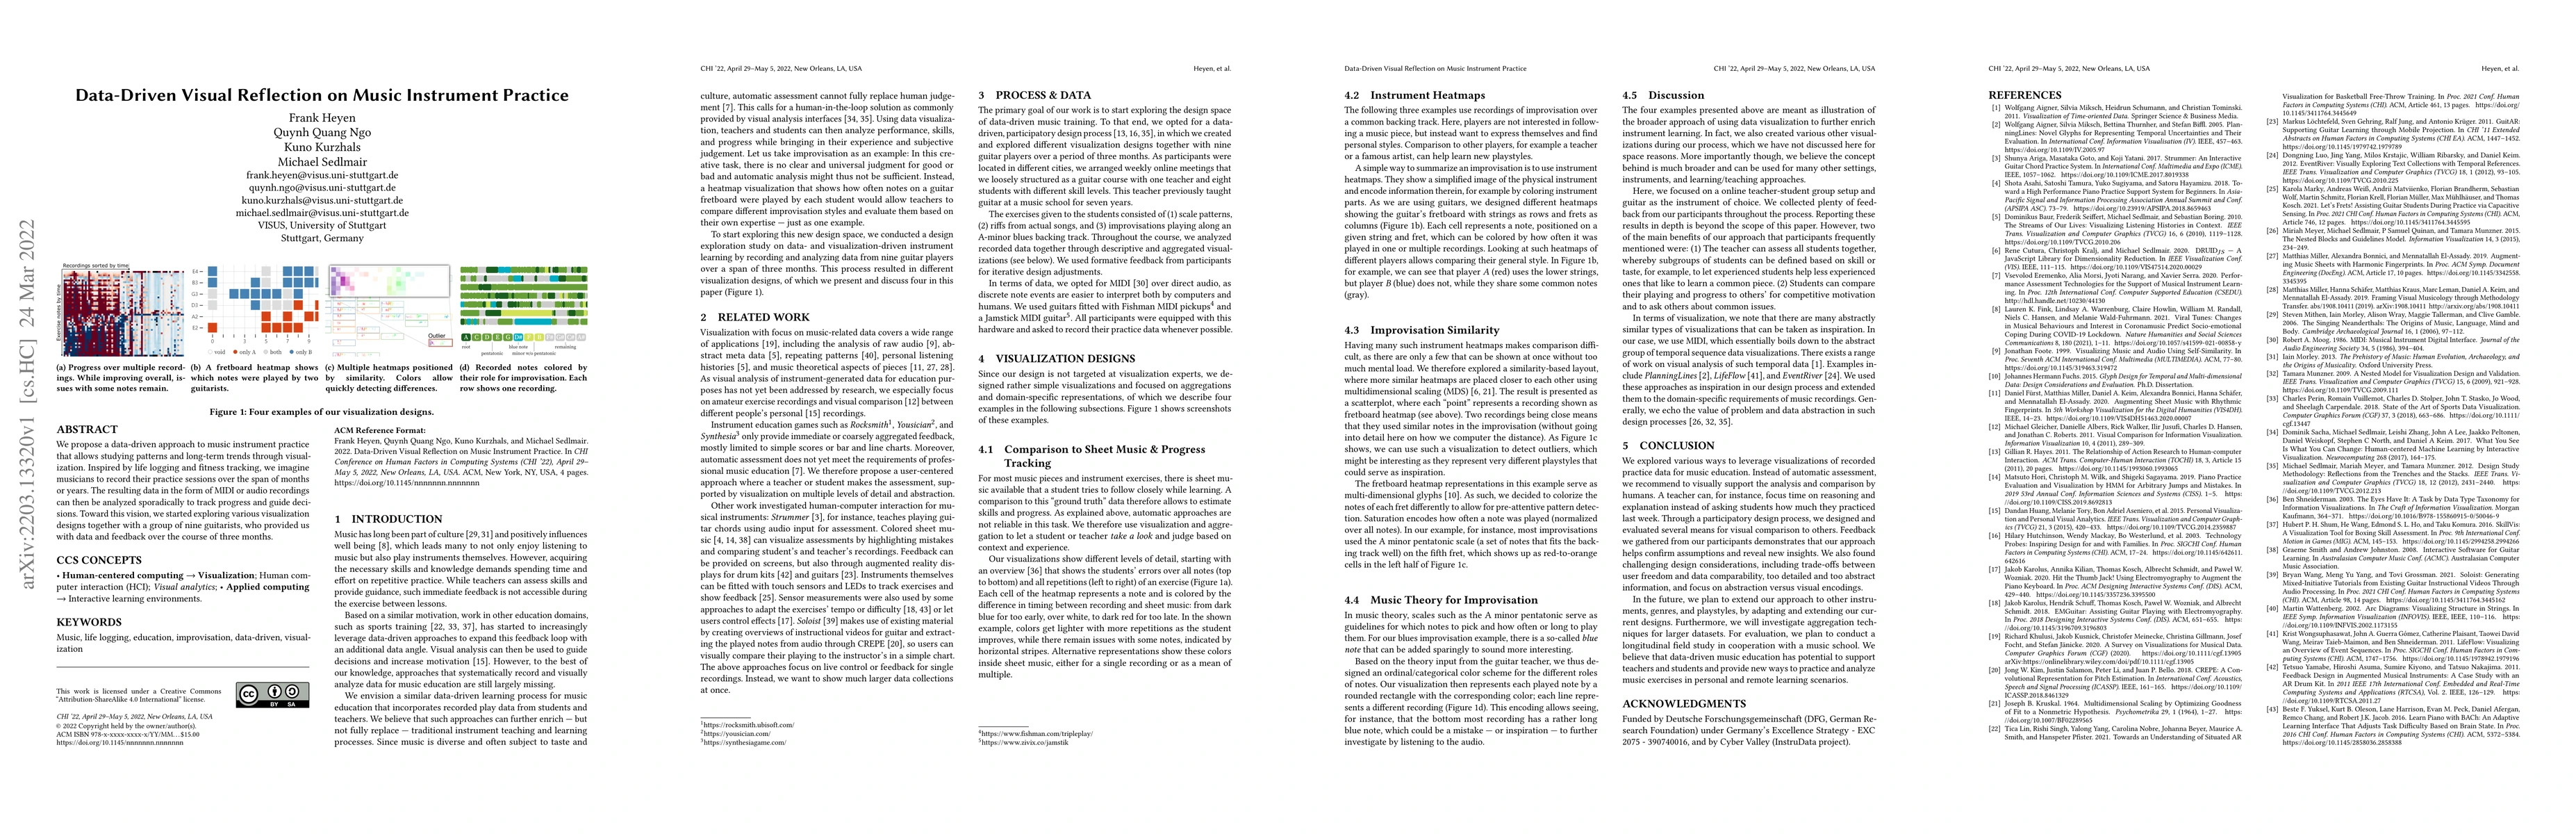
We propose a data-driven approach to music instrument practice that allows studying patterns and long-term trends through visualization. Inspired by life logging and fitness tracking, we imagine mus...
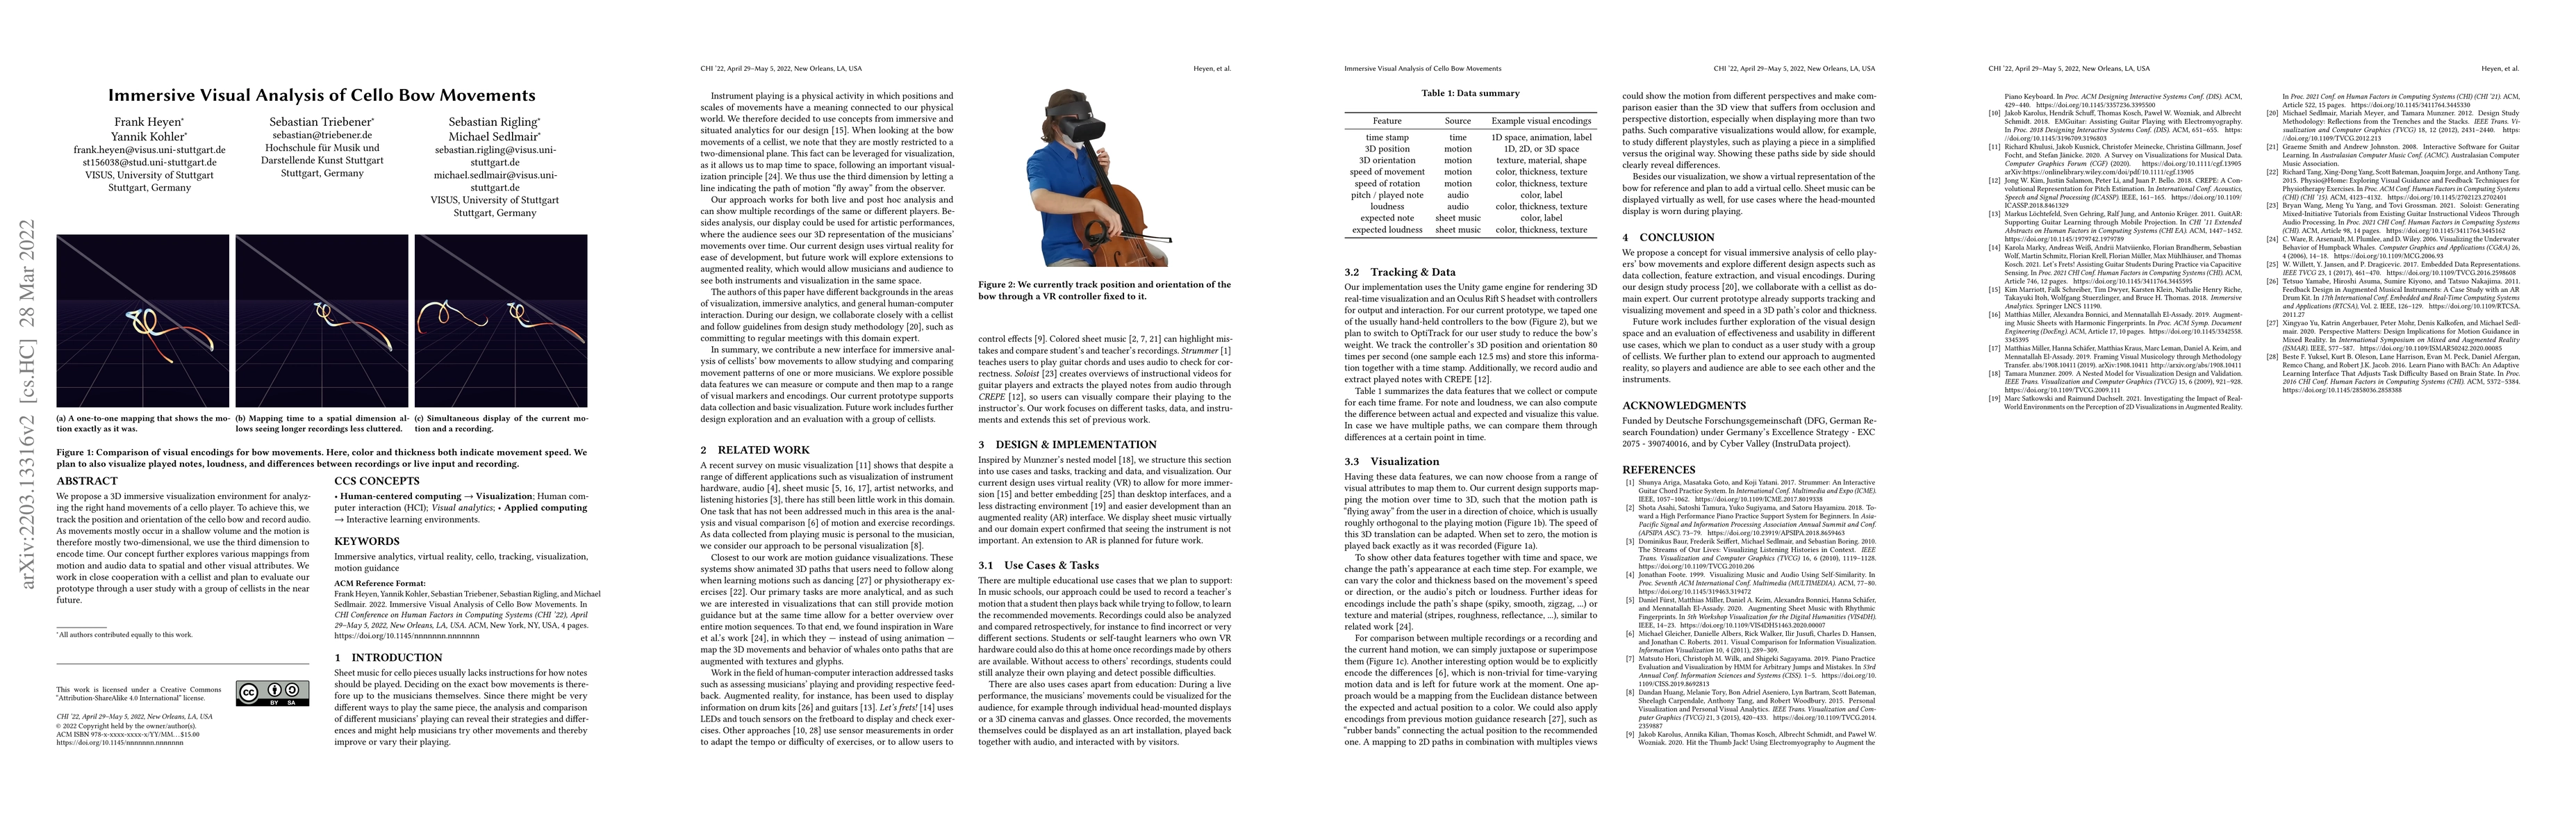
We propose a 3D immersive visualization environment for analyzing the right hand movements of a cello player. To achieve this, we track the position and orientation of the cello bow and record audio...
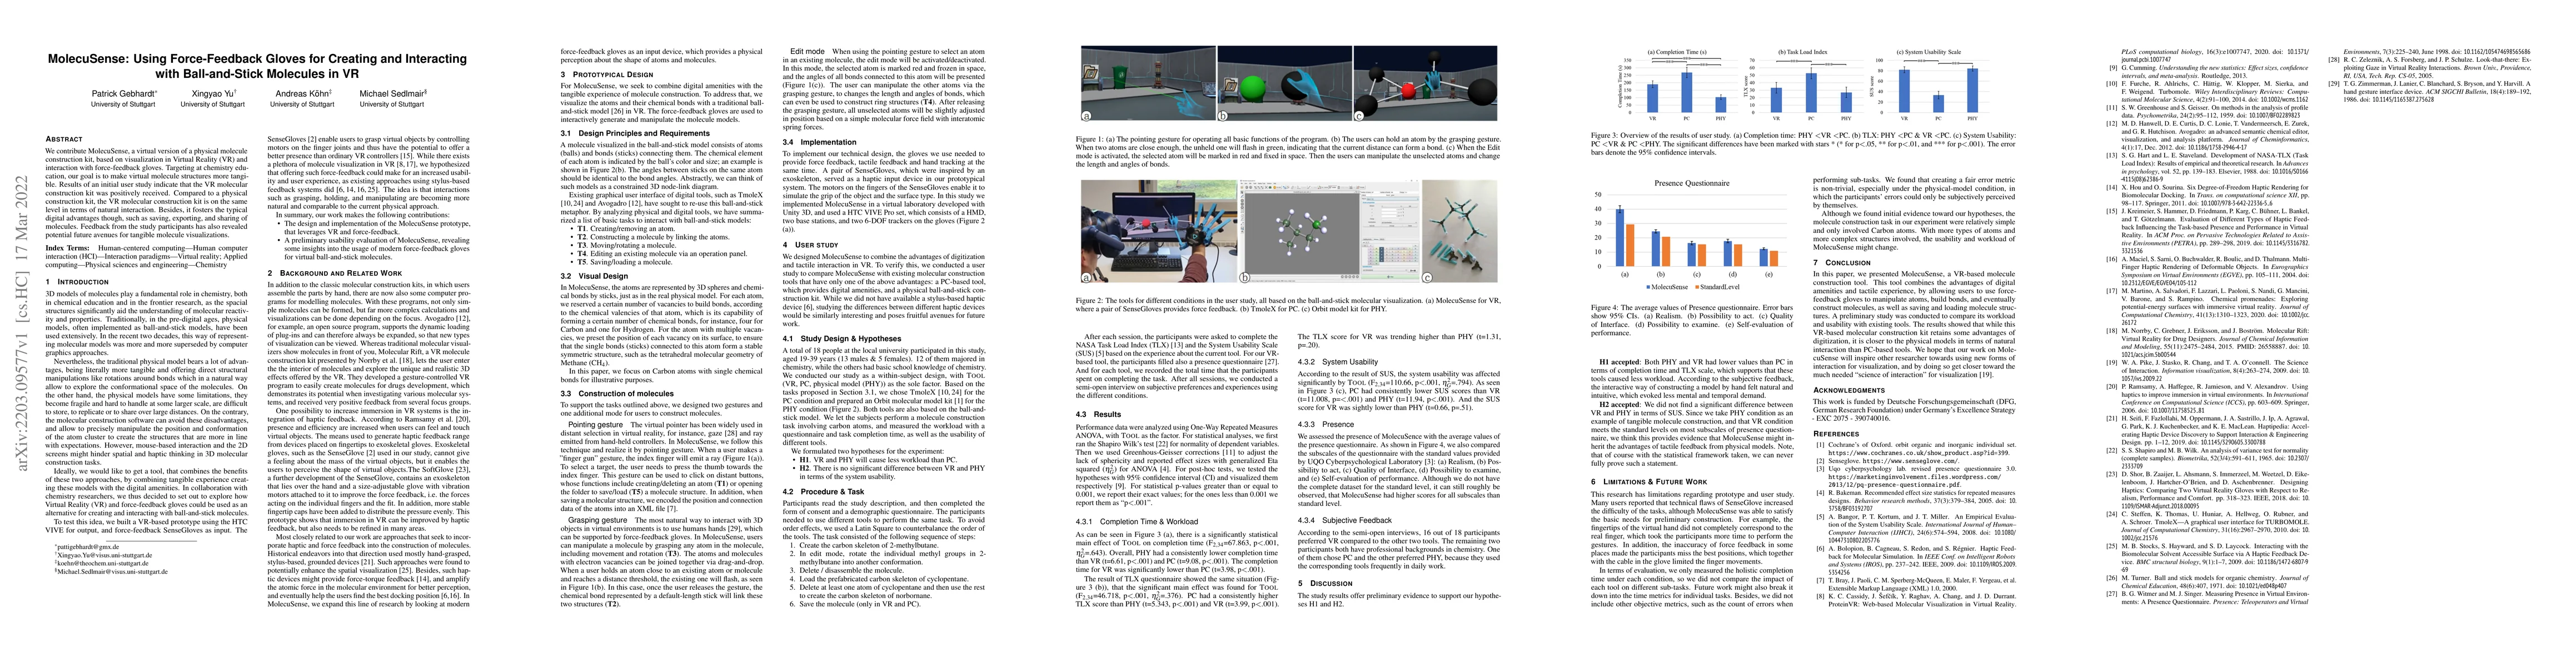
We contribute MolecuSense, a virtual version of a physical molecule construction kit, based on visualization in Virtual Reality (VR) and interaction with force-feedback gloves. Targeting at chemistr...
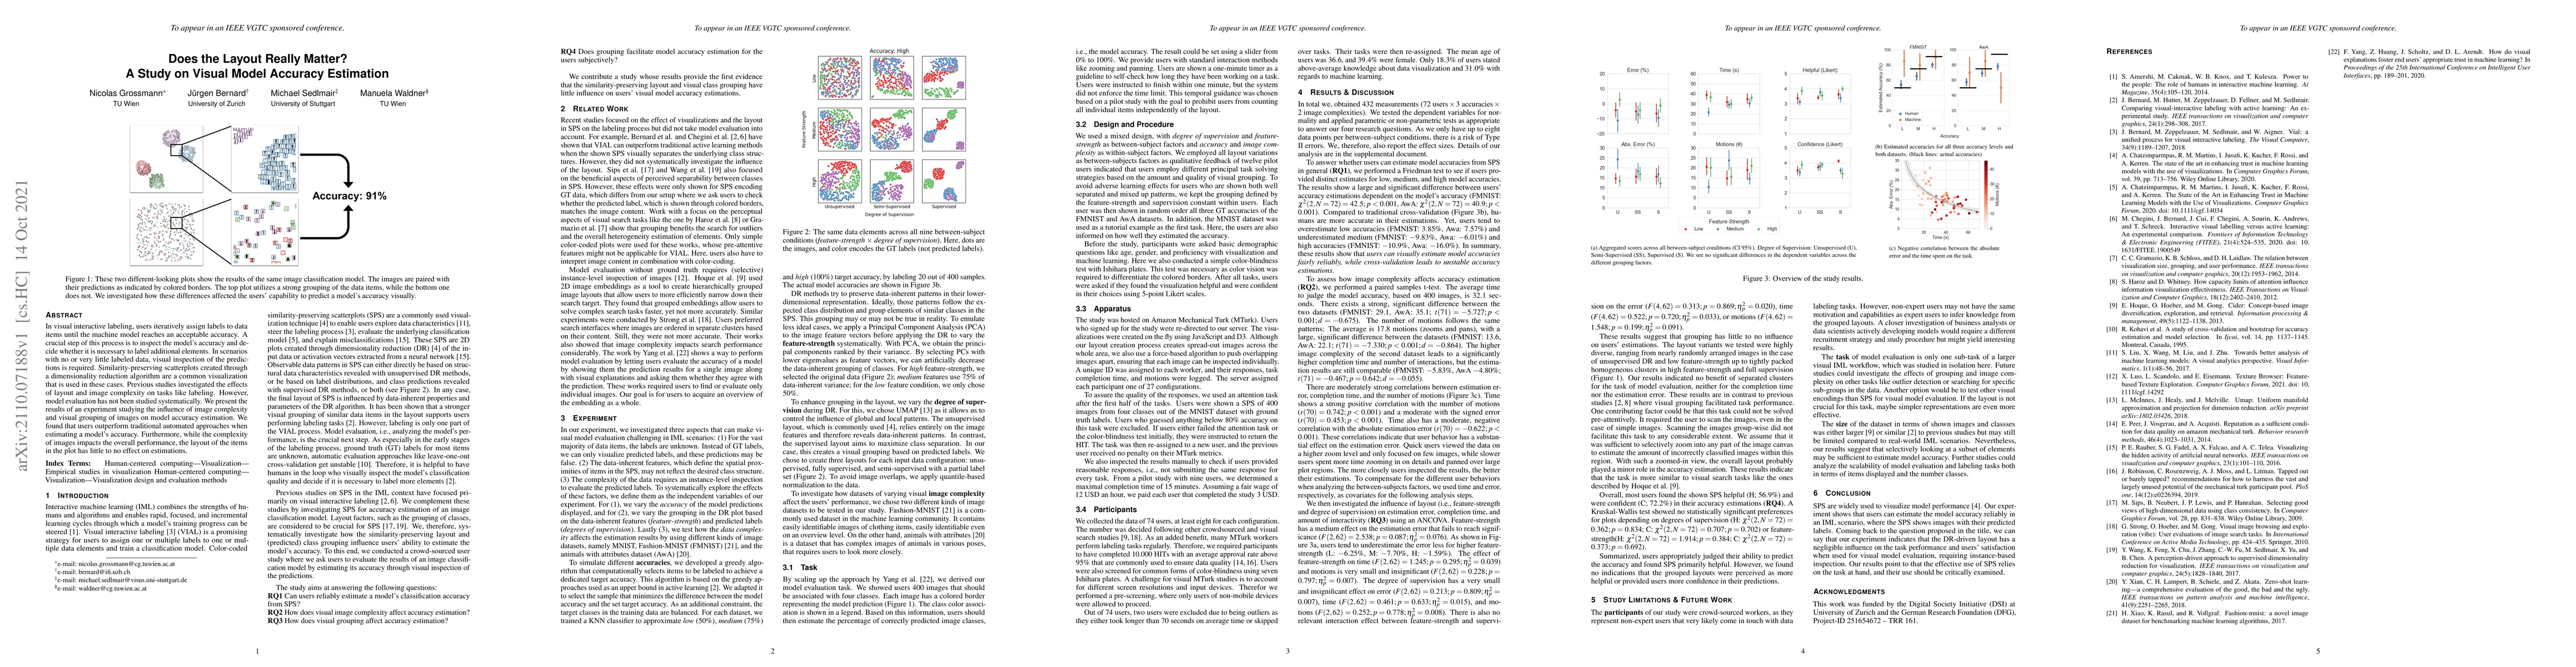
In visual interactive labeling, users iteratively assign labels to data items until the machine model reaches an acceptable accuracy. A crucial step of this process is to inspect the model's accurac...
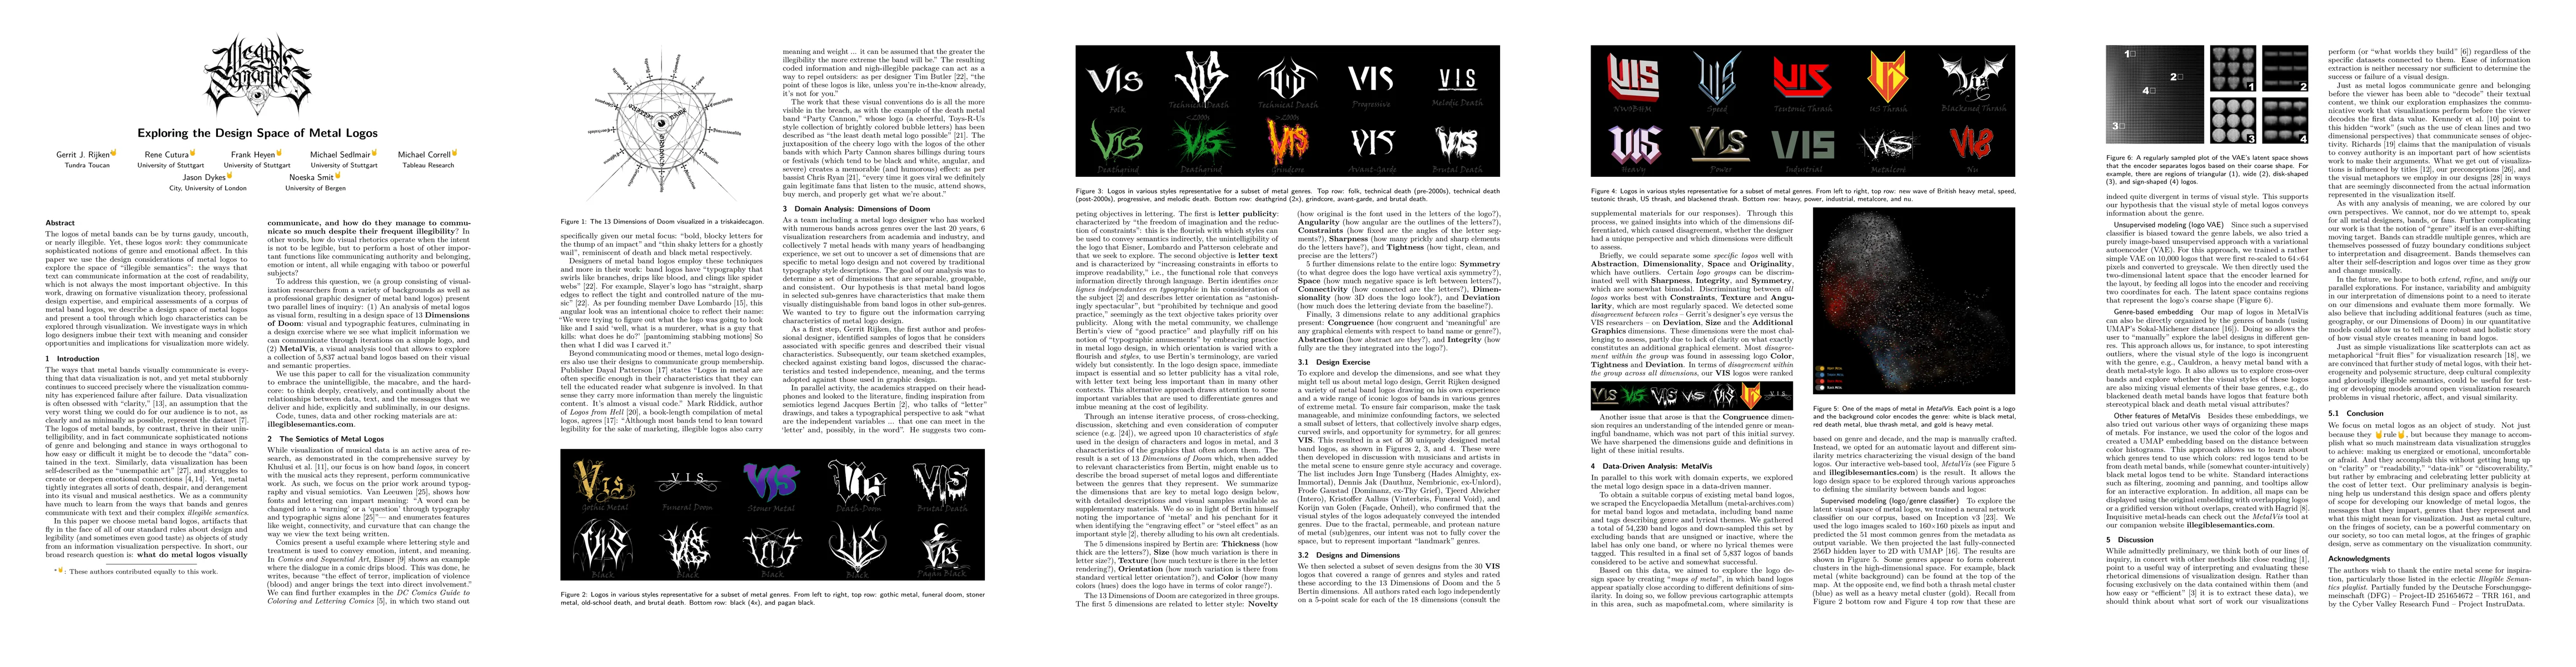
The logos of metal bands can be by turns gaudy, uncouth, or nearly illegible. Yet, these logos work: they communicate sophisticated notions of genre and emotional affect. In this paper we use the de...
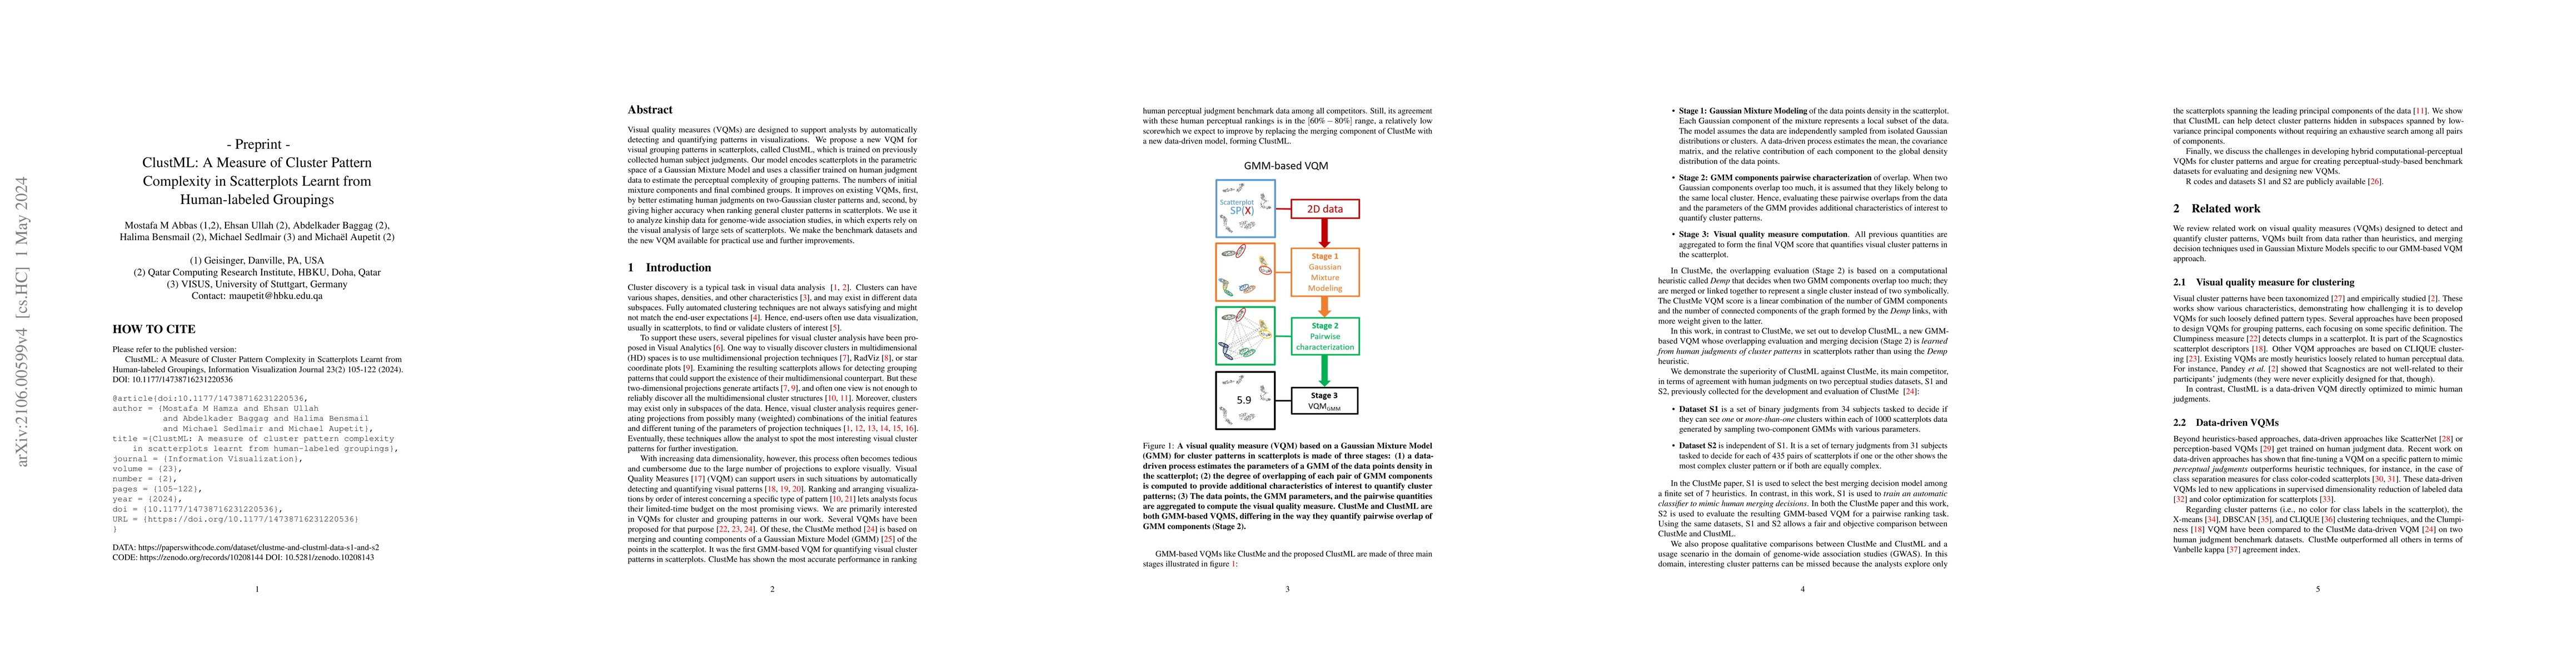
Visual quality measures (VQMs) are designed to support analysts by automatically detecting and quantifying patterns in visualizations. We propose a new VQM for visual grouping patterns in scatterplo...
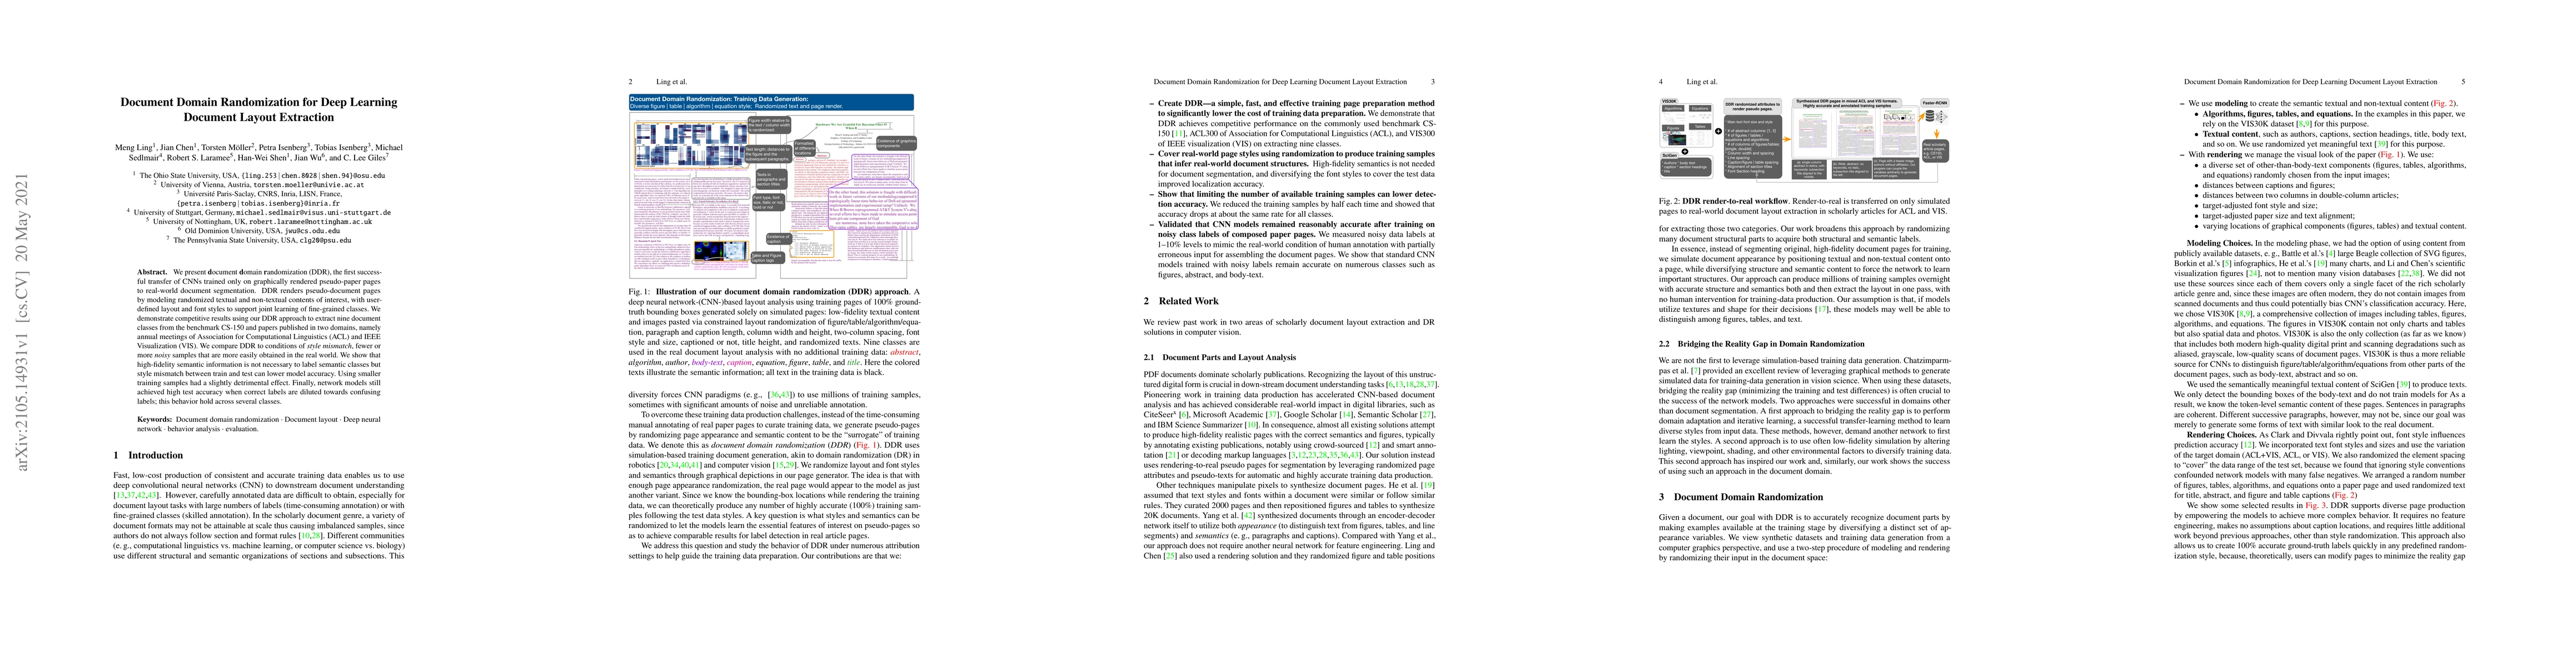
We present document domain randomization (DDR), the first successful transfer of convolutional neural networks (CNNs) trained only on graphically rendered pseudo-paper pages to real-world document s...
A plethora of dimensionality reduction techniques have emerged over the past decades, leaving researchers and analysts with a wide variety of choices for reducing their data, all the more so given s...
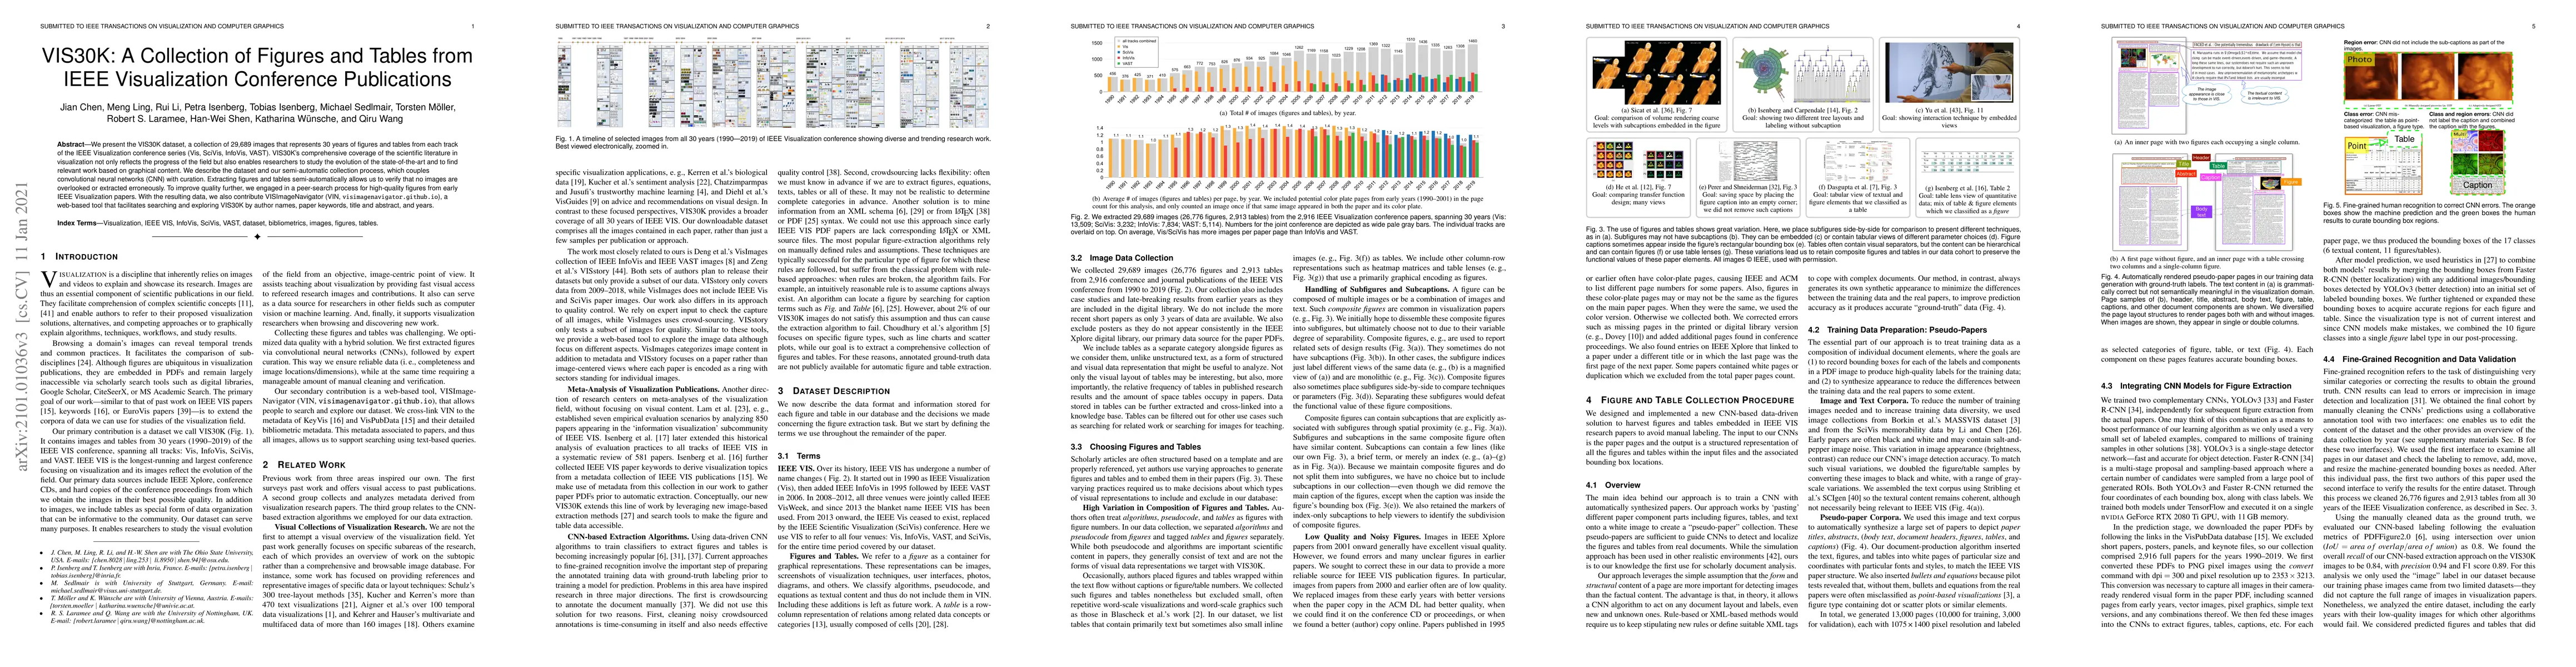
We present the VIS30K dataset, a collection of 29,689 images that represents 30 years of figures and tables from each track of the IEEE Visualization conference series (Vis, SciVis, InfoVis, VAST). ...
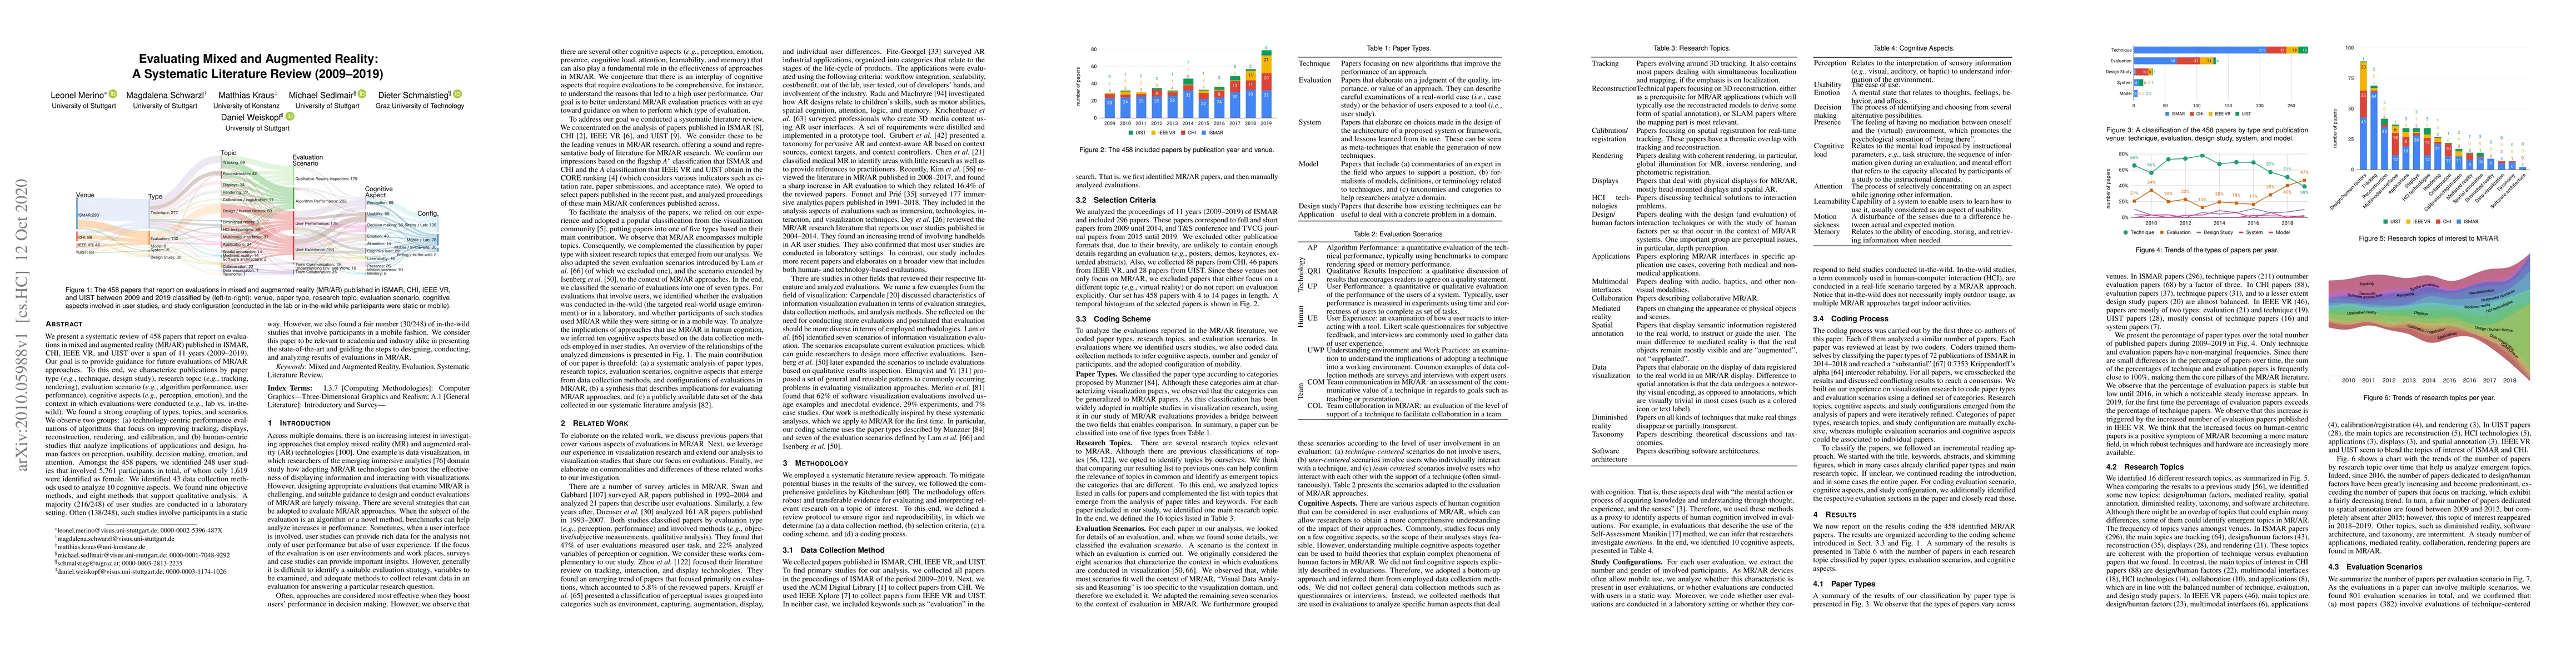
We present a systematic review of 458 papers that report on evaluations in mixed and augmented reality (MR/AR) published in ISMAR, CHI, IEEE VR, and UIST over a span of 11 years (2009-2019). Our goa...
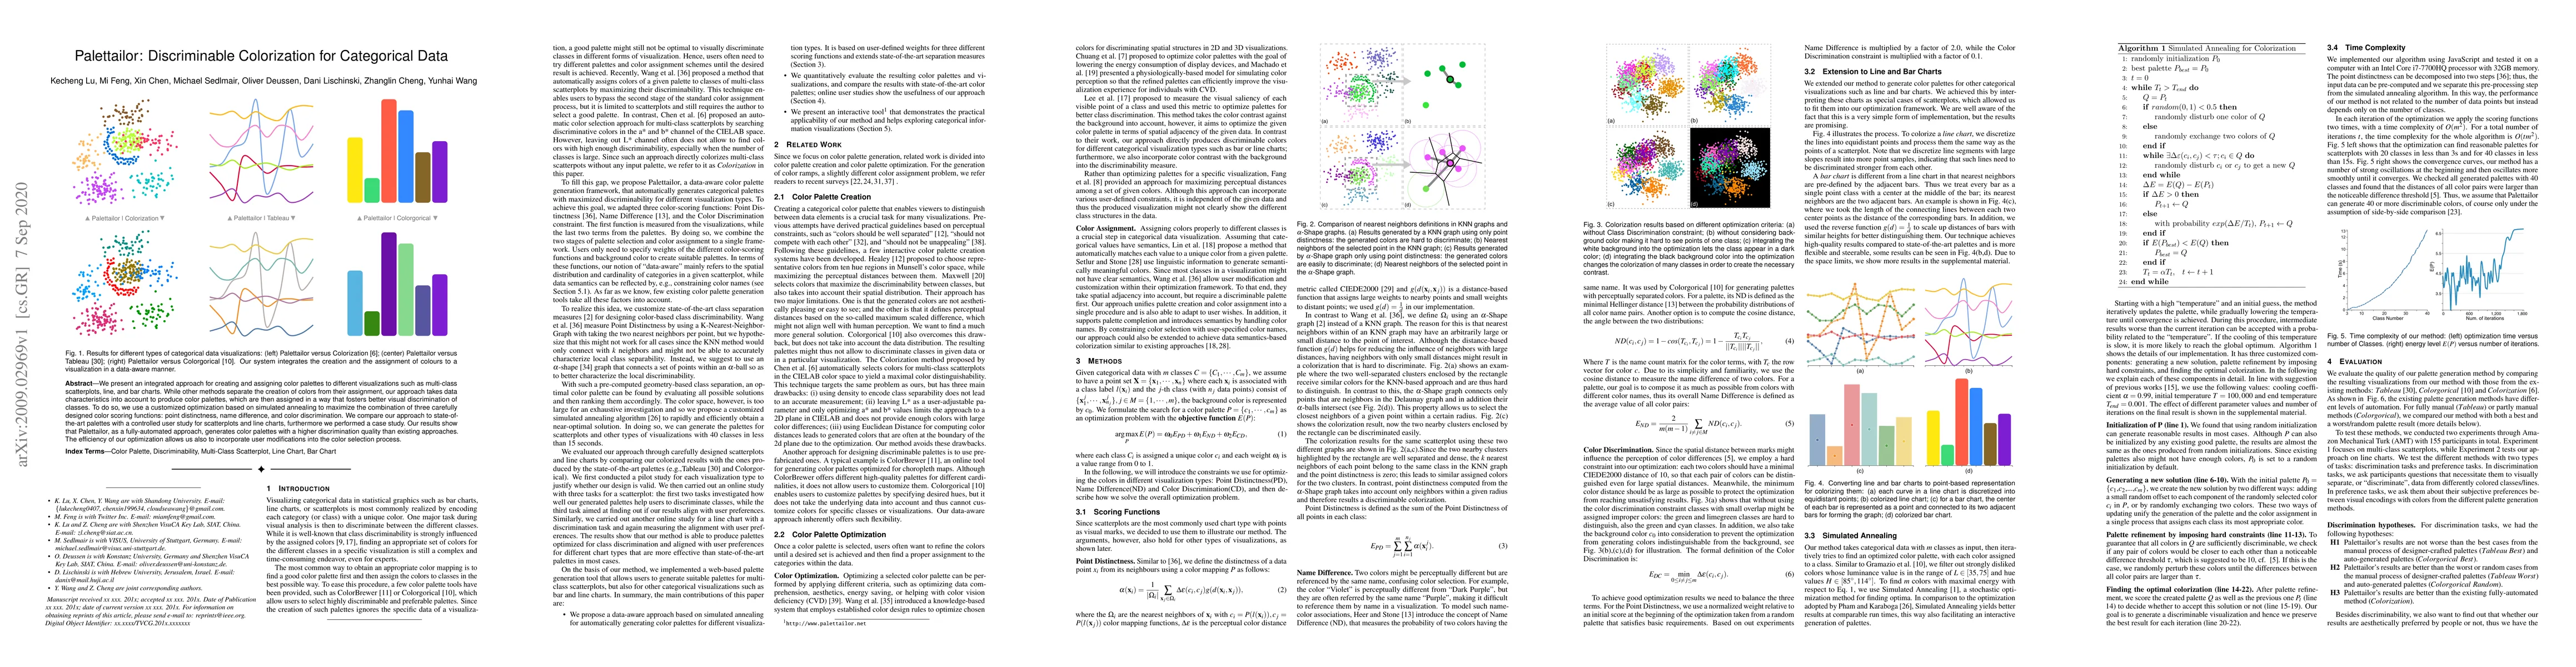
We present an integrated approach for creating and assigning color palettes to different visualizations such as multi-class scatterplots, line, and bar charts. While other methods separate the creat...
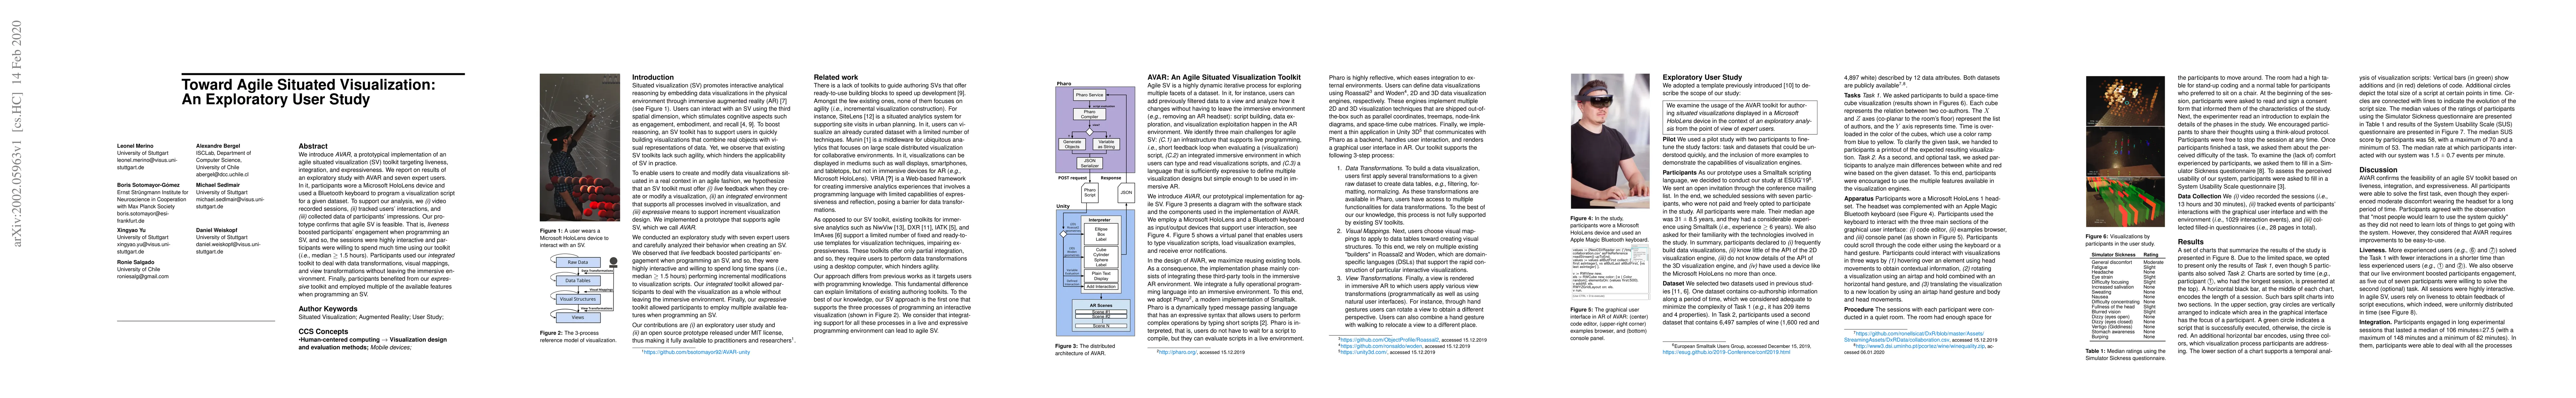
We introduce AVAR, a prototypical implementation of an agile situated visualization (SV) toolkit targeting liveness, integration, and expressiveness. We report on results of an exploratory study wit...
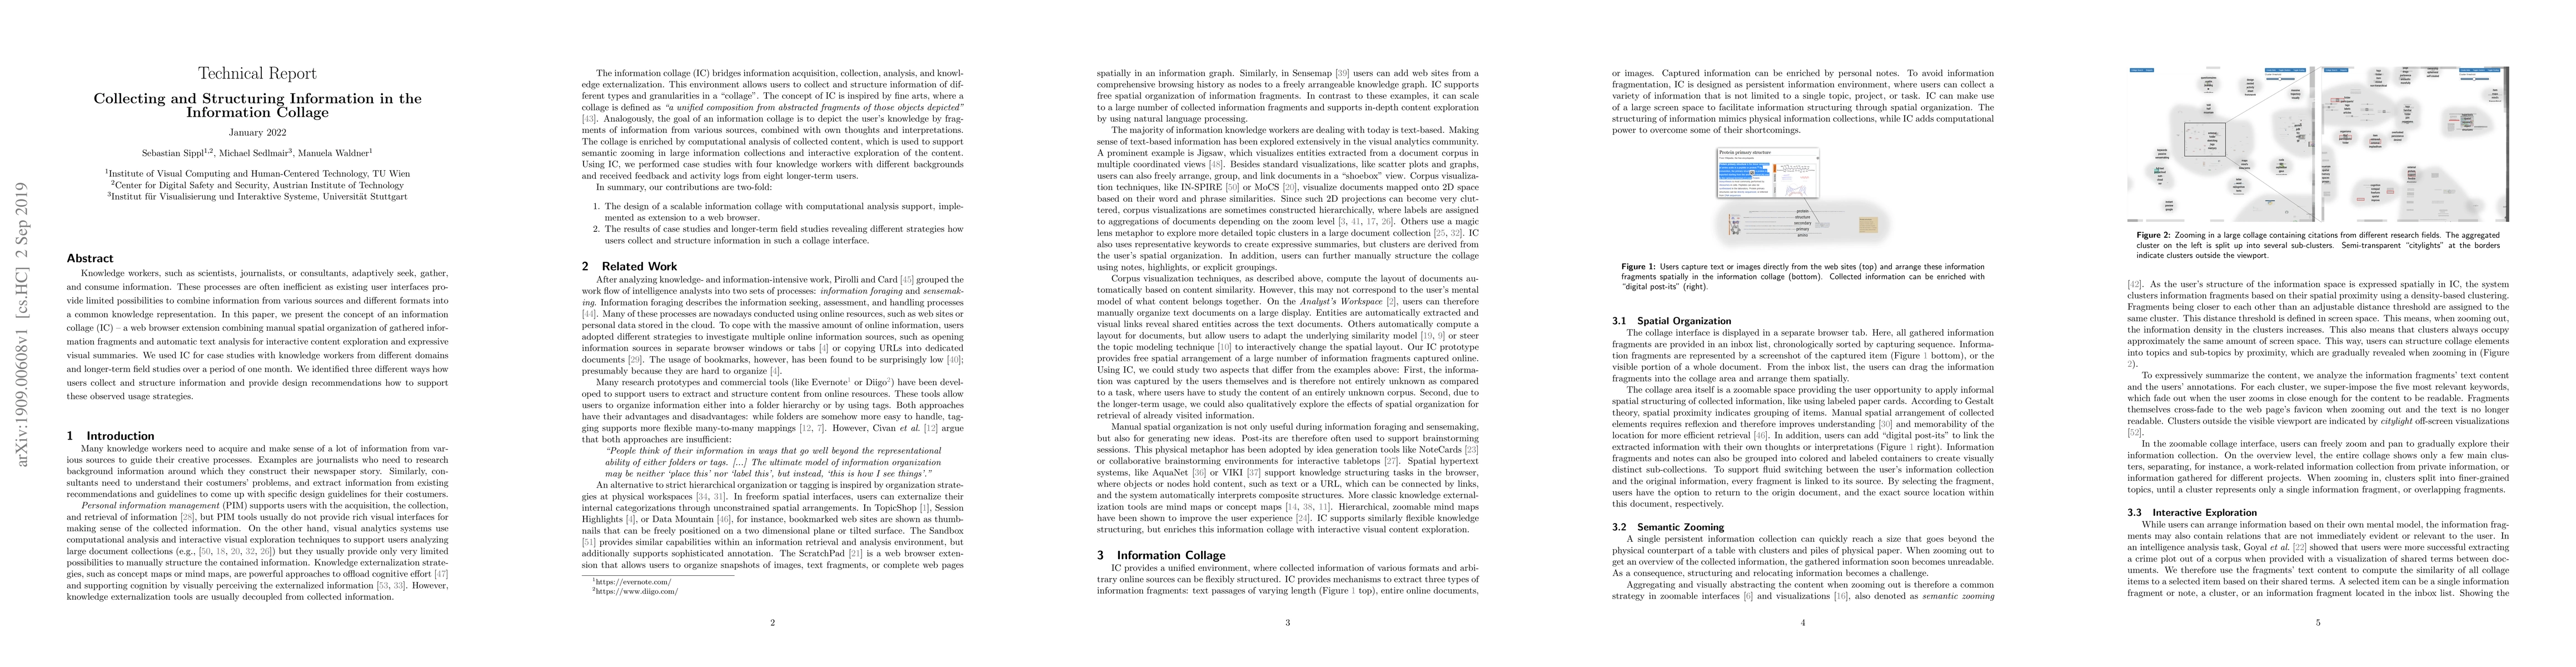
Knowledge workers, such as scientists, journalists, or consultants, adaptively seek, gather, and consume information. These processes are often inefficient as existing user interfaces provide limite...
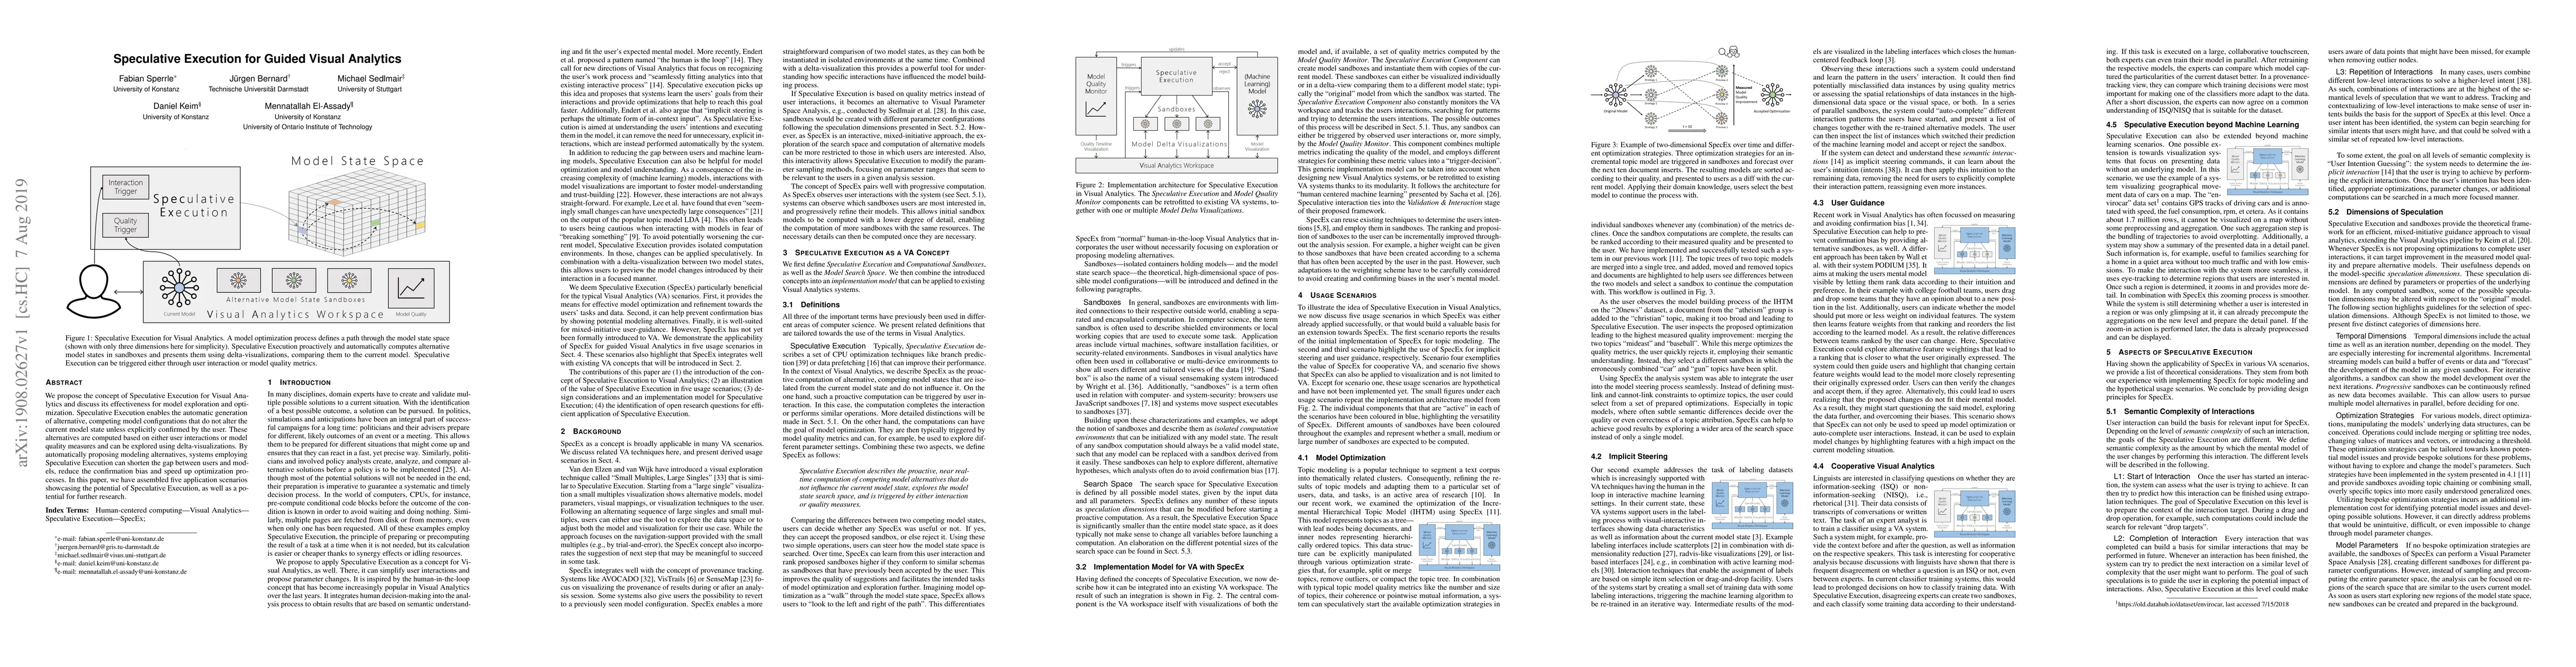
We propose the concept of Speculative Execution for Visual Analytics and discuss its effectiveness for model exploration and optimization. Speculative Execution enables the automatic generation of a...
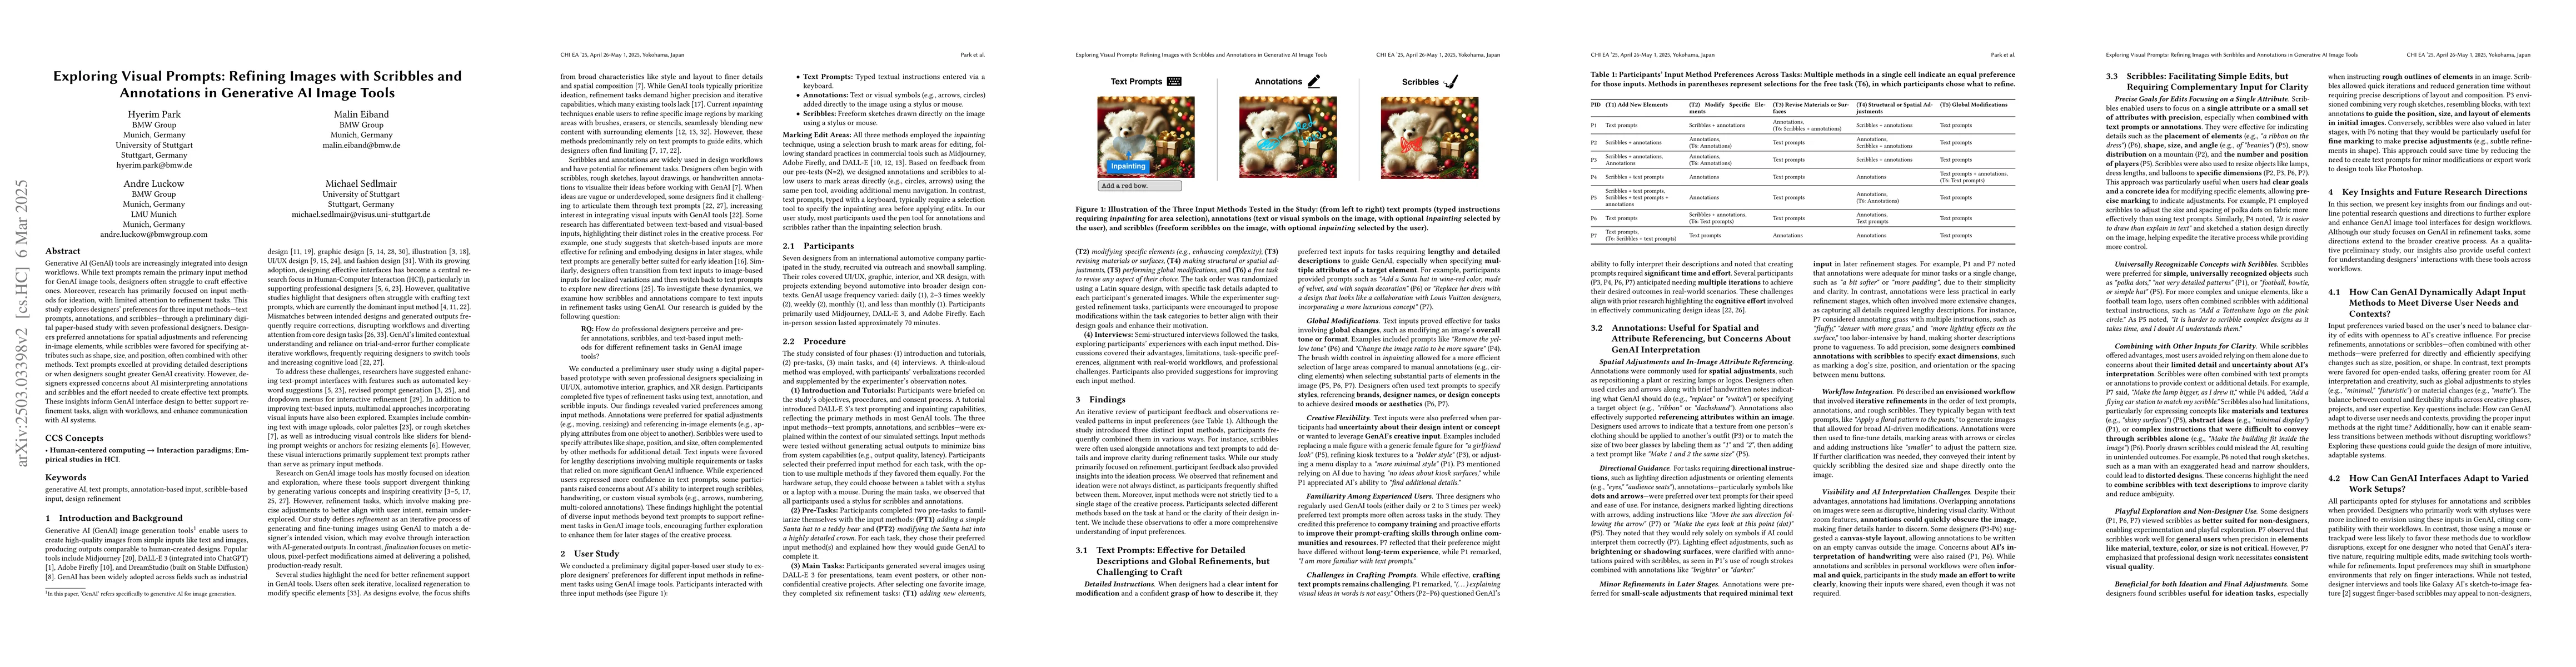
Generative AI (GenAI) tools are increasingly integrated into design workflows. While text prompts remain the primary input method for GenAI image tools, designers often struggle to craft effective one...
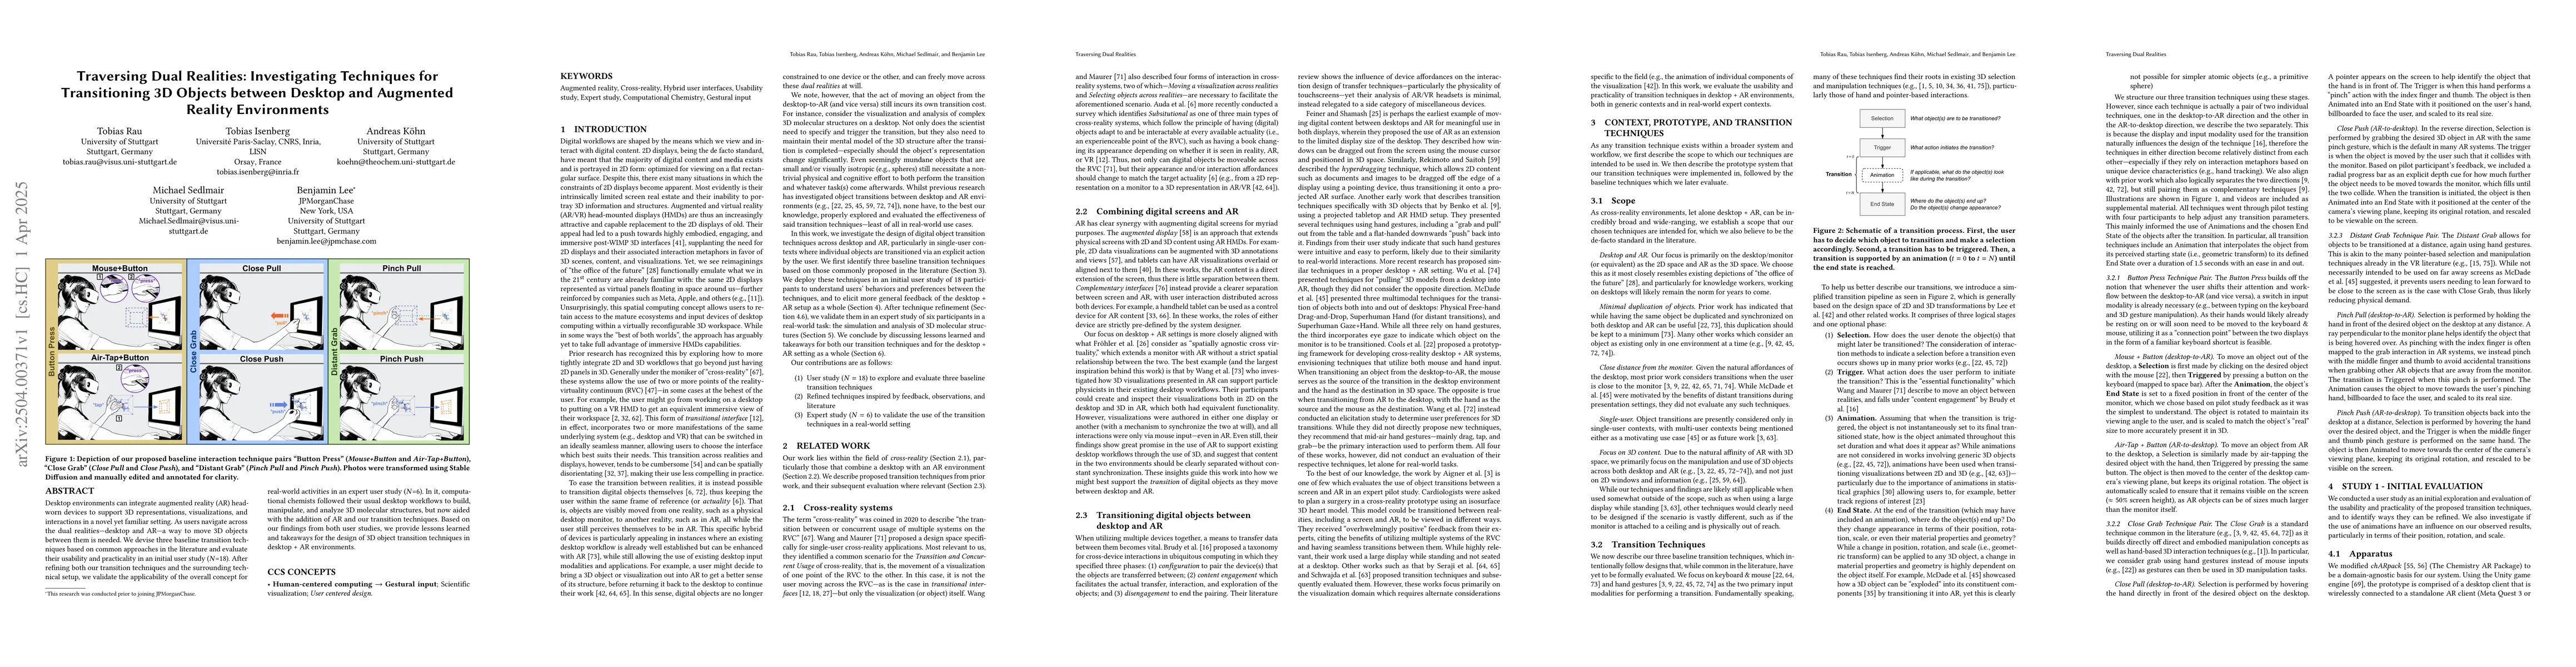
Desktop environments can integrate augmented reality (AR) head-worn devices to support 3D representations, visualizations, and interactions in a novel yet familiar setting. As users navigate across th...
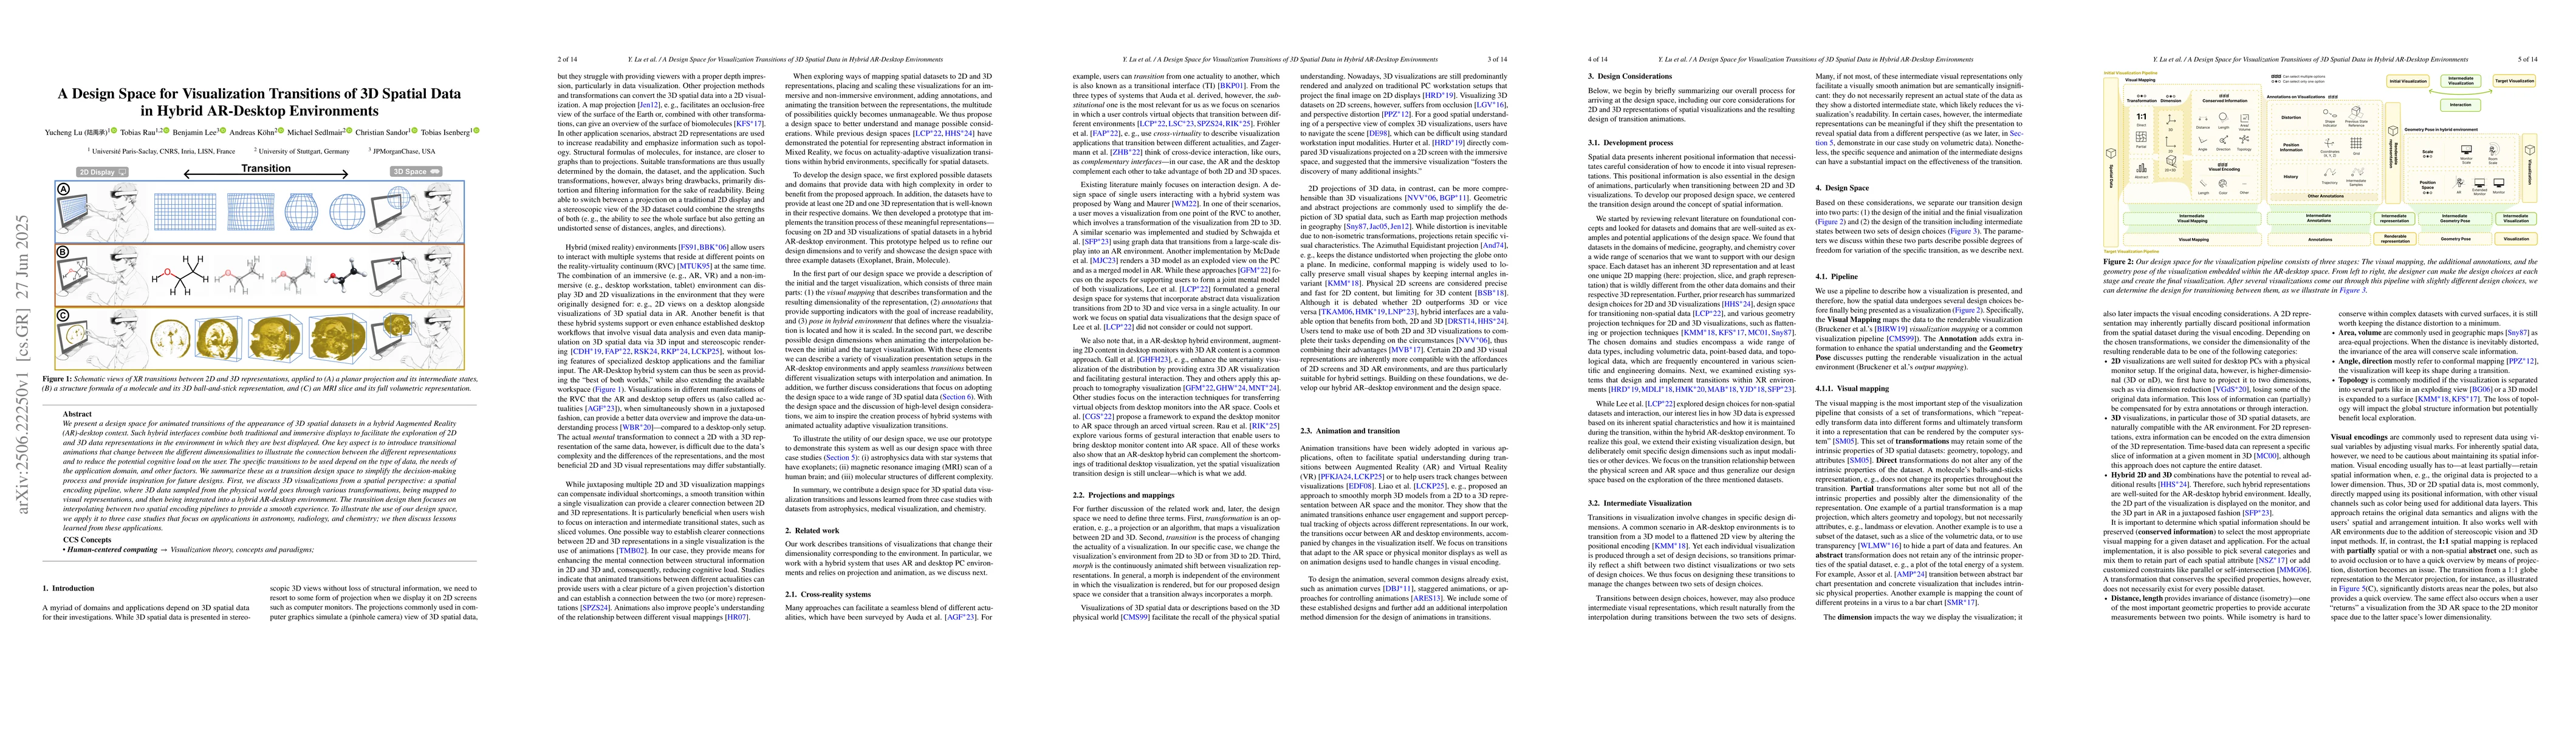
We present a design space for animated transitions of the appearance of 3D spatial datasets in a hybrid Augmented Reality (AR)-desktop context. Such hybrid interfaces combine both traditional and imme...
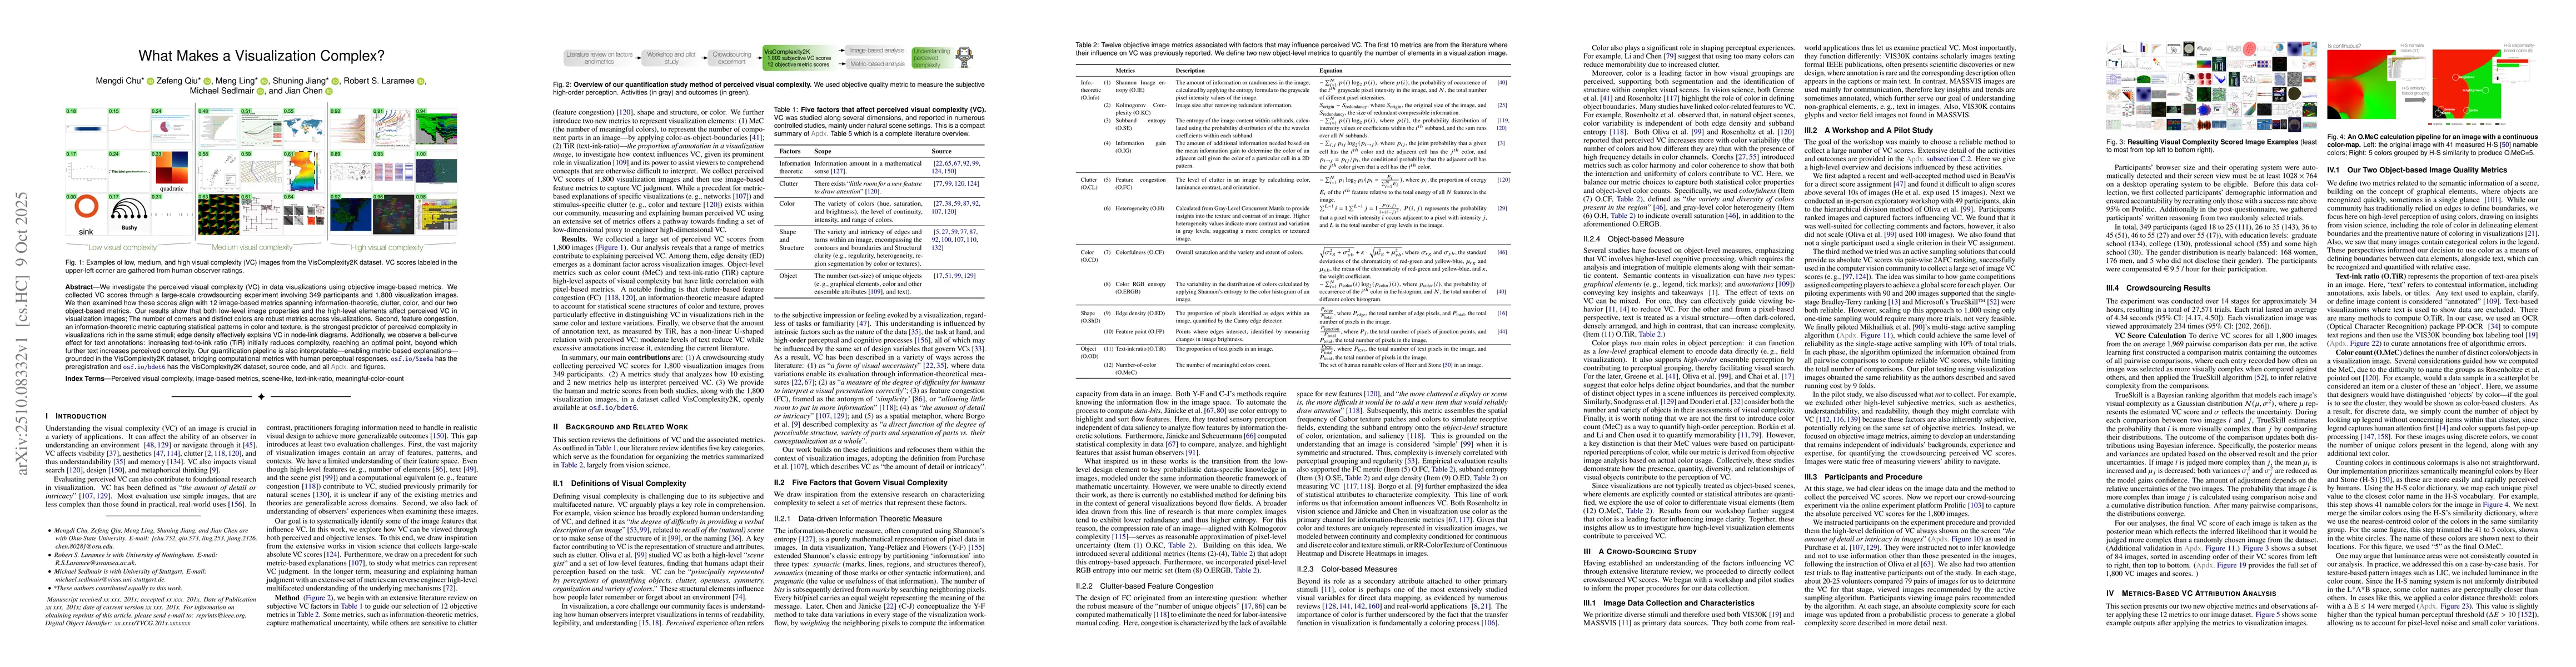
We investigate the perceived visual complexity (VC) in data visualizations using objective image-based metrics. We collected VC scores through a large-scale crowdsourcing experiment involving 349 part...
Generative AI (GenAI) systems are inherently non-deterministic, producing varied outputs even for identical inputs. While this variability is central to their appeal, it challenges established HCI eva...
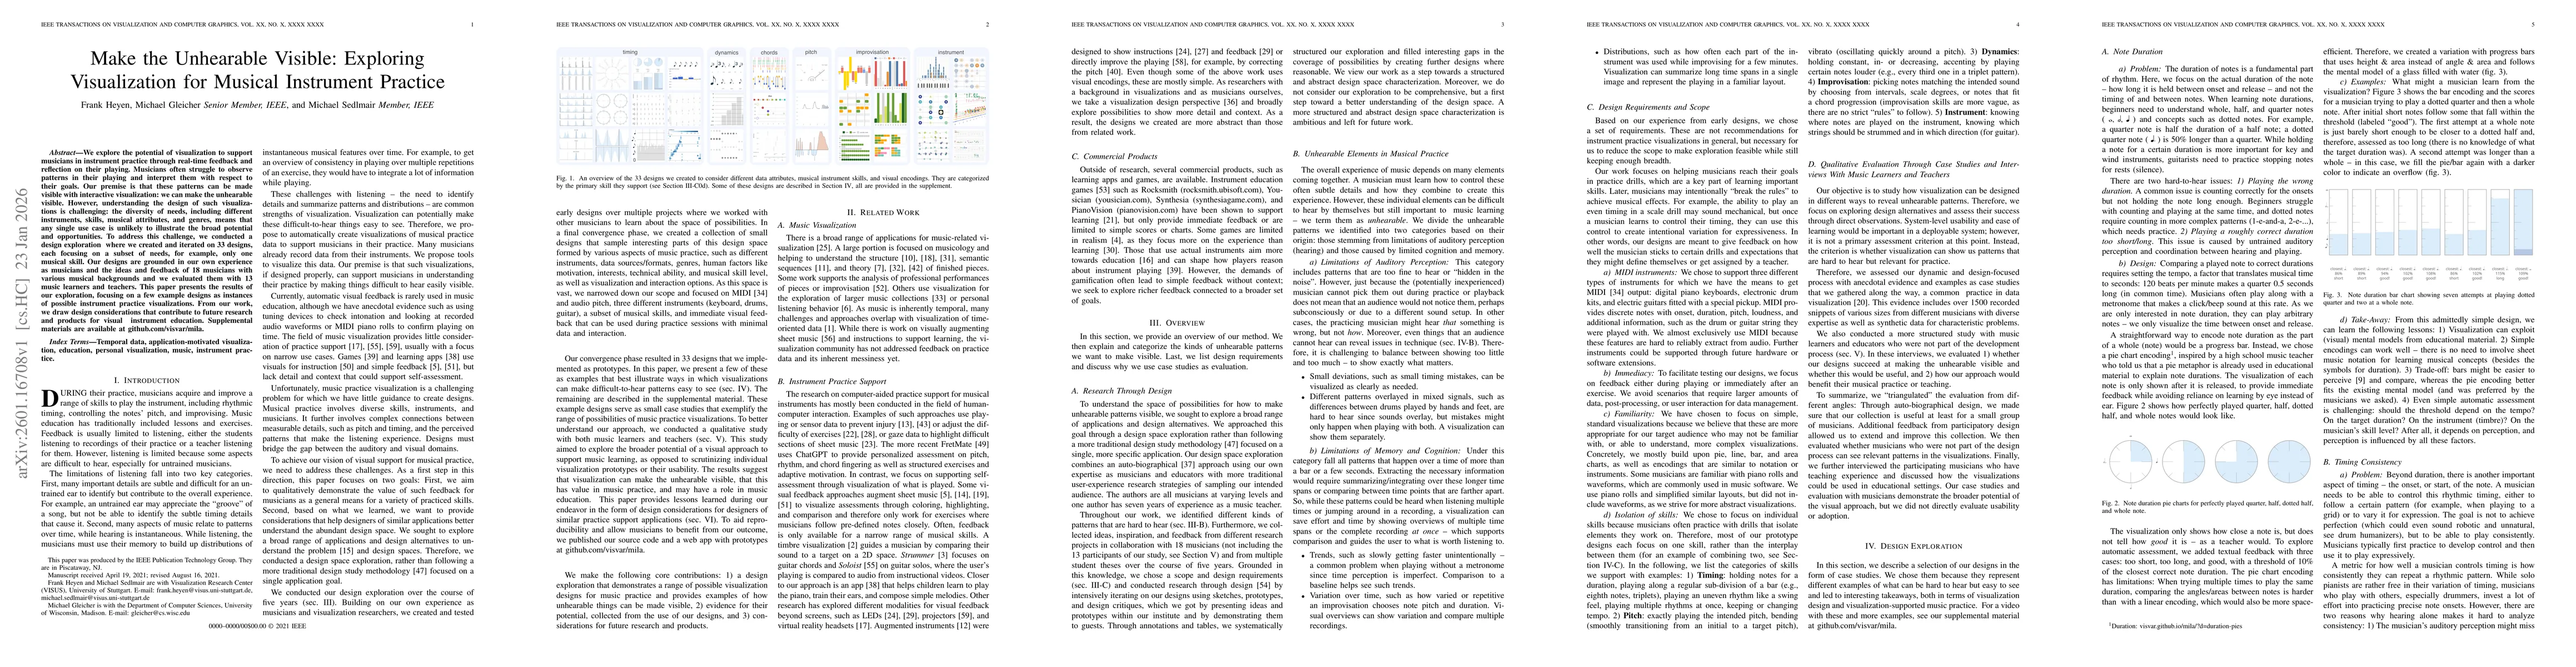
We explore the potential of visualization to support musicians in instrument practice through real-time feedback and reflection on their playing. Musicians often struggle to observe the patterns in th...
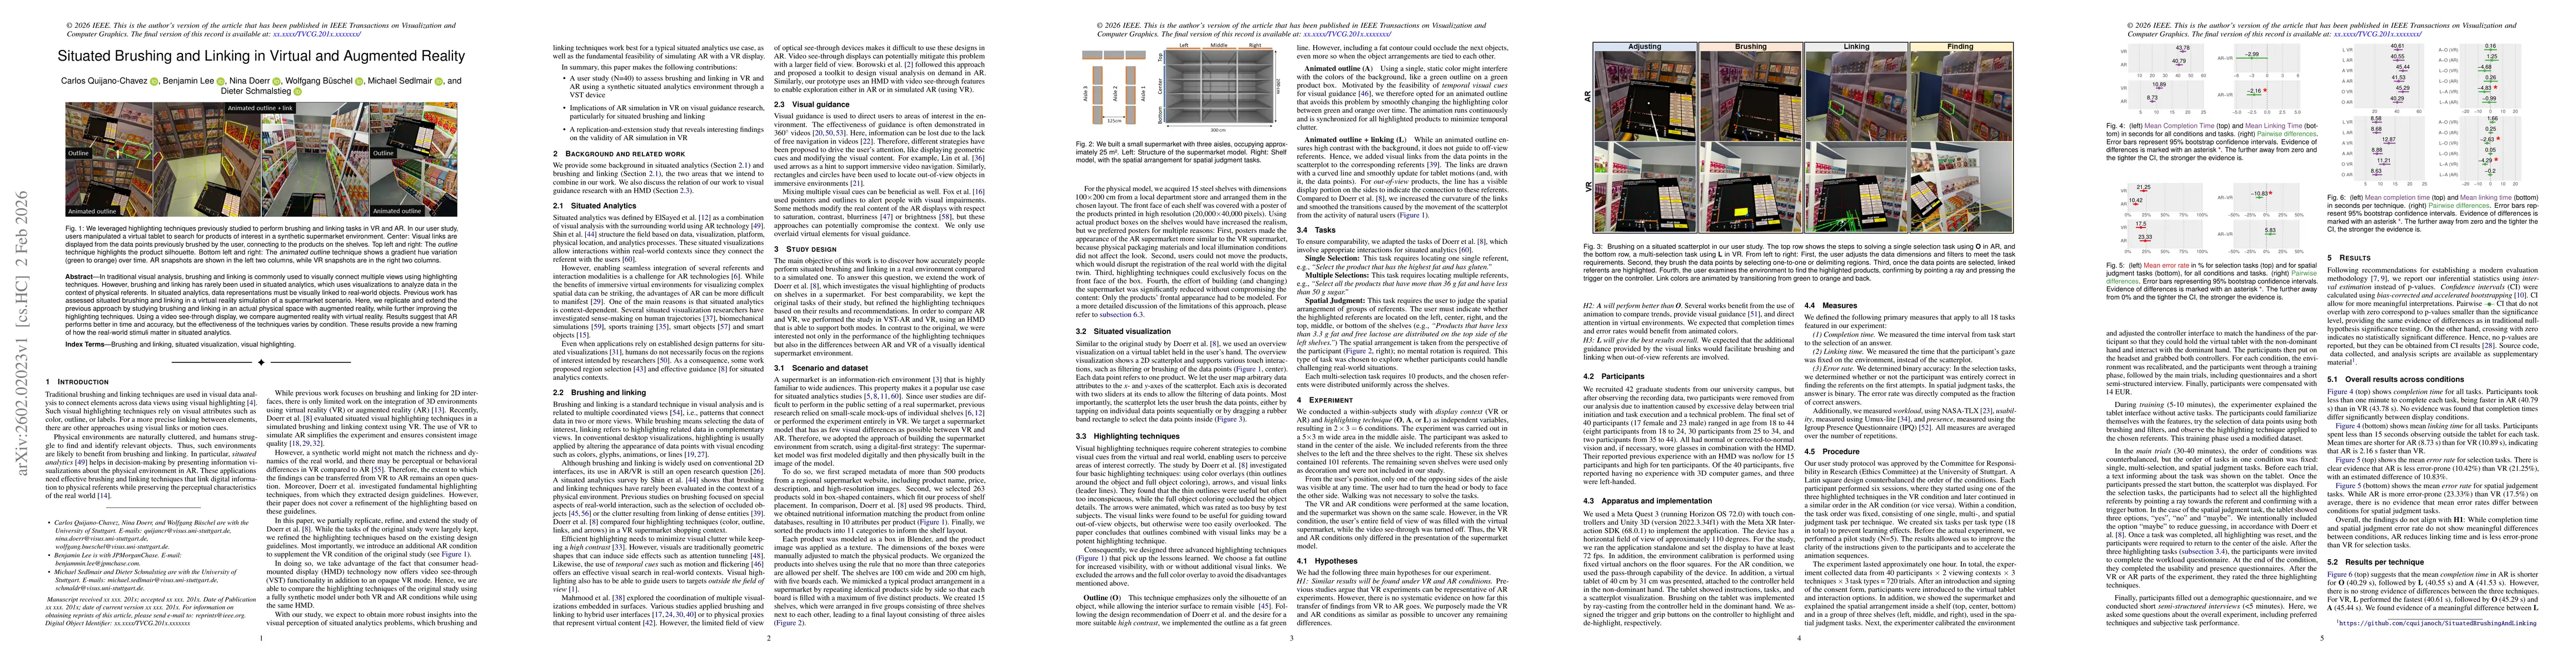
In traditional visual analysis, brushing and linking is commonly used to visually connect multiple views using highlighting techniques. However, brushing and linking has rarely been used in situated a...
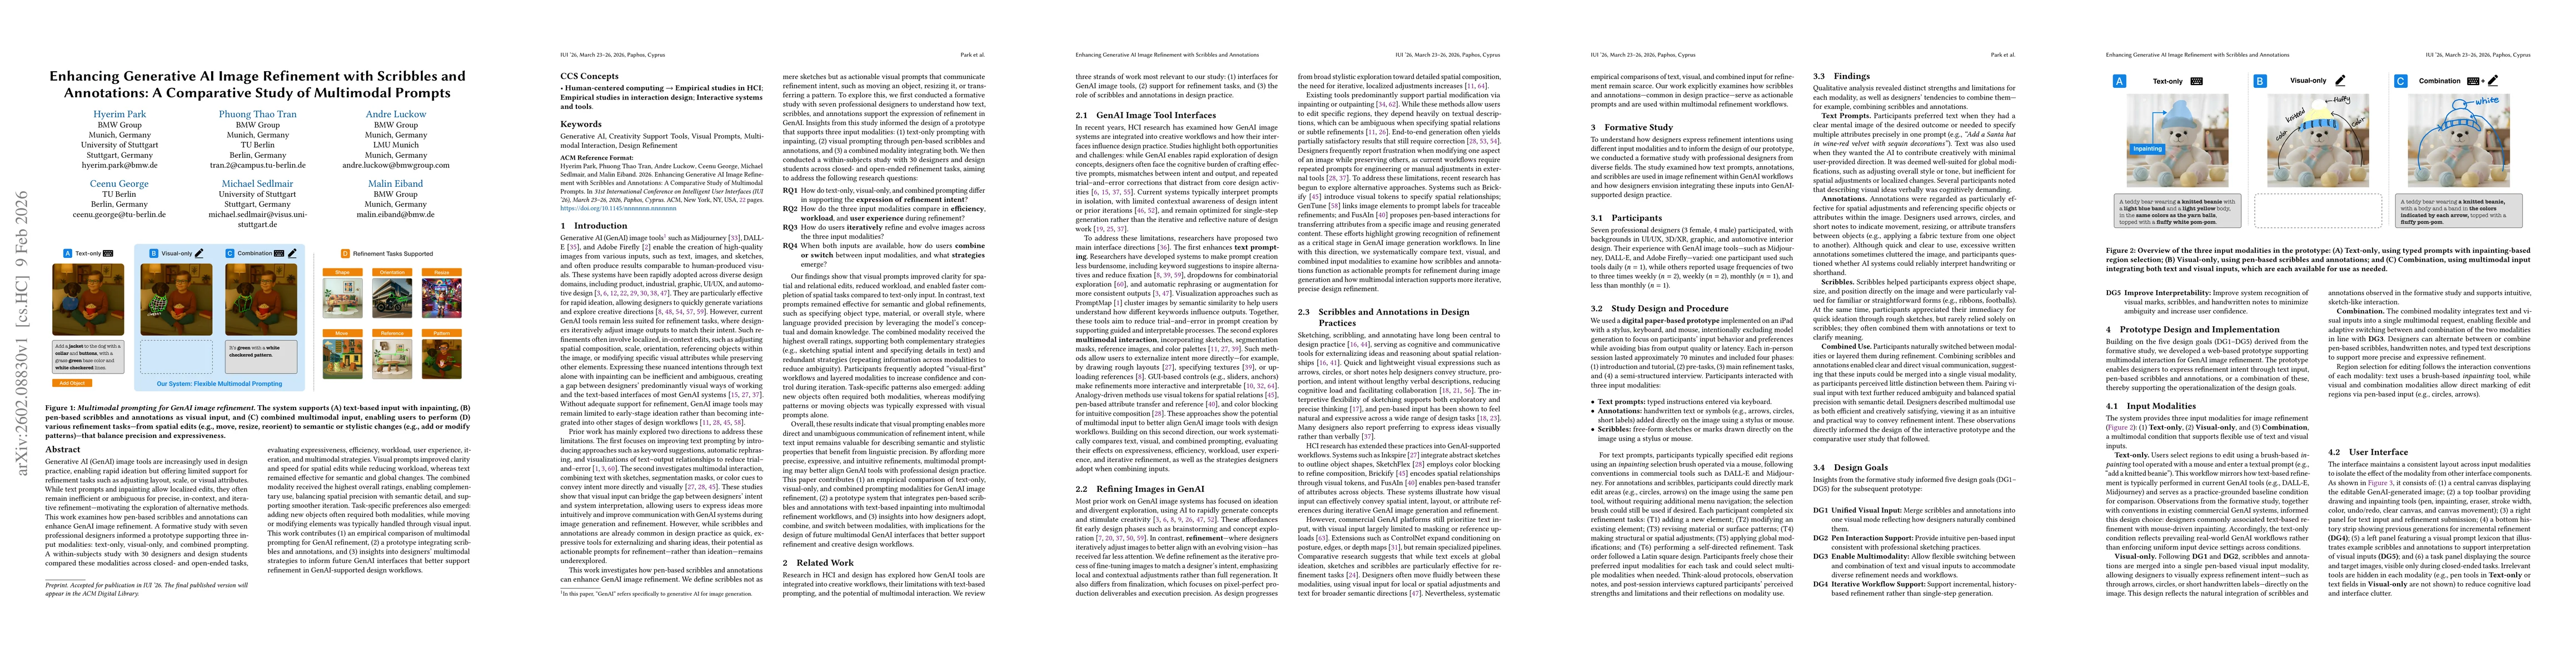
Generative AI (GenAI) image tools are increasingly used in design practice, enabling rapid ideation but offering limited support for refinement tasks such as adjusting layout, scale, or visual attribu...
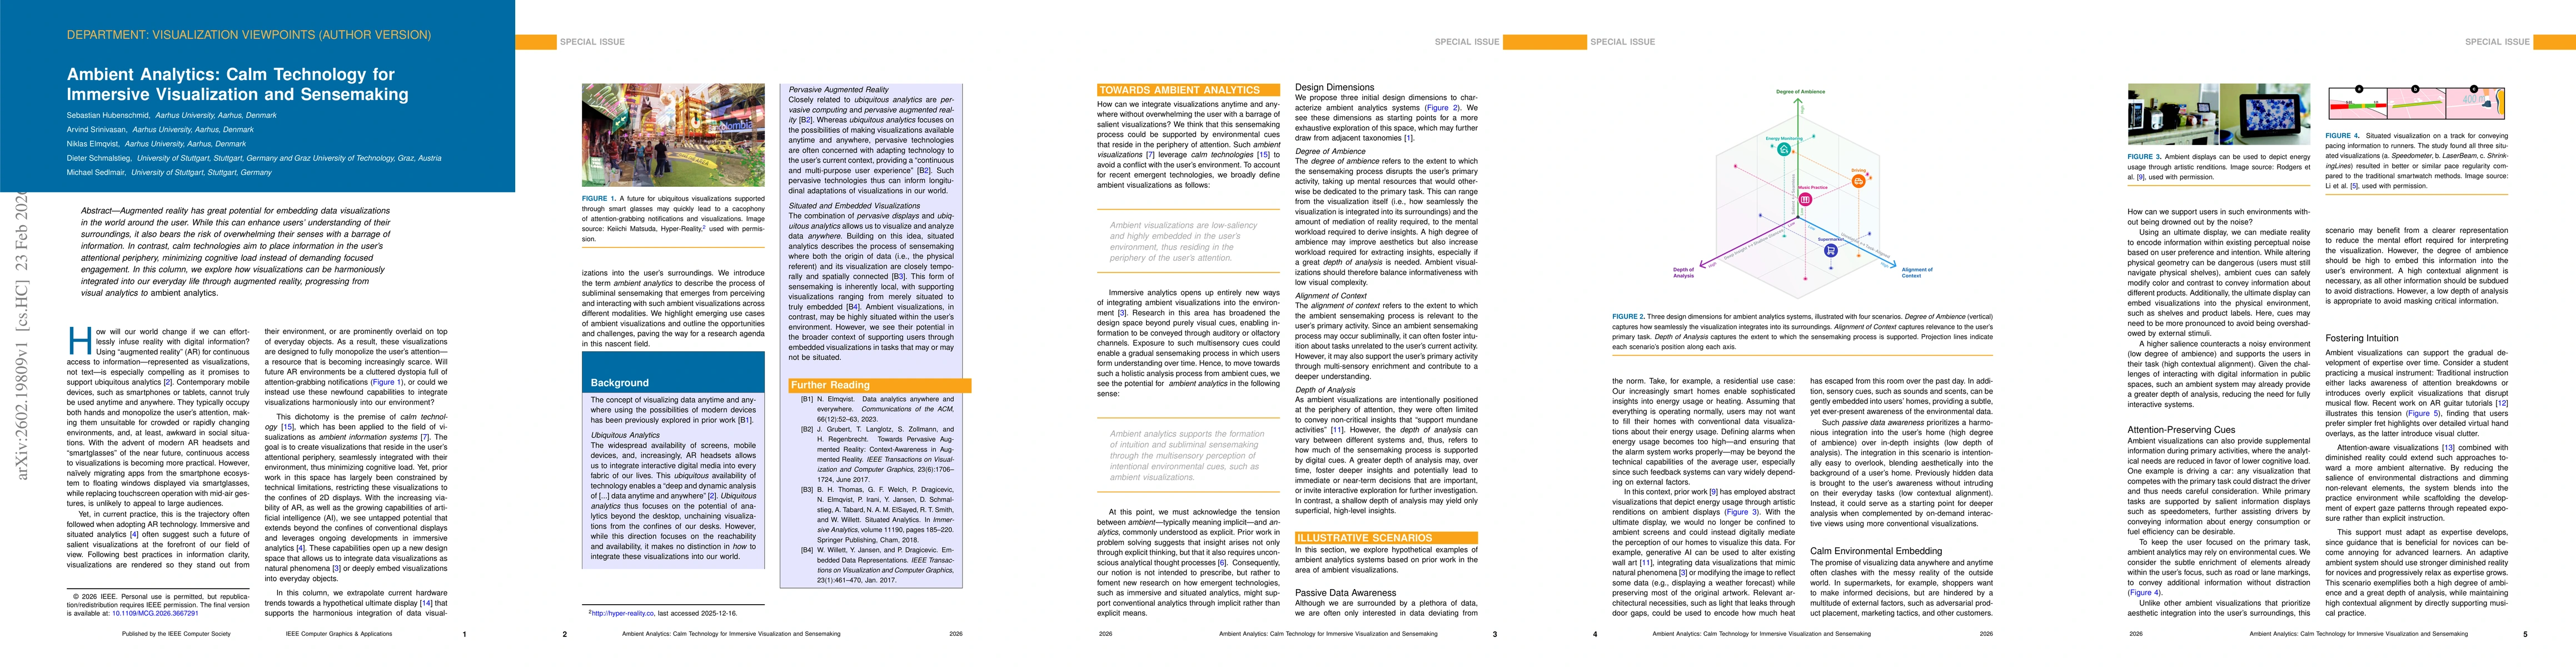
Augmented reality has great potential for embedding data visualizations in the world around the user. While this can enhance users' understanding of their surroundings, it also bears the risk of overw...
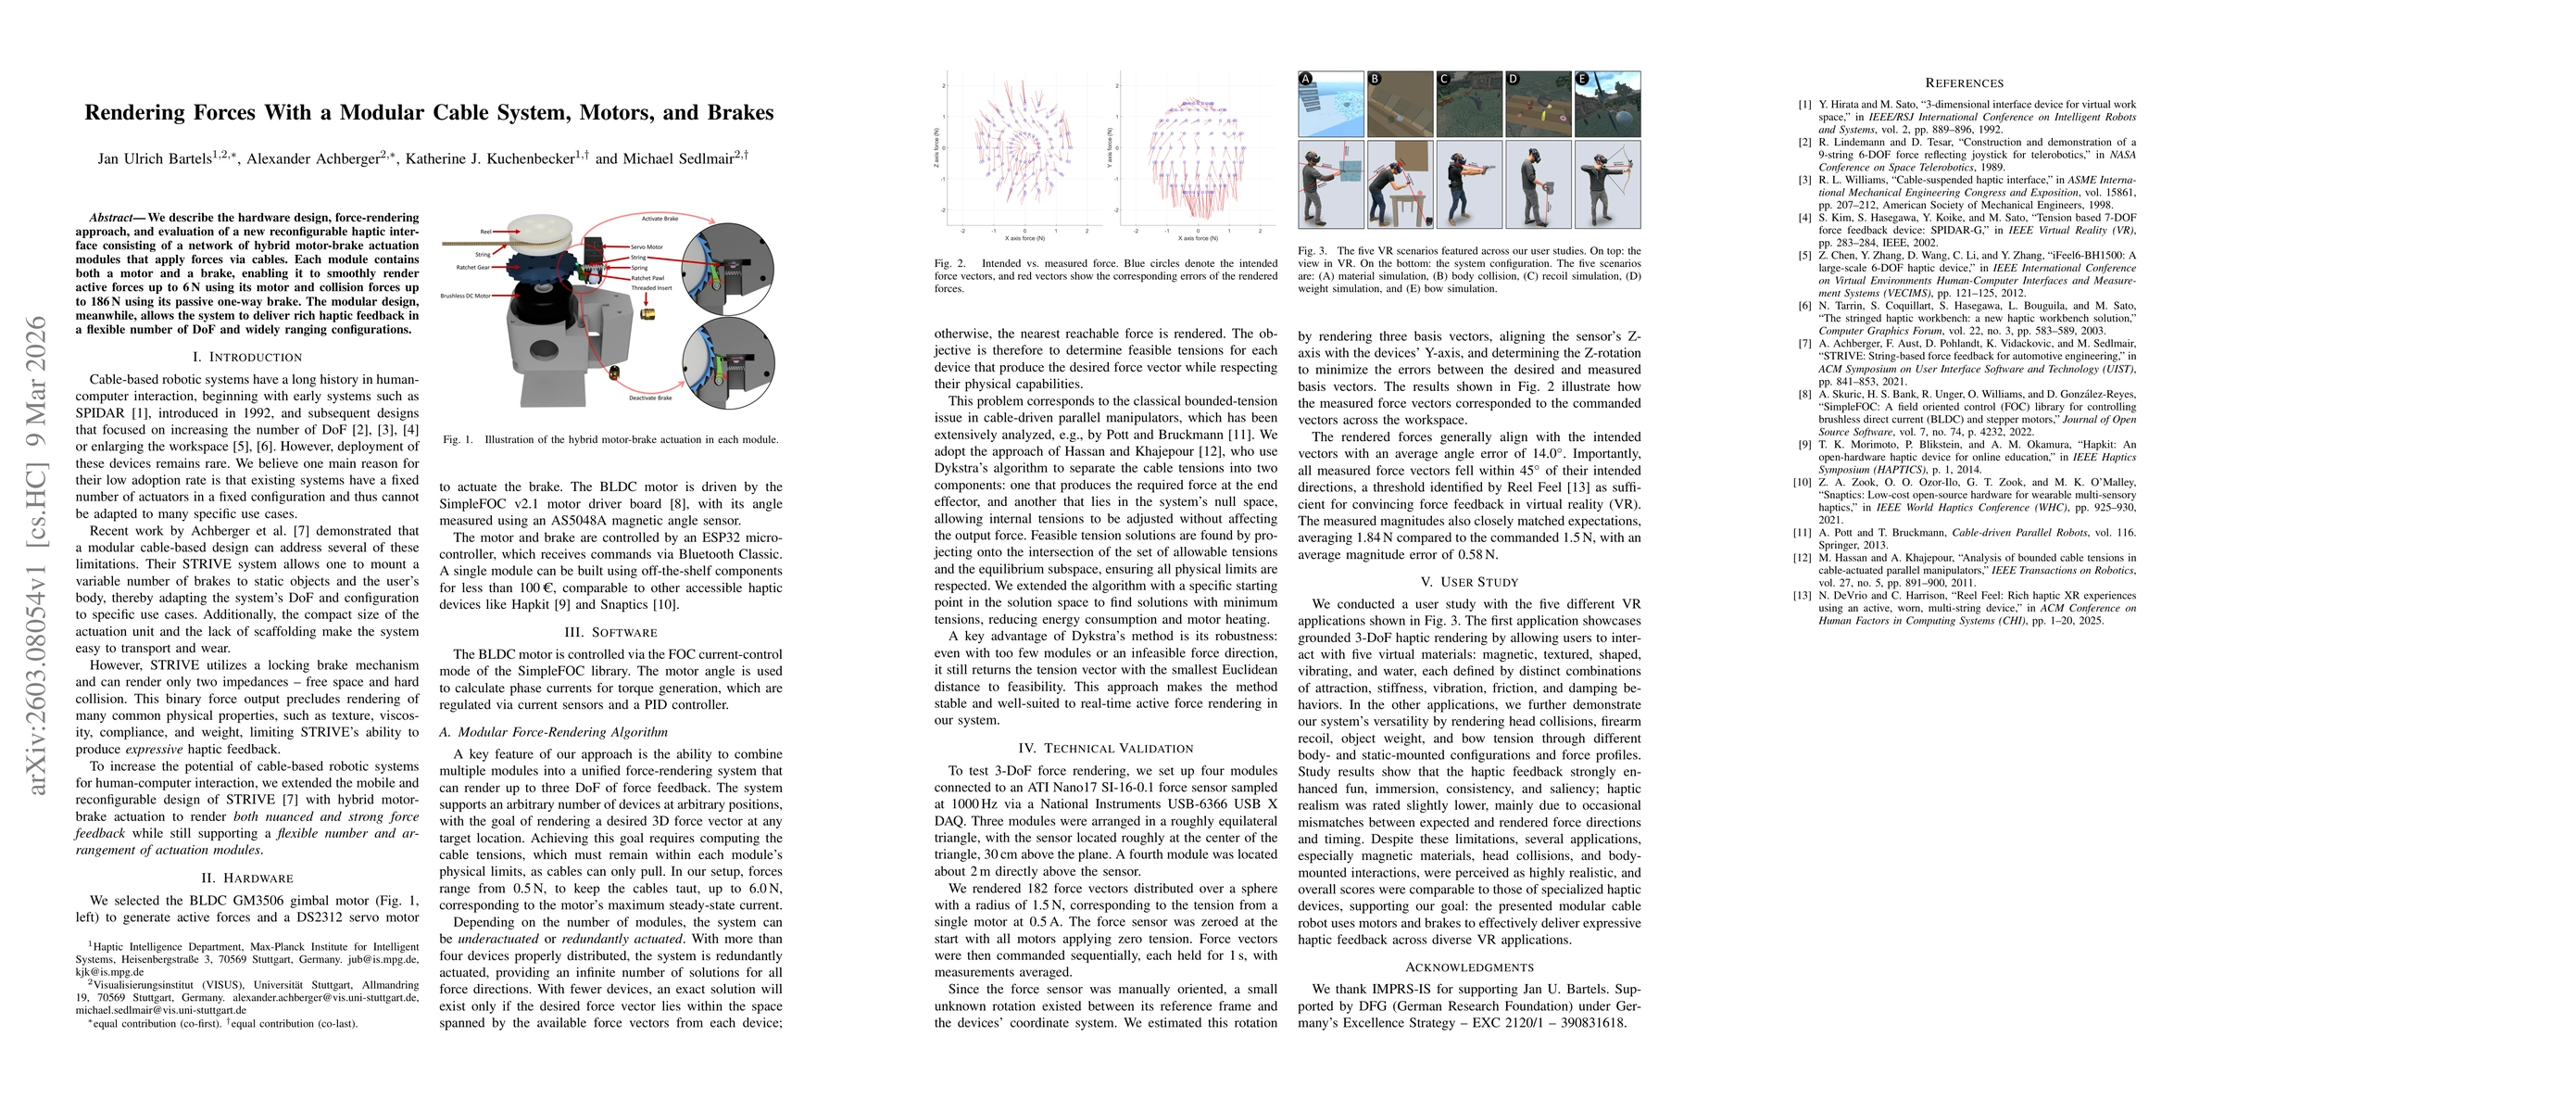
We describe the hardware design, force-rendering approach, and evaluation of a new reconfigurable haptic interface consisting of a network of hybrid motor-brake actuation modules that apply forces via...
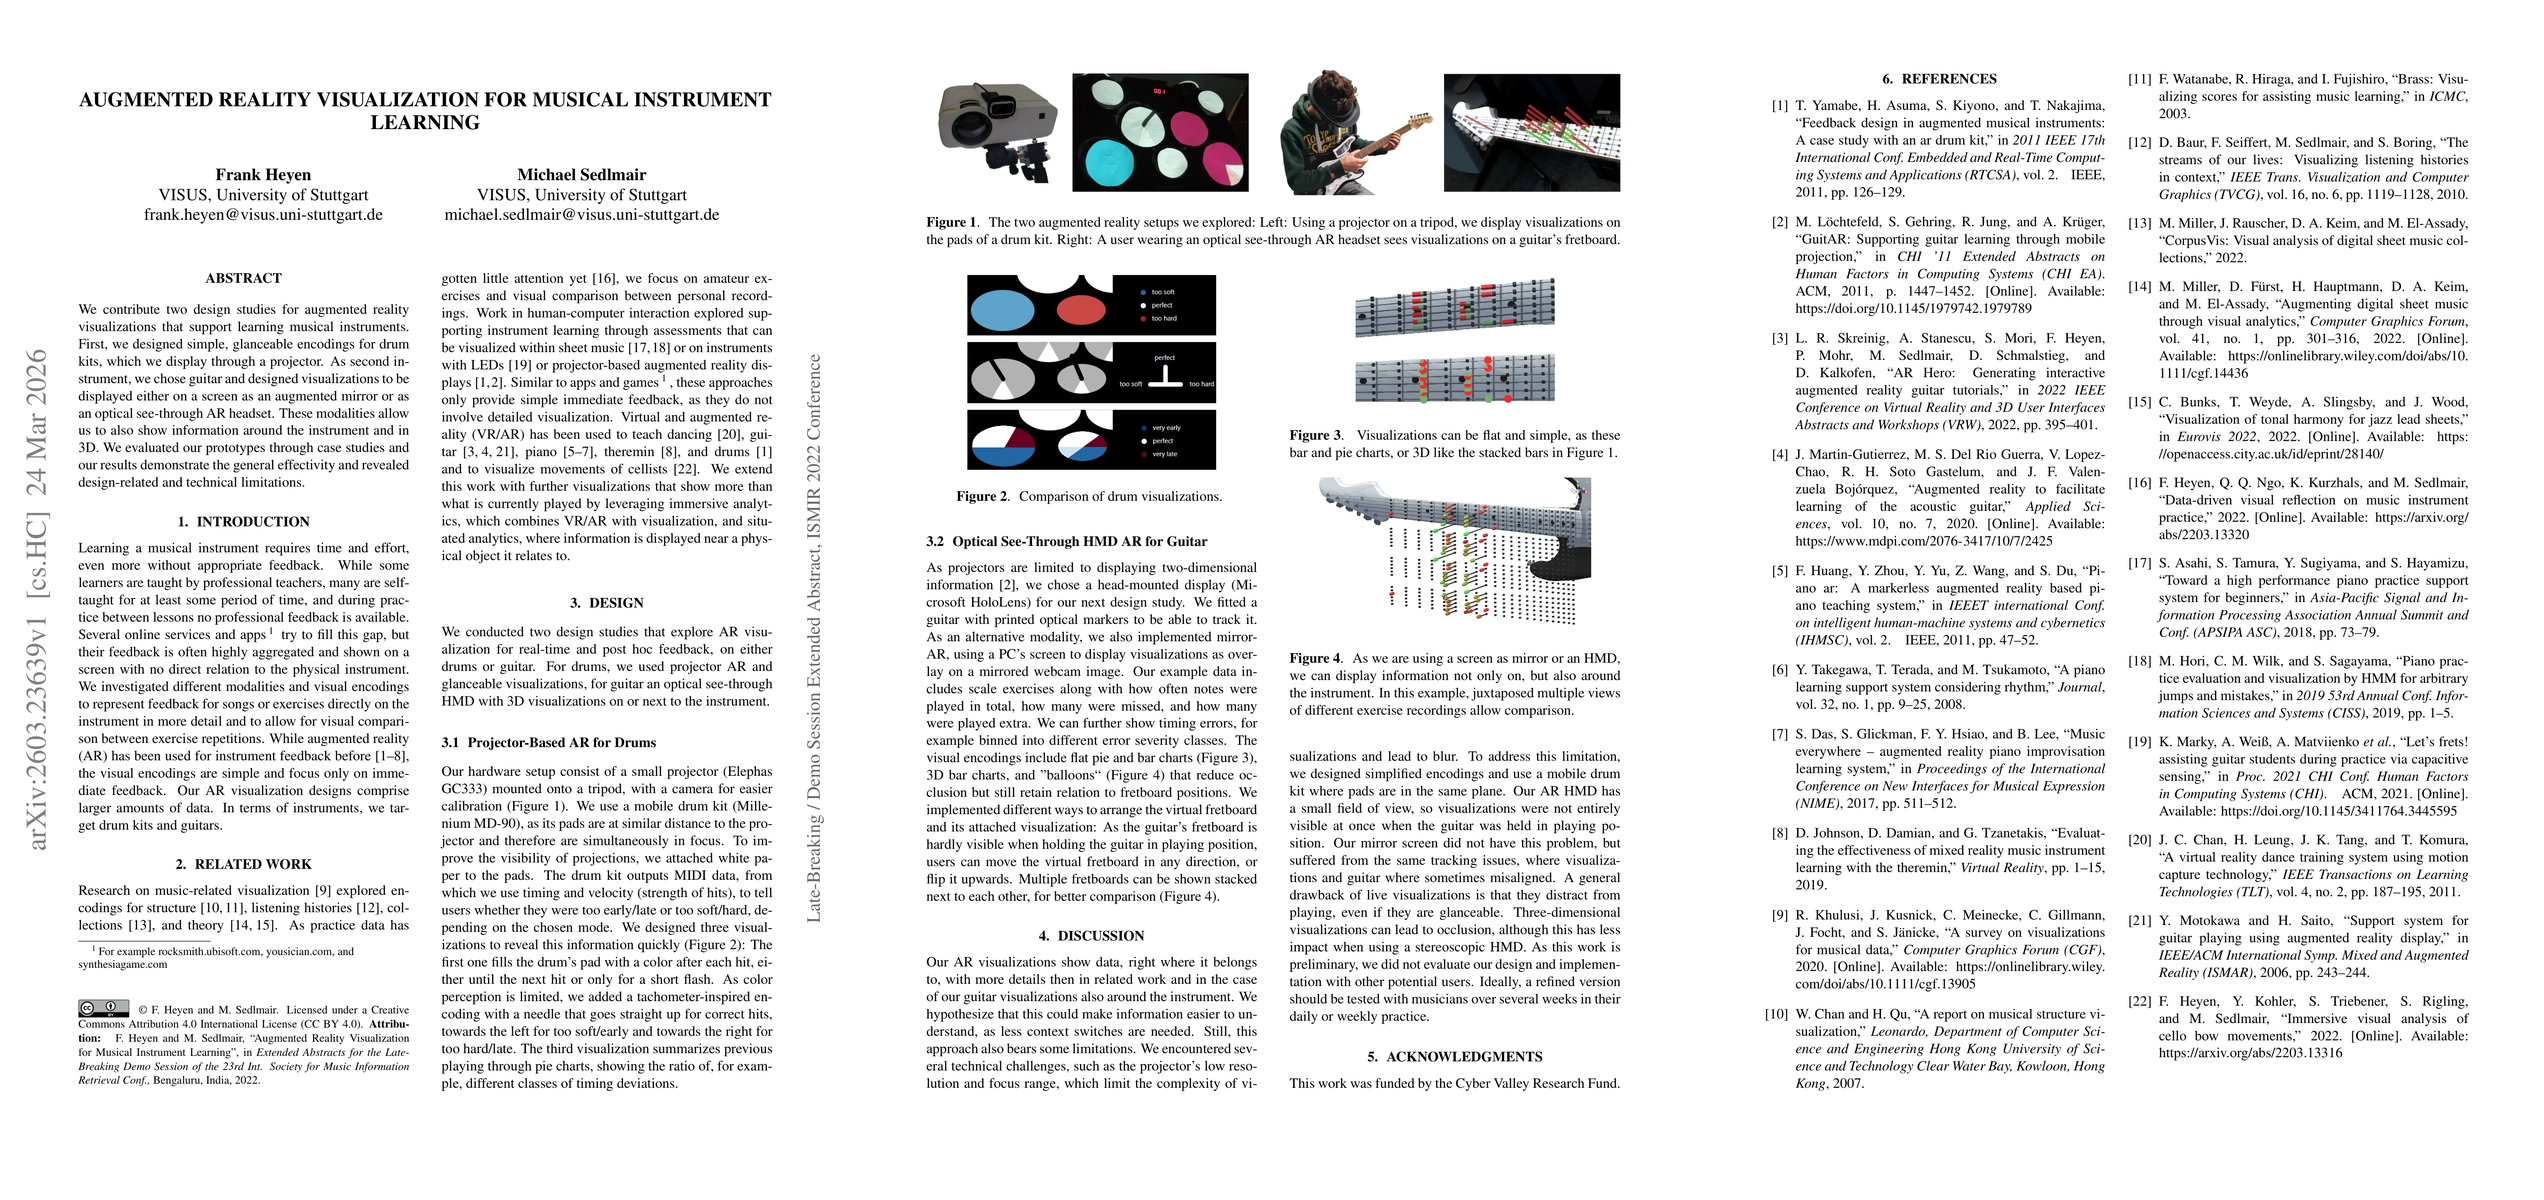
We contribute two design studies for augmented reality visualizations that support learning musical instruments. First, we designed simple, glanceable encodings for drum kits, which we display through...
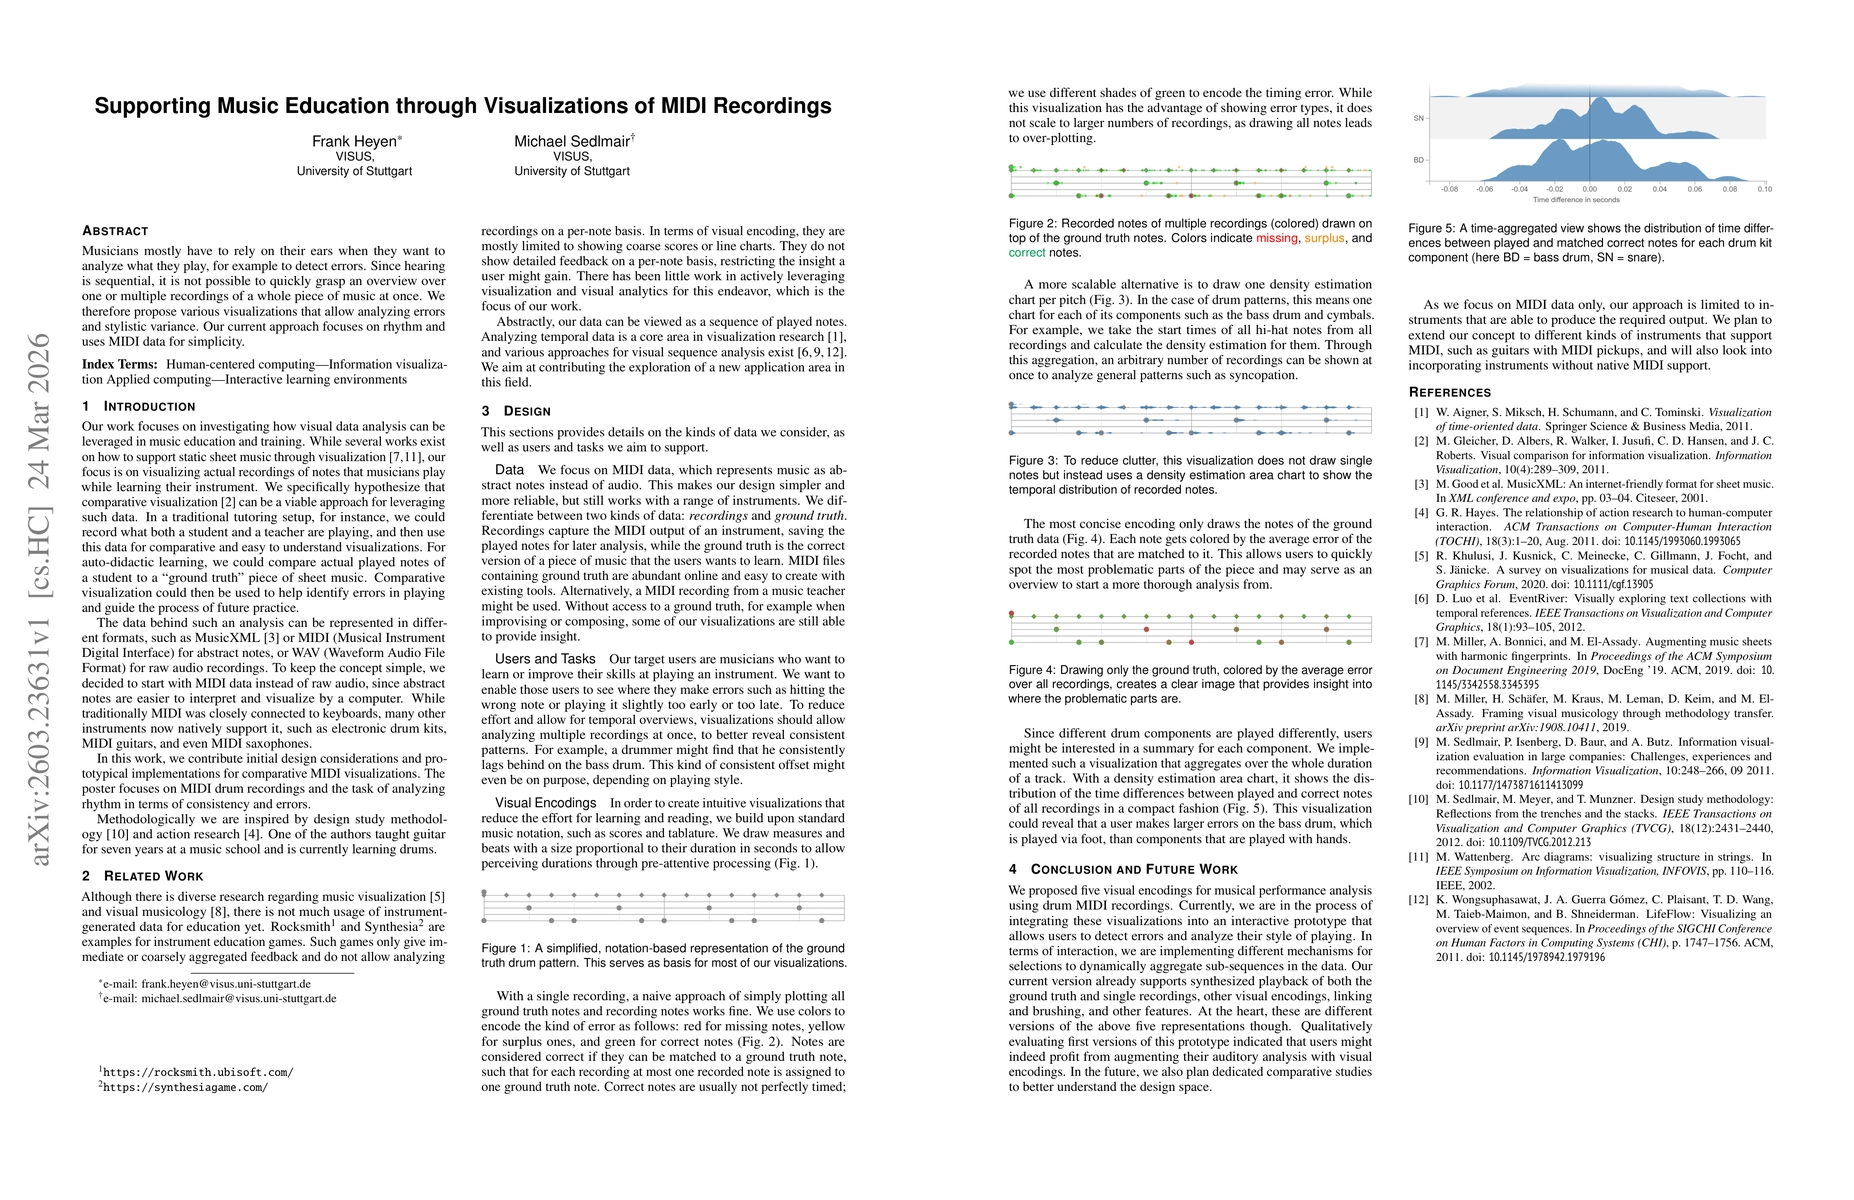
Musicians mostly have to rely on their ears when they want to analyze what they play, for example to detect errors. Since hearing is sequential, it is not possible to quickly grasp an overview over on...
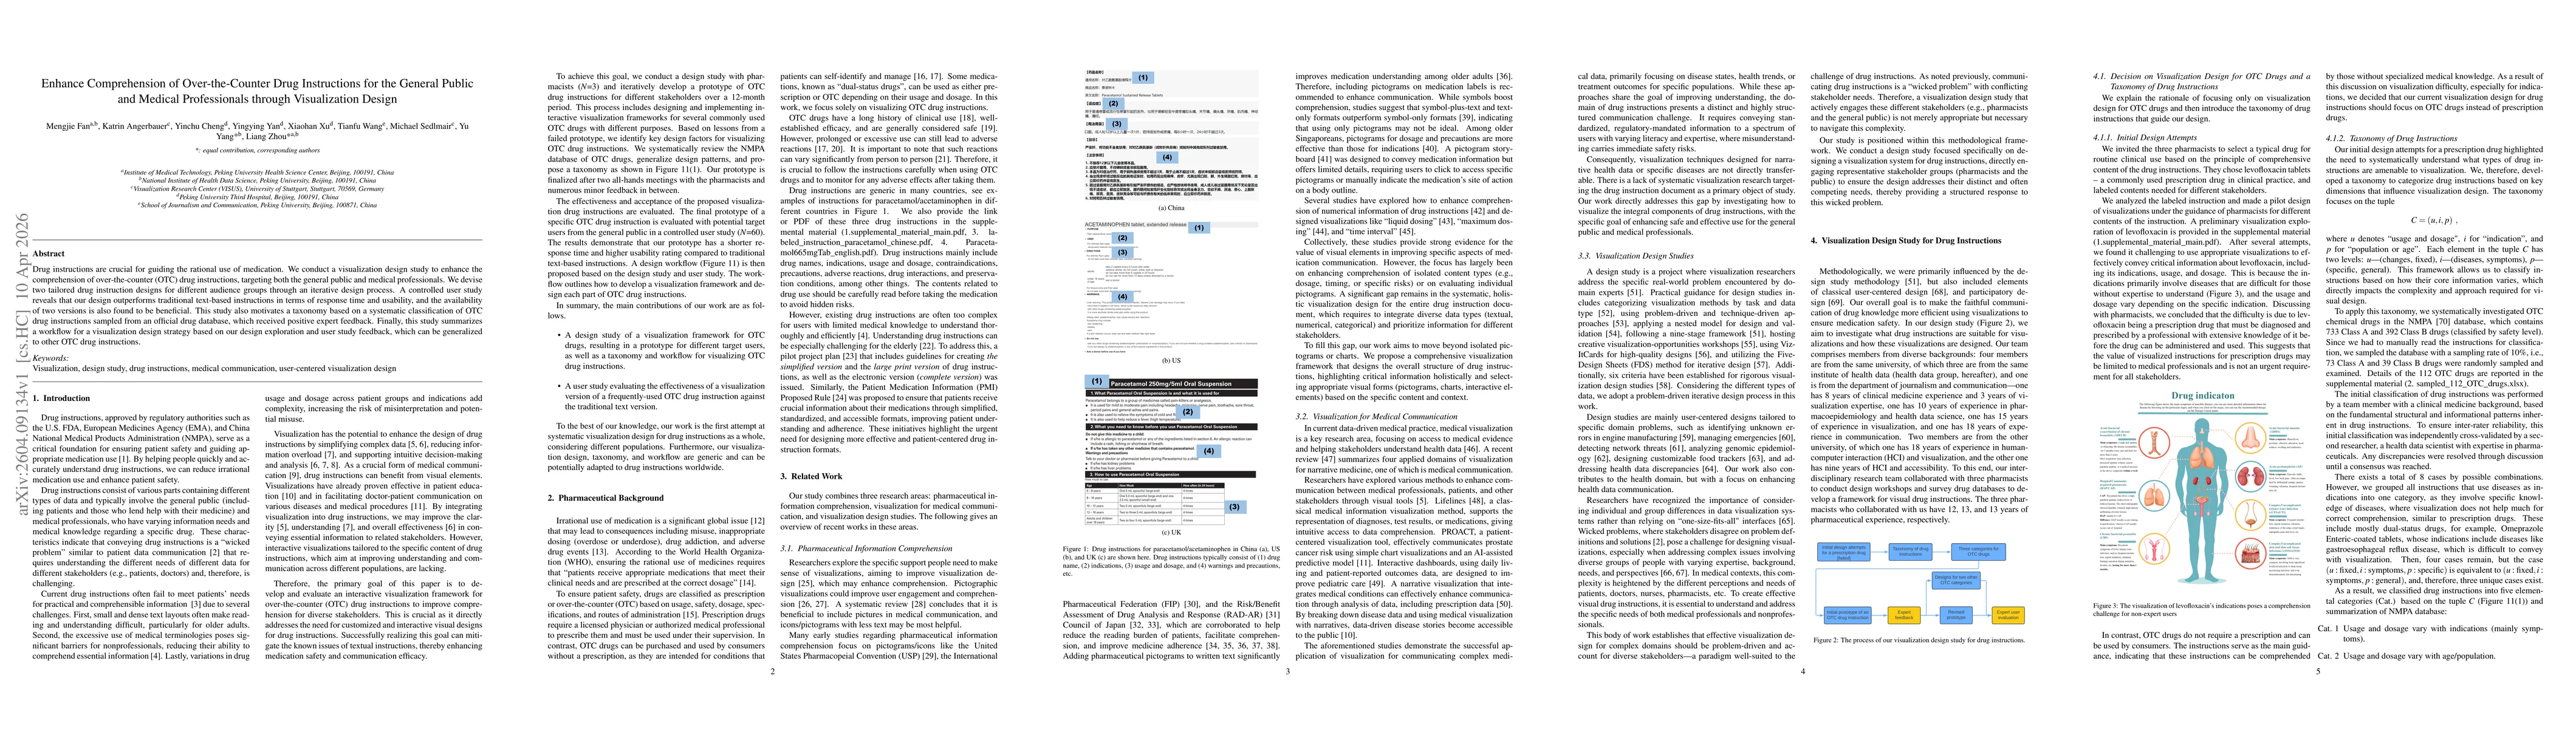
Drug instructions are crucial for guiding the rational use of medication. We conduct a visualization design study to enhance the comprehension of over-the-counter (OTC) drug instructions, targeting bo...
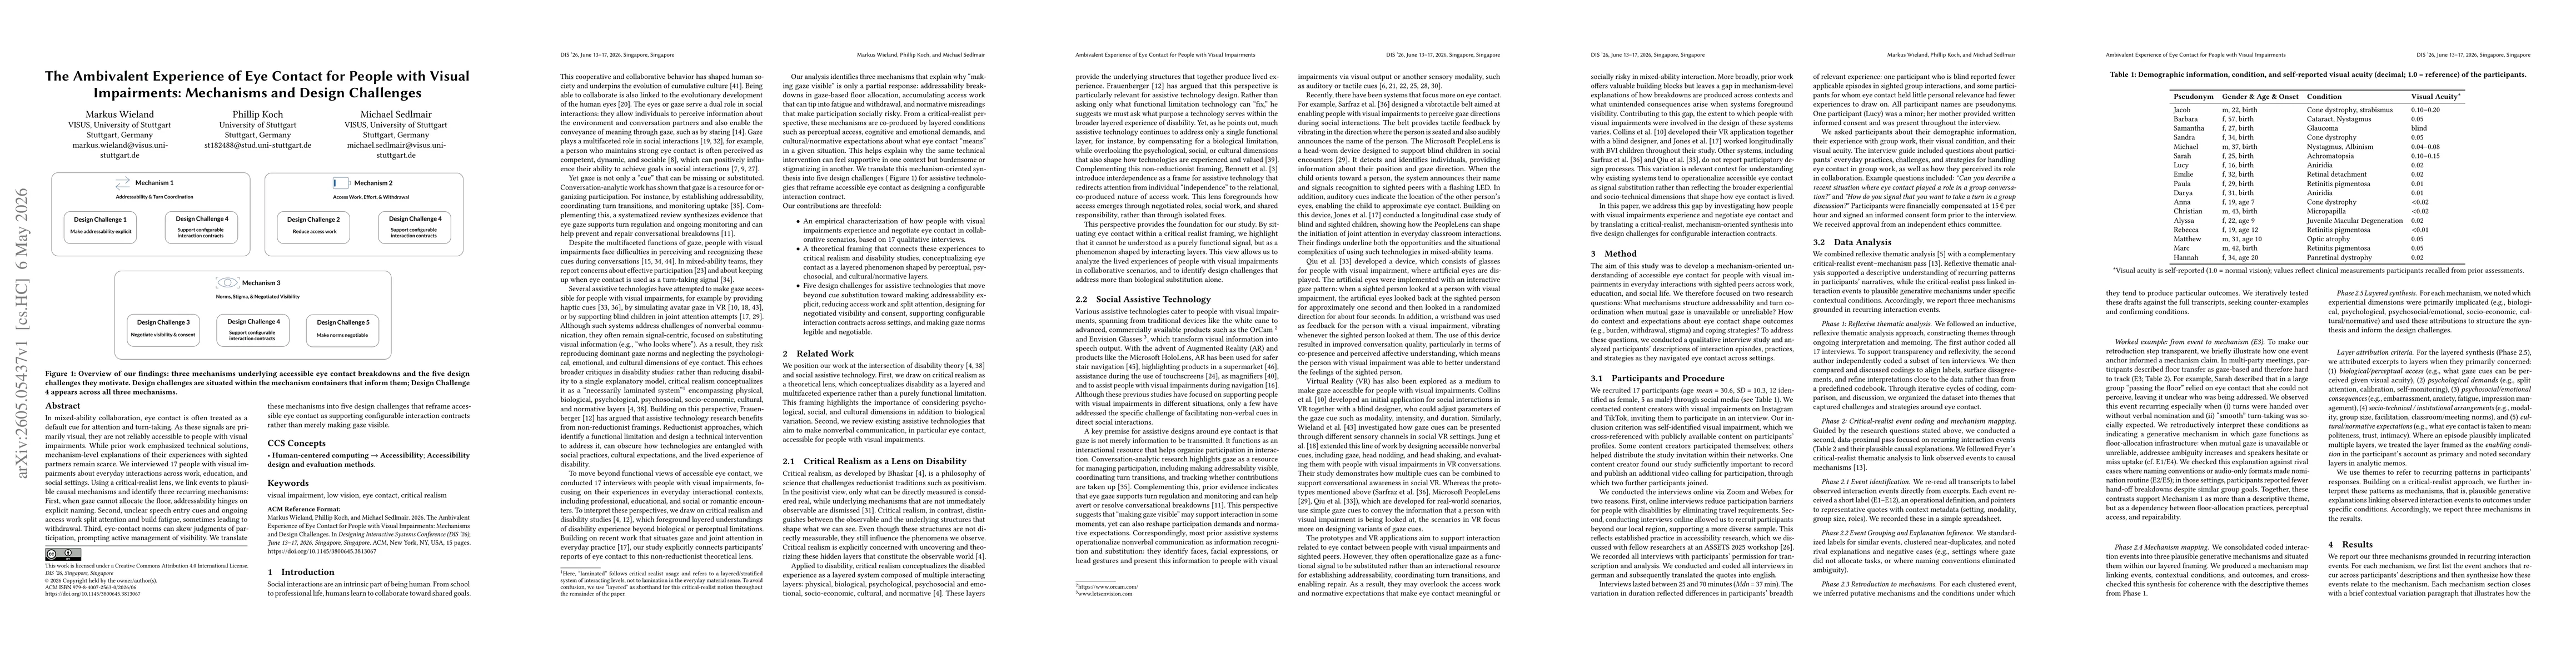
In mixed-ability collaboration, eye contact is often treated as a default cue for attention and turn-taking. As these signals are primarily visual, they are not reliably accessible to people with visu...
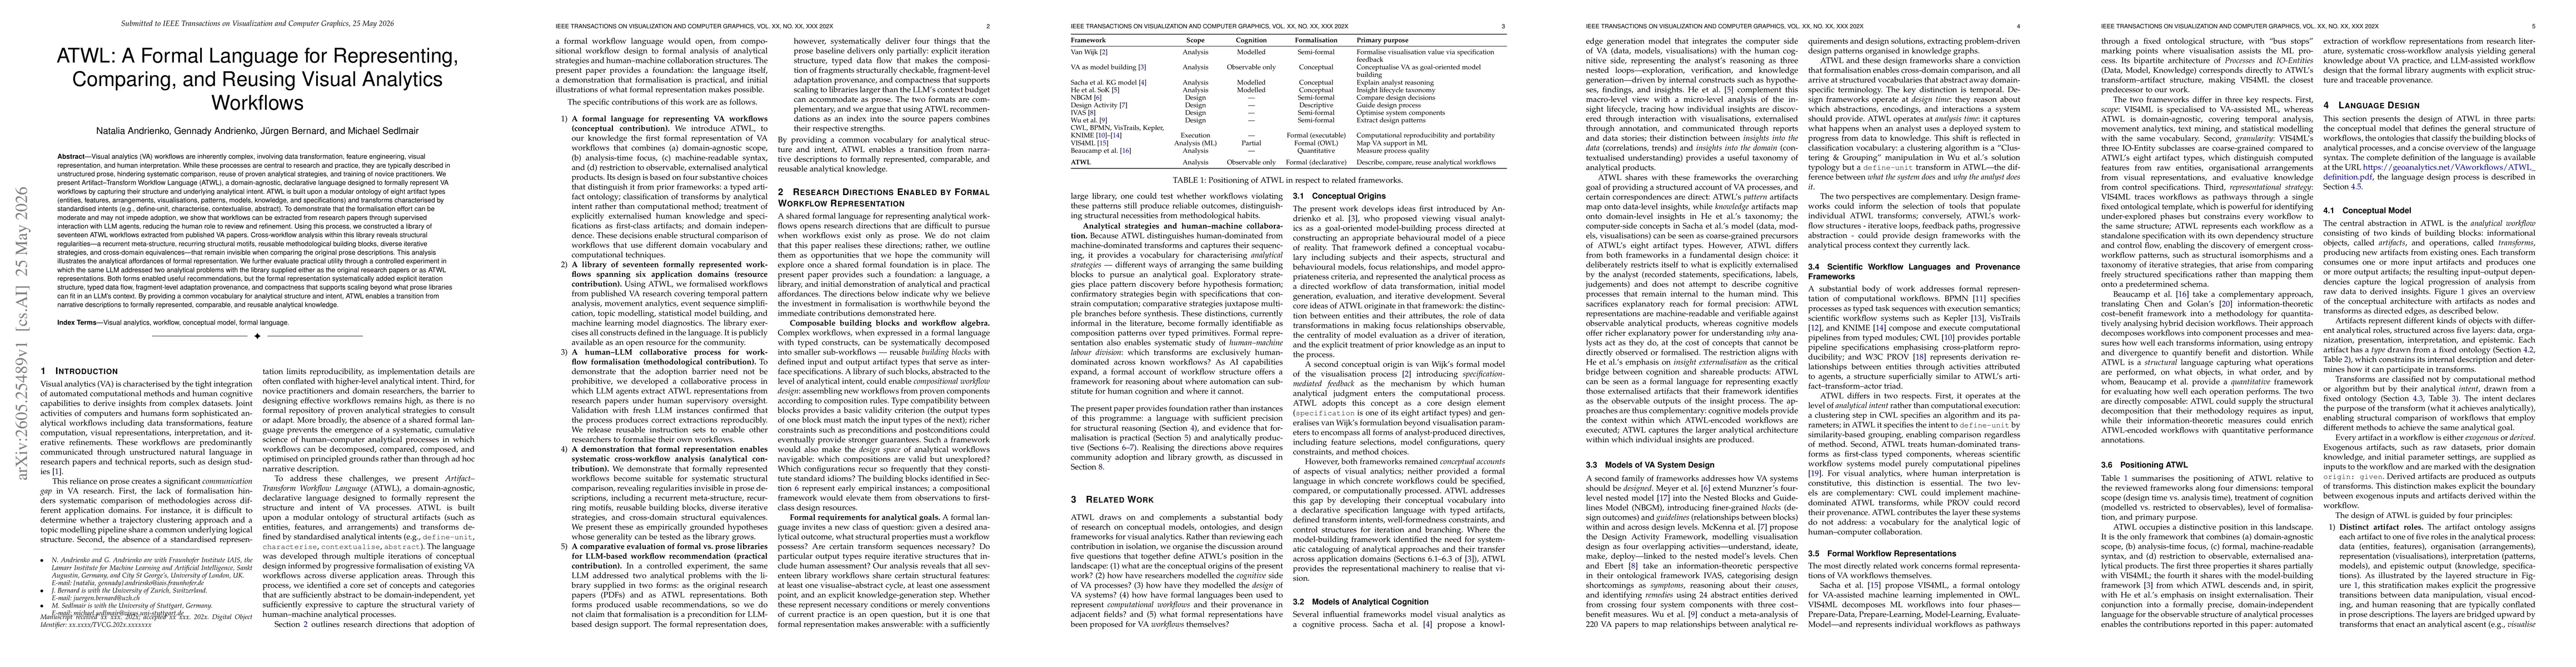
Visual analytics (VA) workflows are inherently complex, involving data transformation, feature engineering, visual representation, and human interpretation. They are typically described in unstructure...
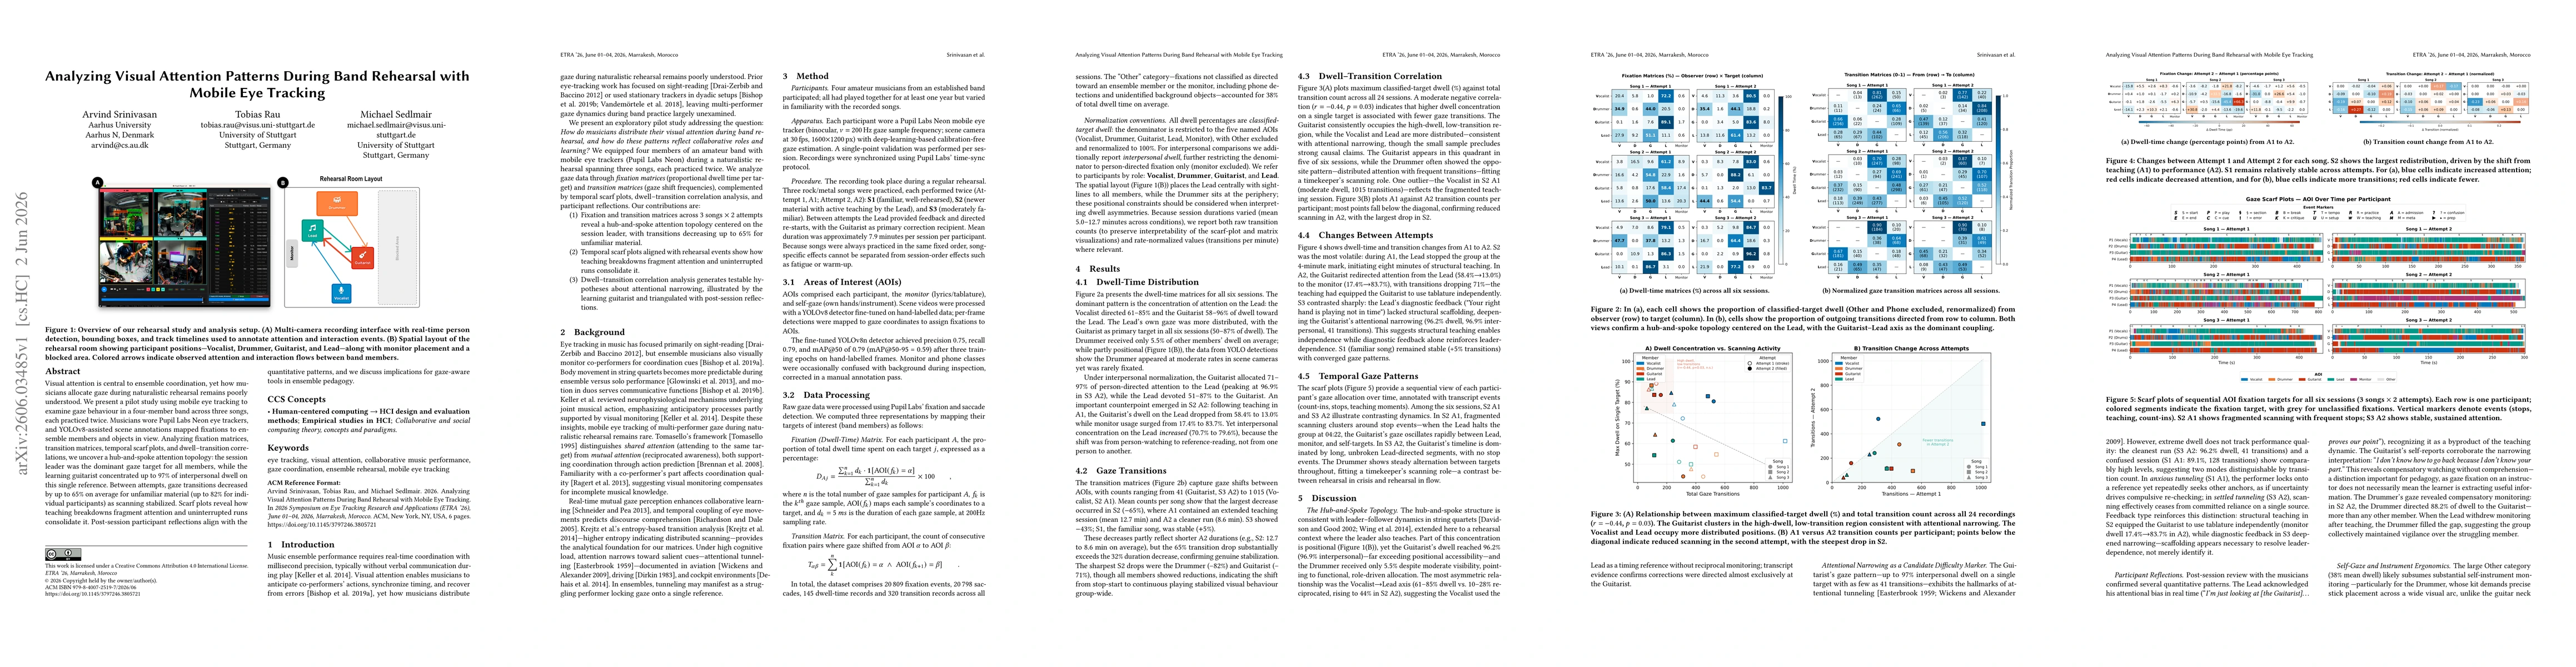
Visual attention is central to ensemble coordination, yet how musicians allocate gaze during naturalistic rehearsal remains poorly understood. We present a pilot study using mobile eye tracking to exa...