This research paper presents a typology of 10 visual representation types derived from a qualitative analysis of 6,833 images, offering a tool and dataset for exploring these designs. The typology aids in visualizing community research evolution, categorization, standardization, and visual design style identification.
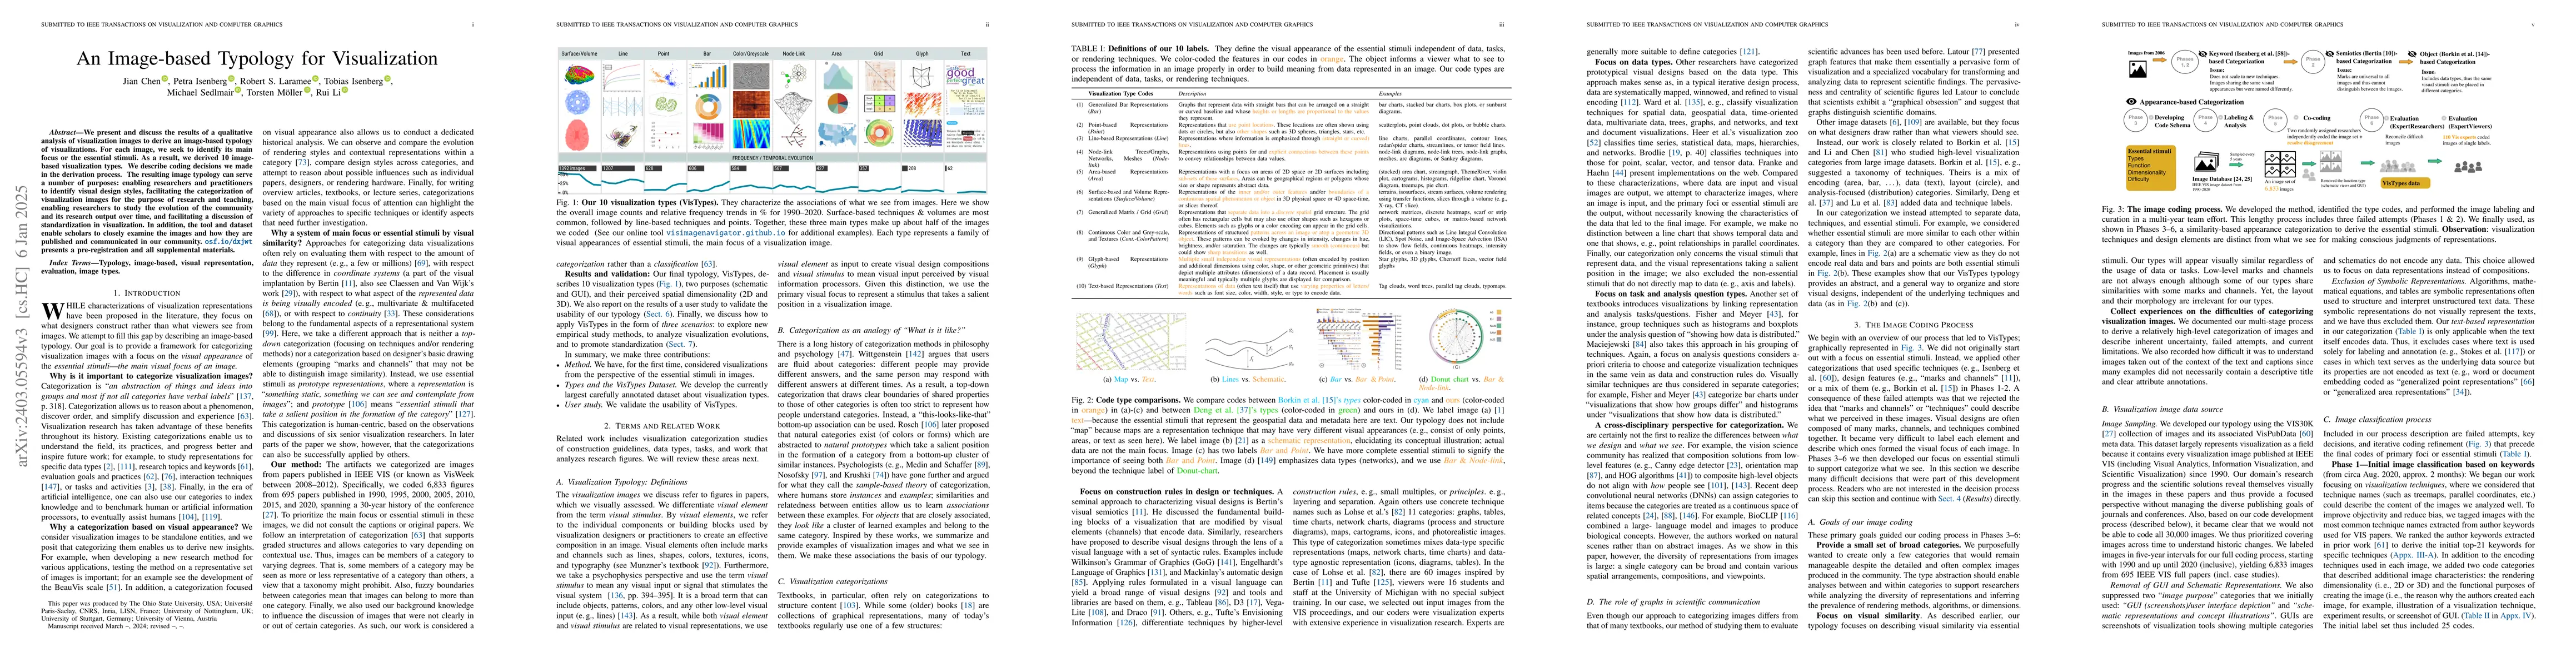
We present and discuss the results of a qualitative analysis of visual representations from images. We labeled each image's essential stimuli, the removal of which would render a visualization uninterpretable. As a result, we derive a typology of 10 visualization types of defined groups. We describe the typology derivation process in which we engaged. The resulting typology and image analysis can serve a number of purposes: enabling researchers to study the evolution of the community and its research output over time, facilitating the categorization of visualization images for the purpose of research and teaching, allowing researchers and practitioners to identify visual design styles to further align the quantification of any visual information processor, be that a person or an algorithm observer, and it facilitates a discussion of standardization in visualization. In addition to the visualization typology from images, we provide a dataset of 6,833 tagged images and an online tool that can be used to explore and analyze the large set of labeled images. The tool and data set enable scholars to closely examine the diverse visual designs used and how they are published and communicated in our community. A pre-registration, a free copy of this paper, and all supplemental materials are available via osf.io/dxjwt.
Get AI-generated insights about this paper's methodology, results, and significance.
Current paper (gray), citations (green), references (blue)
Remco Chang, Gabriel Appleby, Camelia D. Brumar et al.
Jian Chen, Han-Wei Shen, Tobias Isenberg et al.
Title | Authors | Year | Actions |
---|---|---|---|
ZuantuSet: A Collection of Historical Chinese Visualizations and Illustrations
|
Xiyao Mei, Yu Zhang, Chaofan Yang, Ruizhe Shi, Xiao-Hui Yuan
|
2025
|
View Paper |
Crafting Synthetic Realities: Examining Visual Realism and Misinformation Potential of Photorealistic AI-Generated Images
|
Qiyao Peng, Yingdan Lu, Yilang Peng, Sijia Qian, Xinyi Liu, Cuihua Shen
|
2024
|
View Paper |
Title | Authors | Year | Actions |
---|---|---|---|
Mind in Motion: how action shapes thought: by B Tversky, New York, Basic Books, 2019, 375 pp., $35.00 (£28.00, €33.00), ISBN 978 0 465 093069
|
Clare Davies
|
2024
|
View Paper |
BioCLIP: A Vision Foundation Model for the Tree of Life
|
Samuel Stevens, Jiaman Wu, Matthew J. Thompson, Elizabeth G. Campolongo, Chan Hee Song, David E. Carlyn, Li Dong, W. Dahdul, Charles V. Stewart, Tanya Y. Berger-Wolf, Wei-Lun Chao, Yu Su
|
2023
|
View Paper |
Getting aligned on representational alignment
|
Ilia Sucholutsky, Lukas Muttenthaler, Adrian Weller, Andi Peng, Andreea Bobu, Been Kim, Bradley C. Love, Erin Grant, Jascha Achterberg, J. B. Tenenbaum, Katherine M. Collins, Katherine L. Hermann, Kerem Oktar, Klaus Greff, M. Hebart, Nori Jacoby, Qiuyi Zhang, Raja Marjieh, Robert Geirhos, Sherol Chen, Simon Kornblith, Sunayana Rane, Talia Konkle, Thomas P. O’Connell, Thomas Unterthiner, Andrew Kyle Lampinen, Klaus-Robert Muller, Mariya Toneva, Thomas L. Griffiths
|
2023
|
View Paper |
Subjective visualization experiences: impact of visual design and experimental design
|
Laura Koesten, Drew Dimmery, Michael Gleicher, Torsten Moller
|
2023
|
View Paper |
Affective Visualization Design: Leveraging the Emotional Impact of Data
|
Xingyu Lan, Yanqiu Wu, Nan Cao
|
2023
|
View Paper |
VISAtlas: An Image-Based Exploration and Query System for Large Visualization Collections via Neural Image Embedding
|
Yilin Ye, Rong Huang, Weizhen Zeng
|
2022
|
View Paper |
VAID: Indexing View Designs in Visual Analytics System
|
Lu Ying, Aoyu Wu, Haotian Li, Zikun Deng, Ji Lan, Jiang Wu, Yong Wang, Huamin Qu, Dazhen Deng, Yingcai Wu
|
2022
|
View Paper |
Striking a Balance: Reader Takeaways and Preferences when Integrating Text and Charts
|
Chase Stokes, V. Setlur, Bridget Cogley, Arvind Satyanarayan, Marti A. Hearst
|
2022
|
View Paper |
BeauVis: A Validated Scale for Measuring the Aesthetic Pleasure of Visual Representations
|
Tingying He, Petra Isenberg, Raimund Dachselt, Tobias Isenberg
|
2022
|
View Paper |
P-Lite: A study of parallel coordinate plot literacy
|
Elif E. Firat, A. Denisova, Max L. Wilson, R. Laramee
|
2022
|
View Paper |
Interactive visualization literacy: The state-of-the-art
|
Elif E. Firat, Alark Joshi, R. Laramee
|
2022
|
View Paper |
A Critical Reflection on Visualization Research: Where Do Decision Making Tasks Hide?
|
Evanthia Dimara, J. Stasko
|
2021
|
View Paper |
Visualization as a stimulus domain for vision science
|
Ronald A. Rensink
|
2021
|
View Paper |
Guided Search 6.0: An updated model of visual search
|
J. Wolfe
|
2021
|
View Paper |
The meaning and structure of scenes
|
M. Võ
|
2021
|
View Paper |
Revisited: Comparison of Empirical Methods to Evaluate Visualizations Supporting Crafting and Assembly Purposes
|
Maximilian Weiß, Katrin Angerbauer, Alexandra Voit, Magdalena Schwarzl, M. Sedlmair, Sven Mayer
|
2020
|
View Paper |
SineStream: Improving the Readability of Streamgraphs by Minimizing Sine Illusion Effects
|
Chuan Bu, Quanjie Zhang, Qianwen Wang, Jian Zhang, M. Sedlmair, O. Deussen, Yunhai Wang
|
2020
|
View Paper |
A Survey of Text Alignment Visualization
|
Tariq Yousef, S. Jänicke
|
2020
|
View Paper |
A Simple Pipeline for Coherent Grid Maps
|
Wouter Meulemans, Max Sondag, B. Speckmann
|
2020
|
View Paper |
ShuttleSpace: Exploring and Analyzing Movement Trajectory in Immersive Visualization
|
Shuainan Ye, Zhutian Chen, Xiangtong Chu, Yifan Wang, Siwei Fu, Lejun Shen, Kun Zhou, Yingcai Wu
|
2020
|
View Paper |
Githru: Visual Analytics for Understanding Software Development History Through Git Metadata Analysis
|
Youngtaek Kim, Jaeyoung Kim, Hyeon Jeon, Young-Ho Kim, Hyunjoo Song, Bohyoung Kim, Jinwook Seo
|
2020
|
View Paper |
Implicit Multidimensional Projection of Local Subspaces
|
Rongzhen Bian, Yumeng Xue, Liang Zhou, Jian Zhang, Baoquan Chen, D. Weiskopf, Yunhai Wang
|
2020
|
View Paper |
Direct Volume Rendering with Nonparametric Models of Uncertainty
|
Tushar M. Athawale, Bo Ma, Elham Sakhaee, Chris R. Johnson, A. Entezari
|
2020
|
View Paper |
Data Visceralization: Enabling Deeper Understanding of Data Using Virtual Reality
|
Benjamin Lee, Dave Brown, Bongshin Lee, C. Hurter, S. Drucker, Tim Dwyer
|
2020
|
View Paper |
Toward Quantifying Ambiguities in Artistic Images
|
Xi Wang, Z. Bylinskii, Aaron Hertzmann, R. Pepperell
|
2020
|
View Paper |
Scalability of Network Visualisation from a Cognitive Load Perspective
|
Vahan Yoghourdjian, Yalong Yang, Tim Dwyer, Lawrence Lee, Michael Wybrow, K. Marriott
|
2020
|
View Paper |
Topology Density Map for Urban Data Visualization and Analysis
|
Zezheng Feng, Haotian Li, Wei Zeng, Shuang-Hua Yang, Huamin Qu
|
2020
|
View Paper |
SMAP: A Joint Dimensionality Reduction Scheme for Secure Multi-Party Visualization
|
Jiazhi Xia, Tianxiang Chen, Lei Zhang, Wei Chen, Yang Chen, X. Zhang, C. Xie, Tobias Schreck
|
2020
|
View Paper |
VIS30K: A Collection of Figures and Tables From IEEE Visualization Conference Publications
|
Jian Chen, Meng Ling, Rui Li, Petra Isenberg, Tobias Isenberg, M. Sedlmair, Torsten Möller, R. Laramee, Han-Wei Shen, Katharina Wünsche, Qiru Wang
|
2020
|
View Paper |
VisImages: A Large-scale, High-quality Image Corpus in Visualization Publications
|
Dazhen Deng, Yihong Wu, Xinhuan Shu, Mengye Xu, Jiang Wu, Siwei Fu, Yingcai Wu
|
2020
|
View Paper |
Treemap Literacy: A Classroom-Based Investigation
|
Elif E. Firat, A. Denisova, R. Laramee
|
2020
|
View Paper |
Modeling in the Time of COVID-19: Statistical and Rule-based Mesoscale Models
|
Ngan Nguyen, Ondřej Strnad, T. Klein, Deng Luo, Ruwayda Alharbi, Peter Wonka, M. Maritan, P. Mindek, L. Autin, D. Goodsell, I. Viola
|
2020
|
View Paper |
Broadening Intellectual Diversity in Visualization Research Papers
|
Bongshin Lee, Kate Isaacs, D. Szafir, G. Marai, C. Turkay, Melanie Tory, Sheelagh Carpendale, A. Endert, T. Rhyne
|
2019
|
View Paper |
Sea of Genes: A Reflection on Visualising Metagenomic Data for Museums
|
Keshav Dasu, K. Ma, Joyce Ma, Jennifer Frazier
|
2019
|
View Paper |
Visual Exploration of Neural Document Embedding in Information Retrieval: Semantics and Feature Selection
|
Xiaonan Ji, Han-Wei Shen, Alan Ritter, R. Machiraju, Po-Yin Yen
|
2019
|
View Paper |
The State of the Art in Visualizing Multivariate Networks
|
C. Nobre, Miriah D. Meyer, M. Streit, A. Lex
|
2019
|
View Paper |
VizNet: Towards A Large-Scale Visualization Learning and Benchmarking Repository
|
K. Hu, Snehalkumar `Neil' Gaikwad, Madelon Hulsebos, Michiel A. Bakker, Emanuel Zgraggen, César A. Hidalgo, Tim Kraska, Guoliang Li, Arvind Satyanarayan, Çağatay Demiralp
|
2019
|
View Paper |
A Survey of Information Visualization Books
|
Dylan Rees, R. Laramee
|
2019
|
View Paper |
BitExTract: Interactive Visualization for Extracting Bitcoin Exchange Intelligence
|
Xuanwu Yue, Xinhuan Shu, Xinyu Zhu, Xinnan Du, Zheqing Yu, D. Papadopoulos, Siyuan Liu
|
2019
|
View Paper |
Vega-Lite: A Grammar of Interactive Graphics
|
Arvind Satyanarayan, Dominik Moritz, Kanit Wongsuphasawat, Jeffrey Heer
|
2018
|
View Paper |
Formalizing Visualization Design Knowledge as Constraints: Actionable and Extensible Models in Draco
|
Dominik Moritz, Chenglong Wang, Greg L. Nelson, Halden Lin, Adam M. Smith, Bill Howe, Jeffrey Heer
|
2018
|
View Paper |
Toward A Deep Understanding of What Makes a Scientific Visualization Memorable
|
Rui Li, Jian Chen
|
2018
|
View Paper |
This looks like that: deep learning for interpretable image recognition
|
Chaofan Chen, Oscar Li, A. Barnett, Jonathan Su, C. Rudin
|
2018
|
View Paper |
Visual Complexity and Affect: Ratings Reflect More Than Meets the Eye
|
C. Madan, J. Bayer, M. Gamer, T. Lonsdorf, T. Sommer
|
2018
|
View Paper |
The Unreasonable Effectiveness of Deep Features as a Perceptual Metric
|
Richard Zhang, Phillip Isola, Alexei A. Efros, Eli Shechtman, Oliver Wang
|
2018
|
View Paper |
Making Data Visual
|
Danyel Fisher, Miriah D. Meyer
|
2017
|
View Paper |
Beagle: Automated Extraction and Interpretation of Visualizations from the Web
|
L. Battle, Peitong Duan, Zachery Miranda, Dana Mukusheva, Remco Chang, M. Stonebraker
|
2017
|
View Paper |
Position statement: The case for a visualization performance benchmark
|
L. Battle, Remco Chang, Jeffrey Heer, M. Stonebraker
|
2017
|
View Paper |
Vispubdata.org: A Metadata Collection About IEEE Visualization (VIS) Publications
|
Petra Isenberg, Florian Heimerl, Steffen Koch, Tobias Isenberg, Panpan Xu, Charles D. Stolper, M. Sedlmair, Jian Chen, Torsten Möller, J. Stasko
|
2017
|
View Paper |
Unlocking Super Bowl Insights: Weighted Word Embeddings for Twitter Sentiment Classification
|
Xiangfeng Dai, R. Prout
|
2016
|
View Paper |
Arcs, Angles, or Areas: Individual Data Encodings in Pie and Donut Charts
|
Drew Skau, Robert Kosara
|
2016
|
View Paper |
Time Curves: Folding Time to Visualize Patterns of Temporal Evolution in Data
|
Benjamin Bach, Conglei Shi, Nicolas Heulot, T. Madhyastha, T. Grabowski, Pierre Dragicevic
|
2016
|
View Paper |
Text visualization techniques: Taxonomy, visual survey, and community insights
|
Kostiantyn Kucher, A. Kerren
|
2015
|
View Paper |
Thinking fast and slow.
|
N. McGlynn
|
2014
|
View Paper |
Visualization Analysis and Design
|
T. Munzner
|
2014
|
View Paper |
Visualization as Seen through its Research Paper Keywords
|
Petra Isenberg, Tobias Isenberg, M. Sedlmair, Jian Chen, Torsten Möller
|
2014
|
View Paper |
What Makes a Visualization Memorable?
|
M. Borkin, Azalea A. Vo, Z. Bylinskii, Phillip Isola, Shashank Sunkavalli, A. Oliva, H. Pfister
|
2013
|
View Paper |
A Systematic Review on the Practice of Evaluating Visualization
|
Tobias Isenberg, Petra Isenberg, Jing Chen, M. Sedlmair, Torsten Möller
|
2013
|
View Paper |
Evaluation of alternative glyph designs for time series data in a small multiple setting
|
Johannes Fuchs, Fabian Fischer, Florian Mansmann, E. Bertini, Petra Isenberg
|
2013
|
View Paper |
Visualization and Visual Analysis of Multifaceted Scientific Data: A Survey
|
J. Kehrer, H. Hauser
|
2013
|
View Paper |
Spatial Text Visualization Using Automatic Typographic Maps
|
S. Afzal, Ross Maciejewski, Yun Jang, N. Elmqvist, D. Ebert
|
2012
|
View Paper |
Augmented Topological Descriptors of Pore Networks for Material Science
|
D. Sabino, D. Morozov, G. Weber, A. G. Bianchi, J. Sethian, E. .. Bethel
|
2012
|
View Paper |
Design Study Methodology: Reflections from the Trenches and the Stacks
|
M. Sedlmair, Miriah D. Meyer, T. Munzner
|
2012
|
View Paper |
Empirical Studies in Information Visualization: Seven Scenarios
|
Heidi Lam, E. Bertini, Petra Isenberg, C. Plaisant, Sheelagh Carpendale
|
2012
|
View Paper |
Flow Radar Glyphs—Static Visualization of Unsteady Flow with Uncertainty
|
Marcel Hlawatsch, P. Leube, W. Nowak, D. Weiskopf
|
2011
|
View Paper |
D³ Data-Driven Documents
|
M. Bostock, Vadim Ogievetsky, Jeffrey Heer
|
2011
|
View Paper |
Flexible Linked Axes for Multivariate Data Visualization
|
Jarry H. T. Claessen, J. V. Wijk
|
2011
|
View Paper |
ReVision: automated classification, analysis and redesign of chart images
|
M. Savva, Nicholas Kong, Arti Chhajta, Li Fei-Fei, Maneesh Agrawala, Jeffrey Heer
|
2011
|
View Paper |
Visualization of Time-Oriented Data
|
W. Aigner, S. Miksch, H. Schumann, C. Tominski
|
2011
|
View Paper |
DimStiller: Workflows for dimensional analysis and reduction
|
S. Ingram, T. Munzner, Veronika Irvine, Melanie Tory, Steven Bergner, Torsten Möller
|
2010
|
View Paper |
An exploratory study of co-located collaborative visual analytics around a tabletop display
|
Petra Isenberg, Danyel Fisher, M. Morris, K. Quinn, M. Czerwinski
|
2010
|
View Paper |
Semiology of Graphics - Diagrams, Networks, Maps
|
Jacques Bertin, William J. Berg
|
2010
|
View Paper |
Interactive Histology of Large-Scale Biomedical Image Stacks
|
W. Jeong, J. Schneider, S. Turney, B. Faulkner-Jones, Dominik Meyer, R. Westermann, R. Reid, J. Lichtman, H. Pfister
|
2010
|
View Paper |
Interactive Vector Field Feature Identification
|
Joel Daniels, Erik W. Anderson, L. G. Nonato, Cláudio T. Silva
|
2010
|
View Paper |
SparkClouds: Visualizing Trends in Tag Clouds
|
Bongshin Lee, N. Riche, Amy K. Karlson, Sheelash Carpendale
|
2010
|
View Paper |
IRIS: Illustrative Rendering for Integral Surfaces
|
Mathias Hummel, Christoph Garth, B. Hamann, H. Hagen, K. Joy
|
2010
|
View Paper |
Visualization by Proxy: A Novel Framework for Deferred Interaction with Volume Data
|
Anna Tikhonova, Carlos D. Correa, K. Ma
|
2010
|
View Paper |
Object Detection with Discriminatively Trained Part Based Models
|
Pedro F. Felzenszwalb, Ross B. Girshick, David A. McAllester, Deva Ramanan
|
2010
|
View Paper |
Evaluating the effectiveness of visualization techniques for schematic diagrams in maintenance tasks
|
Sung-ye Kim, I. Woo, Ross Maciejewski, D. Ebert, T. Ropp, Krystal M. Thomas
|
2010
|
View Paper |
Interactive Data Visualization: Foundations, Techniques, and Applications
|
M. Ward, G. Grinstein, D. Keim
|
2010
|
View Paper |
A tour through the visualization zoo
|
Jeffrey Heer, M. Bostock, Vadim Ogievetsky
|
2010
|
View Paper |
Bubble Sets: Revealing Set Relations with Isocontours over Existing Visualizations
|
C. Collins, Gerald Penn, M. Carpendale
|
2009
|
View Paper |
Stacked Graphs – Geometry & Aesthetics
|
Lee Byron, M. Wattenberg
|
2008
|
View Paper |
Recognition by association via learning per-exemplar distances
|
Tomasz Malisiewicz, Alexei A. Efros
|
2008
|
View Paper |
Show Me: Automatic Presentation for Visual Analysis
|
J. Mackinlay, P. Hanrahan, Chris Stolte
|
2007
|
View Paper |
Toward a Deeper Understanding of the Role of Interaction in Information Visualization
|
Ji Soo Yi, Y. Kang, J. Stasko, J. Jacko
|
2007
|
View Paper |
Visual Analysis of Conflicting Opinions
|
Chaomei Chen, Fidelia Ibekwe-Sanjuan, Eric SanJuan, C. Weaver
|
2006
|
View Paper |
An Atmospheric Visual Analysis and Exploration System
|
Yuyan Song, Jing Ye, Nikolai A. Svakhine, S. Lasher-Trapp, Mike Baldwin, D. Ebert
|
2006
|
View Paper |
Visualization with stylized line primitives
|
Carsten Stoll, S. Gumhold, H. Seidel
|
2005
|
View Paper |
Visualization in the Einstein Year 2005: a case study on explanatory and illustrative visualization of relativity and astrophysics
|
D. Weiskopf, Marc Borchers, Thomas Ertl, M. Falk, O. Fechtig, Regine Frank, Frank Grave, Andreas King, U. Kraus, Thomas Müller, H. Nollert, Isabel Rica Mendez, H. Ruder, C. Zahn, M. Zatloukal, T. Schafhitzel, S. Schär
|
2005
|
View Paper |
HOT-lines: tracking lines in higher order tensor fields
|
M. Hlawitschka, G. Scheuermann
|
2005
|
View Paper |
Low-level components of analytic activity in information visualization
|
R. Amar, James R. Eagan, J. Stasko
|
2005
|
View Paper |
Flow map layout
|
Doantam Phan, Ling Xiao, Ron B. Yeh, P. Hanrahan, T. Winograd
|
2005
|
View Paper |
An interactive 3D integration of parallel coordinates and star glyphs
|
Elena Fanea, Sheelagh Carpendale, Tobias Isenberg
|
2005
|
View Paper |
Adaptive extraction of time-varying isosurfaces
|
B. Gregorski, J. Senecal, M. Duchaineau, K. Joy
|
2004
|
View Paper |
Image quality assessment: from error visibility to structural similarity
|
Zhou Wang, A. Bovik, H. Sheikh, Eero P. Simoncelli
|
2004
|
View Paper |
Image based flow visualization for curved surfaces
|
J. V. Wijk
|
2003
|
View Paper |
Ordered and quantum treemaps: Making effective use of 2D space to display hierarchies
|
B. Bederson, B. Shneiderman, M. Wattenberg
|
2002
|
View Paper |
Ordered treemap layouts
|
B. Shneiderman, M. Wattenberg
|
2001
|
View Paper |
Interactive problem solving via algorithm visualization
|
P. Pu, D. Lalanne
|
2000
|
View Paper |
A continuous clustering method for vector fields
|
H. Garcke, T. Preußer, M. Rumpf, A. Telea, U. Weikard, J. V. Wijk
|
2000
|
View Paper |
Isosurfacing in higher dimensions
|
Praveen Bhaniramka, R. Wenger, R. Crawfis
|
2000
|
View Paper |
Simplification of surface annotations
|
F. Suits, James T. Klosowski, William P. Horn, G. Lecina
|
2000
|
View Paper |
A flow-guided streamline seeding strategy
|
Vivek Verma, D. Kao, A. Pang
|
2000
|
View Paper |
WEAVE: a system for visually linking 3-D and statistical visualizations applied to cardiac simulation and measurement data
|
D. Gresh, B. Rogowitz, R. Winslow, D. Scollan, C. Yung
|
2000
|
View Paper |
Visual Explanations: Images and Quantities, Evidence and Narrative
|
M. Gluck
|
1997
|
View Paper |
Computing Local Surface Orientation and Shape from Texture for Curved Surfaces
|
Jitendra Malik, R. Rosenholtz
|
1997
|
View Paper |
The binding problem
|
A. Treisman
|
1996
|
View Paper |
Interactive 3D visualization of actual anatomy and simulated chemical time-course data for fish
|
P. Rheingans, M. Marietta, J. Nichols
|
1995
|
View Paper |
A rule-based tool for assisting colormap selection
|
L. Bergman, B. Rogowitz, L. Treinish
|
1995
|
View Paper |
A classification of visual representations
|
Gerald L. Lohse, K. Biolsi, N. Walker, H. Rueter
|
1994
|
View Paper |
Typologies As a Unique Form Of Theory Building: Toward Improved Understanding and Modeling
|
D. Doty, William H. Glick
|
1994
|
View Paper |
Things That Make Us Smart: Defending Human Attributes In The Age Of The Machine
|
D. Norman
|
1993
|
View Paper |
Respects for similarity
|
D. Medin, R. Goldstone, D. Gentner
|
1993
|
View Paper |
The asymptotic decider: resolving the ambiguity in marching cubes
|
G. Nielson, B. Hamann
|
1991
|
View Paper |
Surface representations of two- and three-dimensional fluid flow topology
|
James Helman, L. Hesselink
|
1990
|
View Paper |
A Computational Approach to Edge Detection
|
J. Canny
|
1986
|
View Paper |
Automating the design of graphical presentations of relational information
|
J. Mackinlay
|
1986
|
View Paper |
Attention, similarity, and the identification-categorization relationship.
|
R. Nosofsky
|
1986
|
View Paper |
Graphical Perception and Graphical Methods for Analyzing Scientific Data
|
W. Cleveland, R. McGill
|
1985
|
View Paper |
Context theory of classification learning.
|
D. Medin, M. M. Schaffer
|
1978
|
View Paper |
A Taxonomy of Treemap Visualization Techniques
|
Willy Scheibel, Matthias Trapp, Daniel Limberger, J. Döllner
|
2020
|
View Paper |
“IEEE VIS figures and tables image dataset,”
|
2020
|
||
Ensemble Perception
|
D. Whitney, A. Leib
|
2018
|
View Paper |
EdWordle: Consistency-Preserving Word Cloud Editing
|
Yunhai Wang, Xiaowei Chu, Chen Bao, Lifeng Zhu, O. Deussen, Baoquan Chen, M. Sedlmair
|
2018
|
View Paper |
Visual Interaction with Dimensionality Reduction: A Structured Literature Analysis
|
D. Sacha, Leishi Zhang, M. Sedlmair, J. Lee, J. Peltonen, D. Weiskopf, S. North, D. Keim
|
2017
|
View Paper |
Psychophysics: A Practical Introduction (2nd Ed.).
|
A. Cecala
|
2016
|
View Paper |
“The pitfalls of visual representations: A review and classification of common errors made while designing and interpreting visualizations,”
|
2015
|
||
Glyph-based Visualization: Foundations, Design Guidelines, Techniques and Applications
|
R. Borgo, J. Kehrer, David H. S. Chung, E. Maguire, R. Laramee, H. Hauser, M. Ward, Min Chen
|
2013
|
View Paper |
The Philosophical Investigations
|
M. Engelmann
|
2013
|
View Paper |
Wizualizacja i poznanie: zrysowywanie rzeczy razem
|
Bruno Latour
|
2012
|
View Paper |
Visualization Techniques
|
E. Badoer
|
2012
|
View Paper |
Data Representations, Transformations, and Statistics for Visual Reasoning
|
2011
|
||
Graphically Speaking Treevis.net: A Tree Visualization Reference
|
Hans-Jörg Schulz
|
2011
|
View Paper |
Analysis-aware modeling: Understanding quality considerations in modeling for isogeometric analysis
|
E. Cohen, T. Martin, R. Kirby, T. Lyche, R. Riesenfeld
|
2010
|
View Paper |
Multivariate Data Glyphs: Principles and Practice
|
M. Ward
|
2008
|
View Paper |
Constructing grounded theory : a practical guide through qualitative analysis
|
Kathy Charmaz
|
2006
|
View Paper |
Building the gist of a scene: the role of global image features in recognition.
|
A. Oliva, A. Torralba
|
2006
|
View Paper |
Overview of Flow Visualization
|
D. Weiskopf, G. Erlebacher
|
2005
|
View Paper |
The Grammar of Graphics , 2nd ed. New York
|
2005
|
||
Classification and Categorization: A Difference that Makes a Difference
|
E. Jacob
|
2004
|
View Paper |
Information Visualization: Perception for Design , 2nd ed. San Francisco: Morgan Kaufmann
|
2004
|
||
The language of graphics
|
V. Engelhardt
|
2002
|
View Paper |
Designing Pixel-Oriented Visualization Techniques: Theory and Applications
|
D. Keim
|
2000
|
View Paper |
ALCOVE: an exemplar-based connectionist model of category learning.
|
J. Kruschke
|
1992
|
View Paper |
Prototypes: Between Plato and Wittgenstein
|
T. Givón
|
1986
|
View Paper |
“Fundamental aspects of cognitive representation,”
|
1978
|
||
“Natural categories,”
|
1973
|
||
Graphic Presentation . New York
|
1939
|
||
He received the PhD degree in Computer Science from University of Munich, Germany in 2010. His specific research interests
|
|||
in interactive visualization environments for 3D spatial data as well as illustrative visualization and abstraction techniques
|
|||
terrains, isosurfaces, stream surfaces, volume rendering using transfer functions, slices through a volume
|
|||
exploring how people can most effectively work together when analyzing large and complex data sets on novel display technology such as small touchscreens, wall displays, or tabletops
|
|||
Fraser University, Canada
|
|||
grid or cells. network matrices, discrete heatmaps, scarf or strip plots, space-time cubes, or matrix-based network visualizations
|
Showing first page preview. Click "Open Full PDF" to view the complete paper.
Your comment contains inappropriate language and has been rejected.
Are you sure you want to remove this tag? This action cannot be undone.
Someone just favorited a paper!
Comments (0)