Publication
Metrics
AI Quick Summary
This paper proposes a concise typology of three decision-making tasks—choose, activate, and create—for data visualization, facilitating clear descriptions and discourse between visualization designers and domain experts. The authors demonstrate its effectiveness through case studies and interviews with visualization experts.
Paper Preview
Abstract
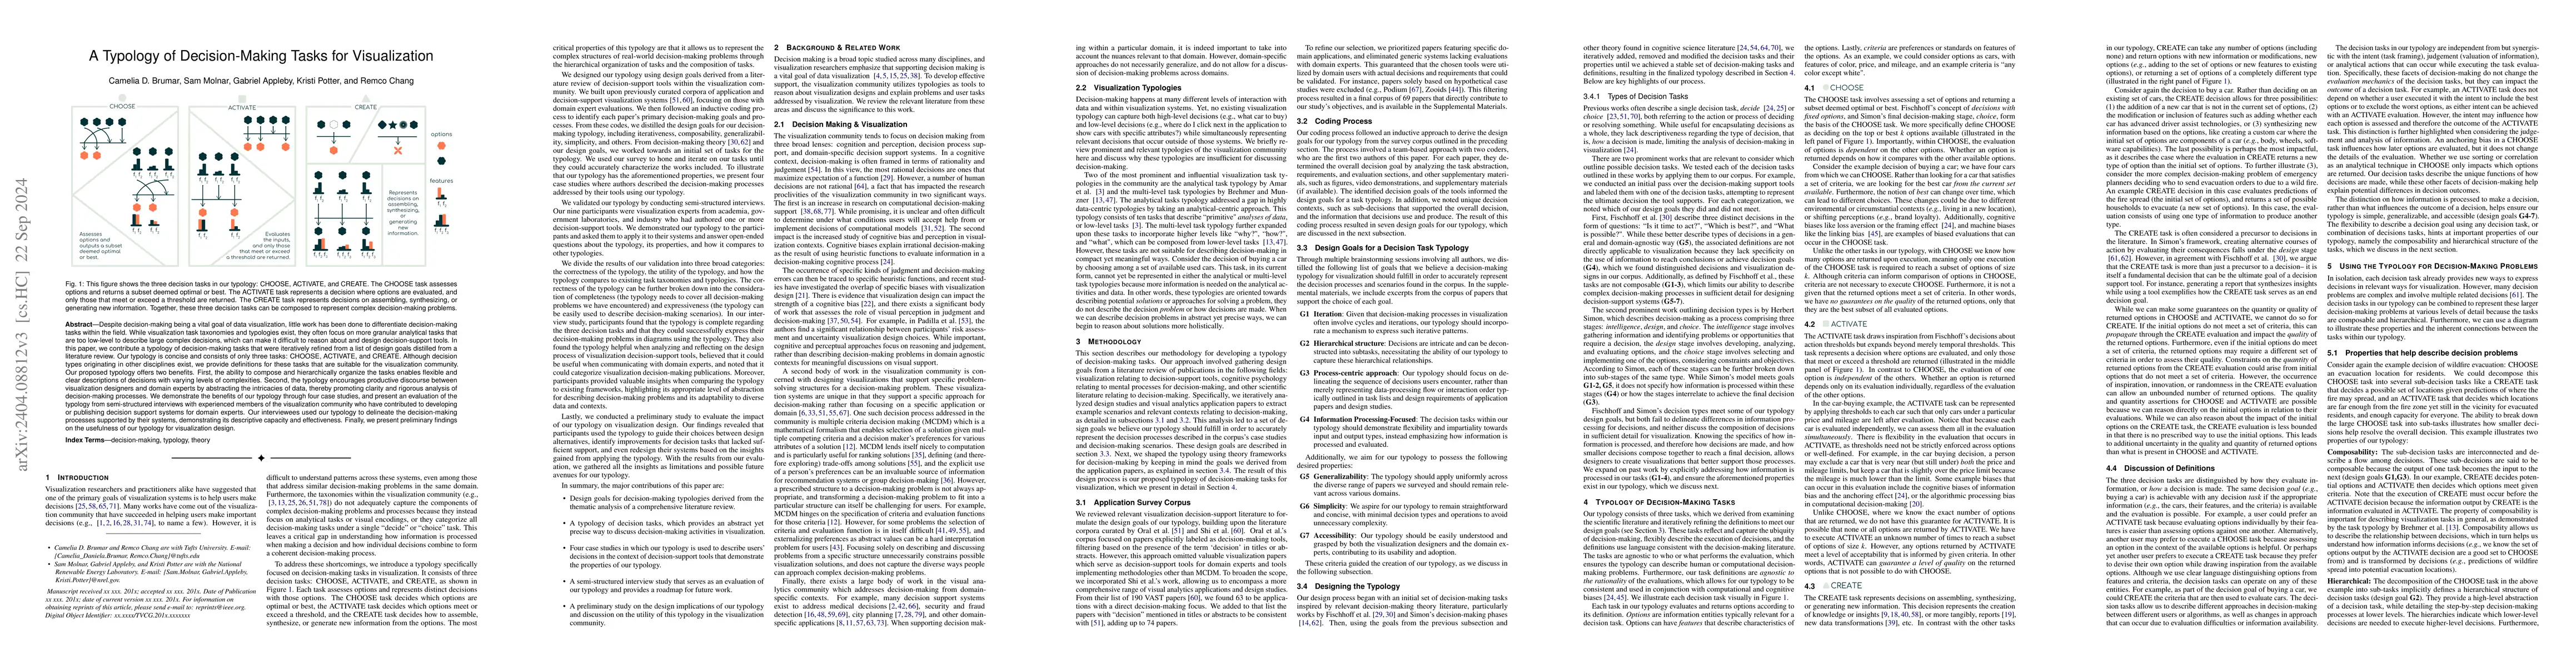
Despite decision-making being a vital goal of data visualization, little work has been done to differentiate the decision-making tasks within our field. While visualization task taxonomies and typologies exist, they are often too granular for describing complex decision goals and decision-making processes, thus limiting their potential use in designing decision-support tools. In this paper, we contribute a typology of decision-making tasks that were iteratively refined from a list of design goals distilled from a literature review. Our typology is concise and consists of only three tasks: choose, activate, and create. Originally proposed by the scientific community, we extend and provide definitions for these tasks that are suitable for the visualization community. Our proposed typology offers two benefits. First, it facilitates the composition of decisions using these three tasks, allowing for flexible and clear descriptions across varying complexities and domains. Second, diagrams created using this typology encourage productive discourse between visualization designers and domain experts by abstracting the intricacies of data, thereby promoting clarity and rigorous analysis of decision-making processes. We motivate the use of our typology through four case studies and demonstrate the benefits of our approach through semi-structured interviews conducted with experienced members of the visualization community, comprising academic and industry experts, who have contributed to developing or publishing decision support systems for domain experts. Our interviewees composed diagrams using our typology to delineate the decision-making processes that drive their decision-support tools, demonstrating its descriptive capacity and effectiveness.
AI Key Findings
Get AI-generated insights about this paper's methodology, results, significance, and more — seven facets brought into focus.
Impact
Paper Details
Authors
PDF Preview
Key Terms
Citation Network
Current paper (gray), citations (green), references (blue)
Display is limited for performance on very large graphs.
Discussion 0