Academic Profile
Statistics
Similar Authors
Papers on arXiv
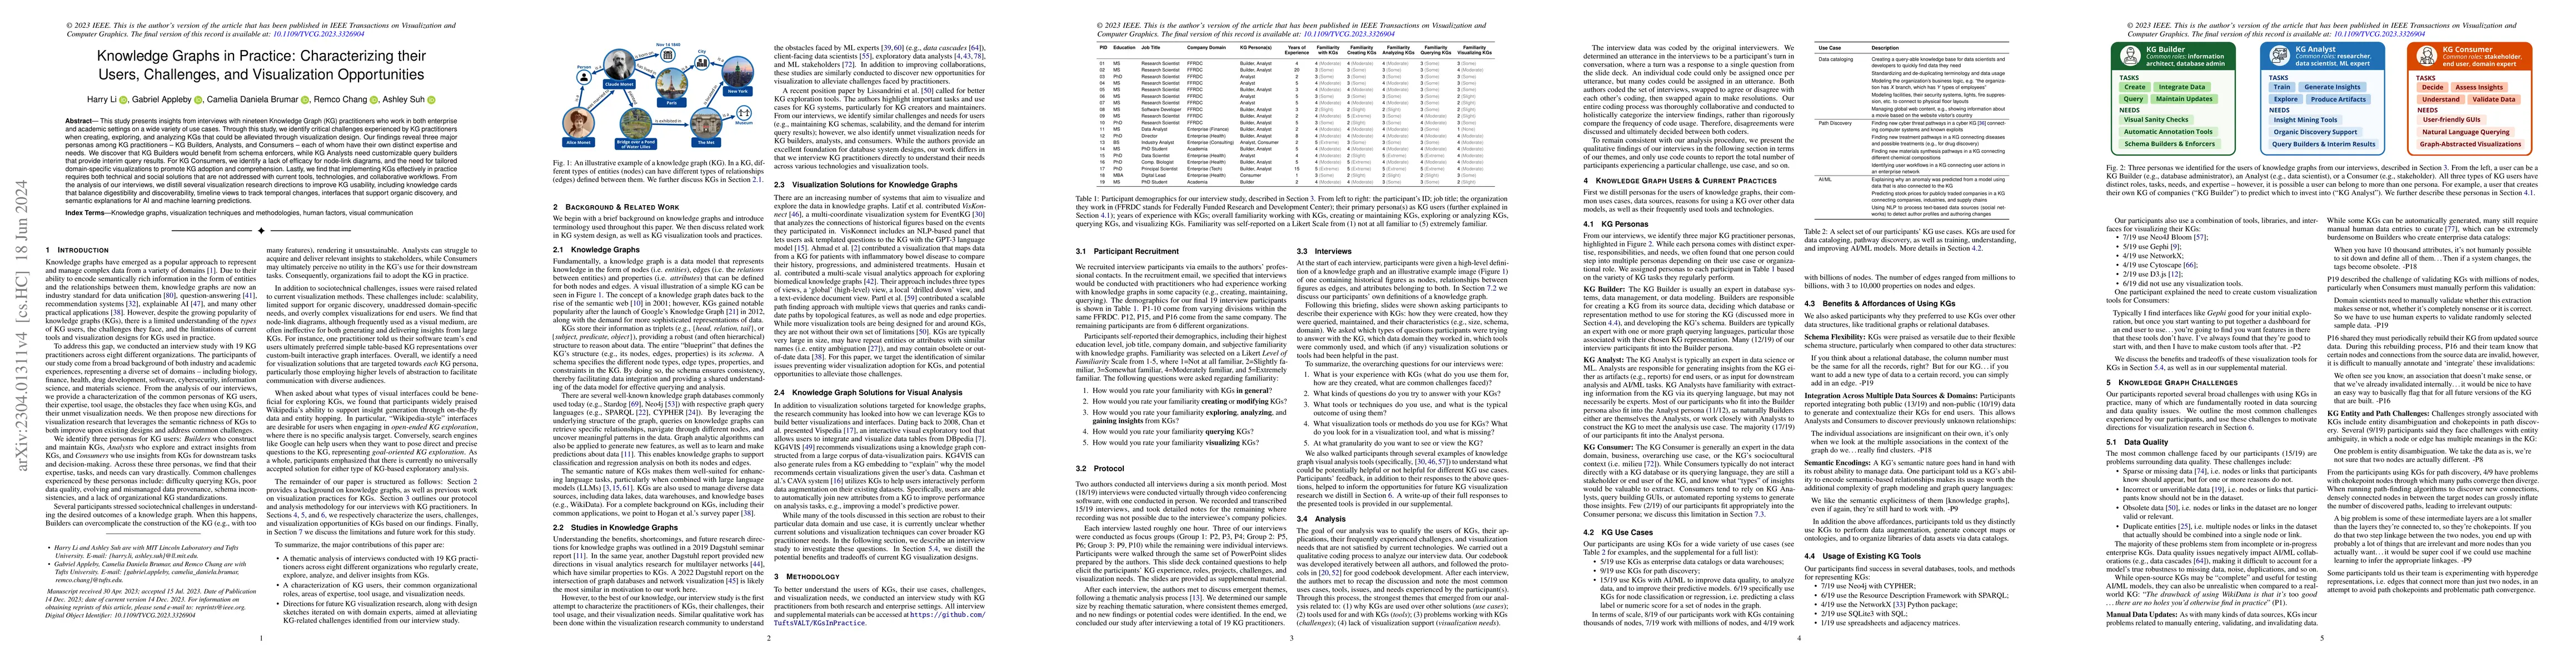
This study presents insights from interviews with nineteen Knowledge Graph (KG) practitioners who work in both enterprise and academic settings on a wide variety of use cases. Through this study, we i...
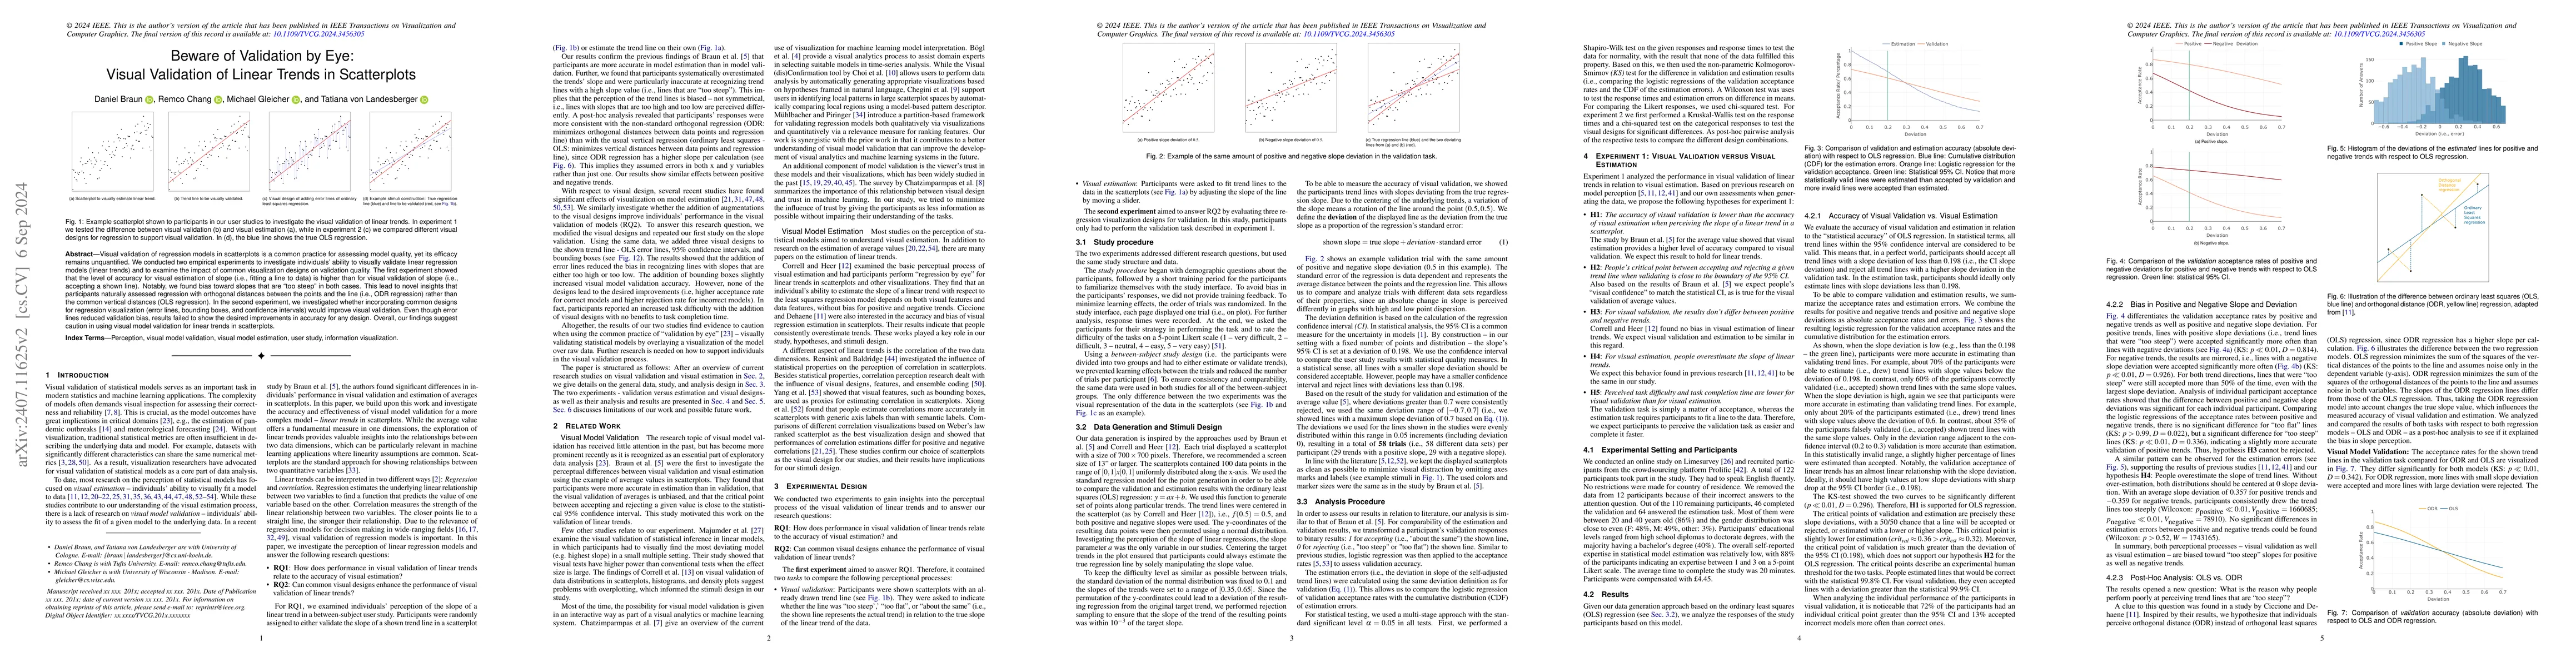
Visual validation of regression models in scatterplots is a common practice for assessing model quality, yet its efficacy remains unquantified. We conducted two empirical experiments to investigate in...
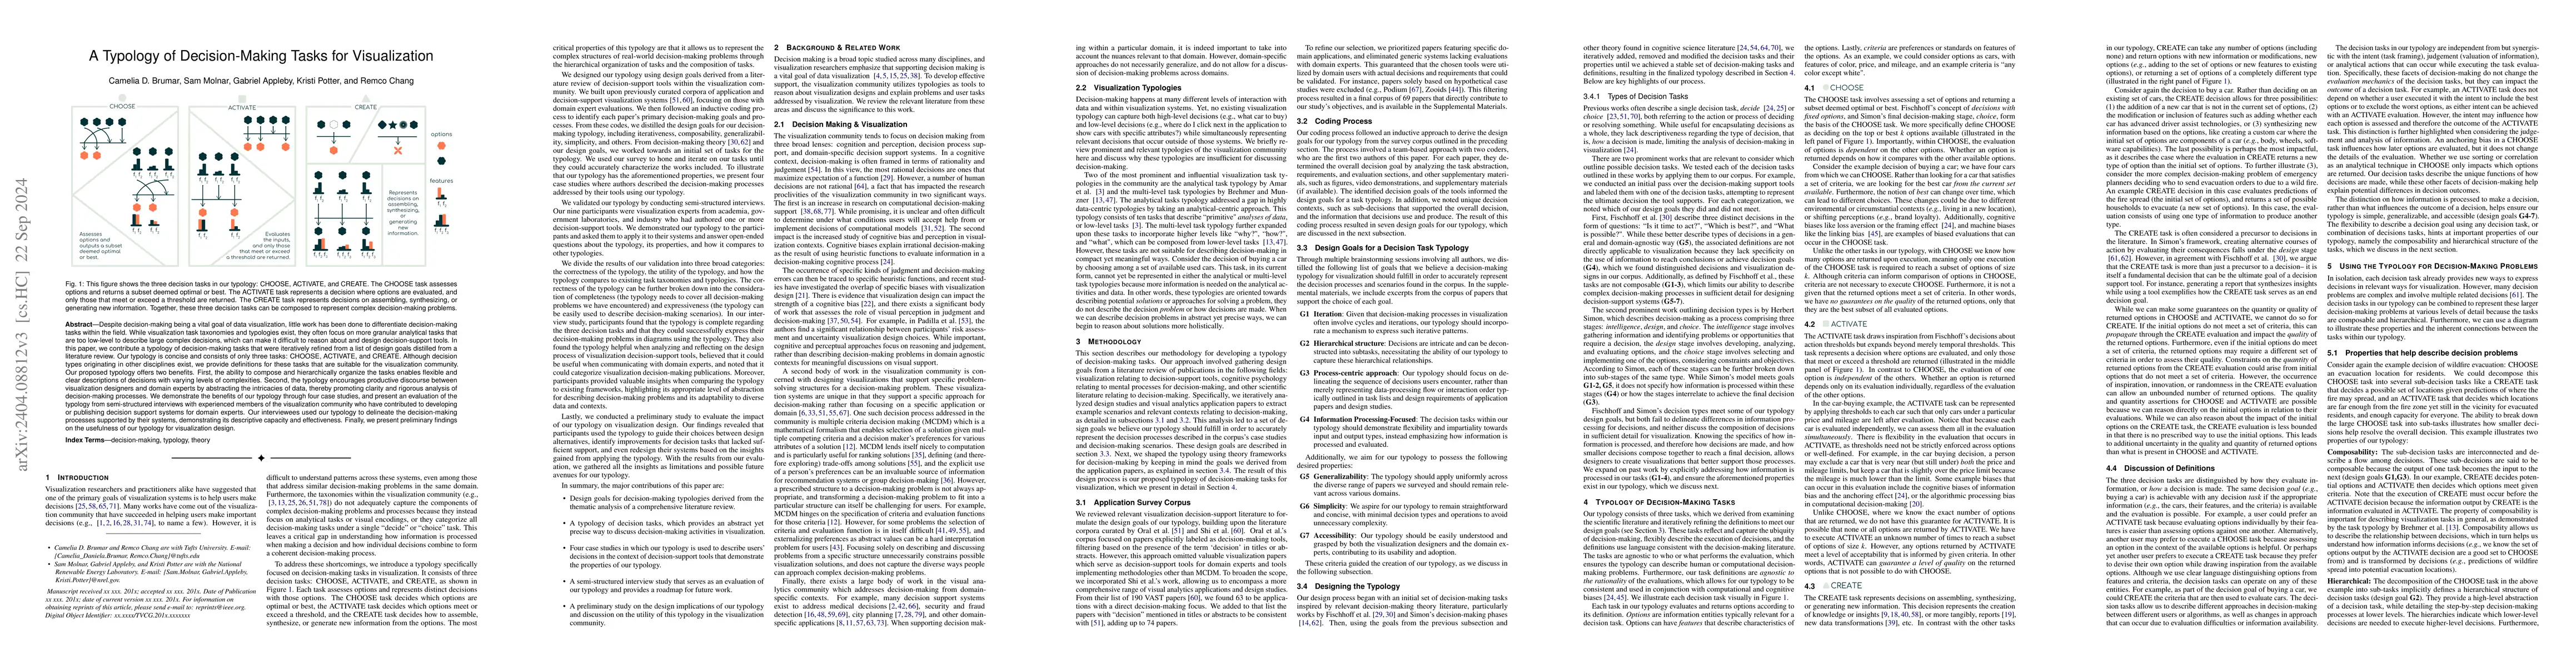
Despite decision-making being a vital goal of data visualization, little work has been done to differentiate the decision-making tasks within our field. While visualization task taxonomies and typol...
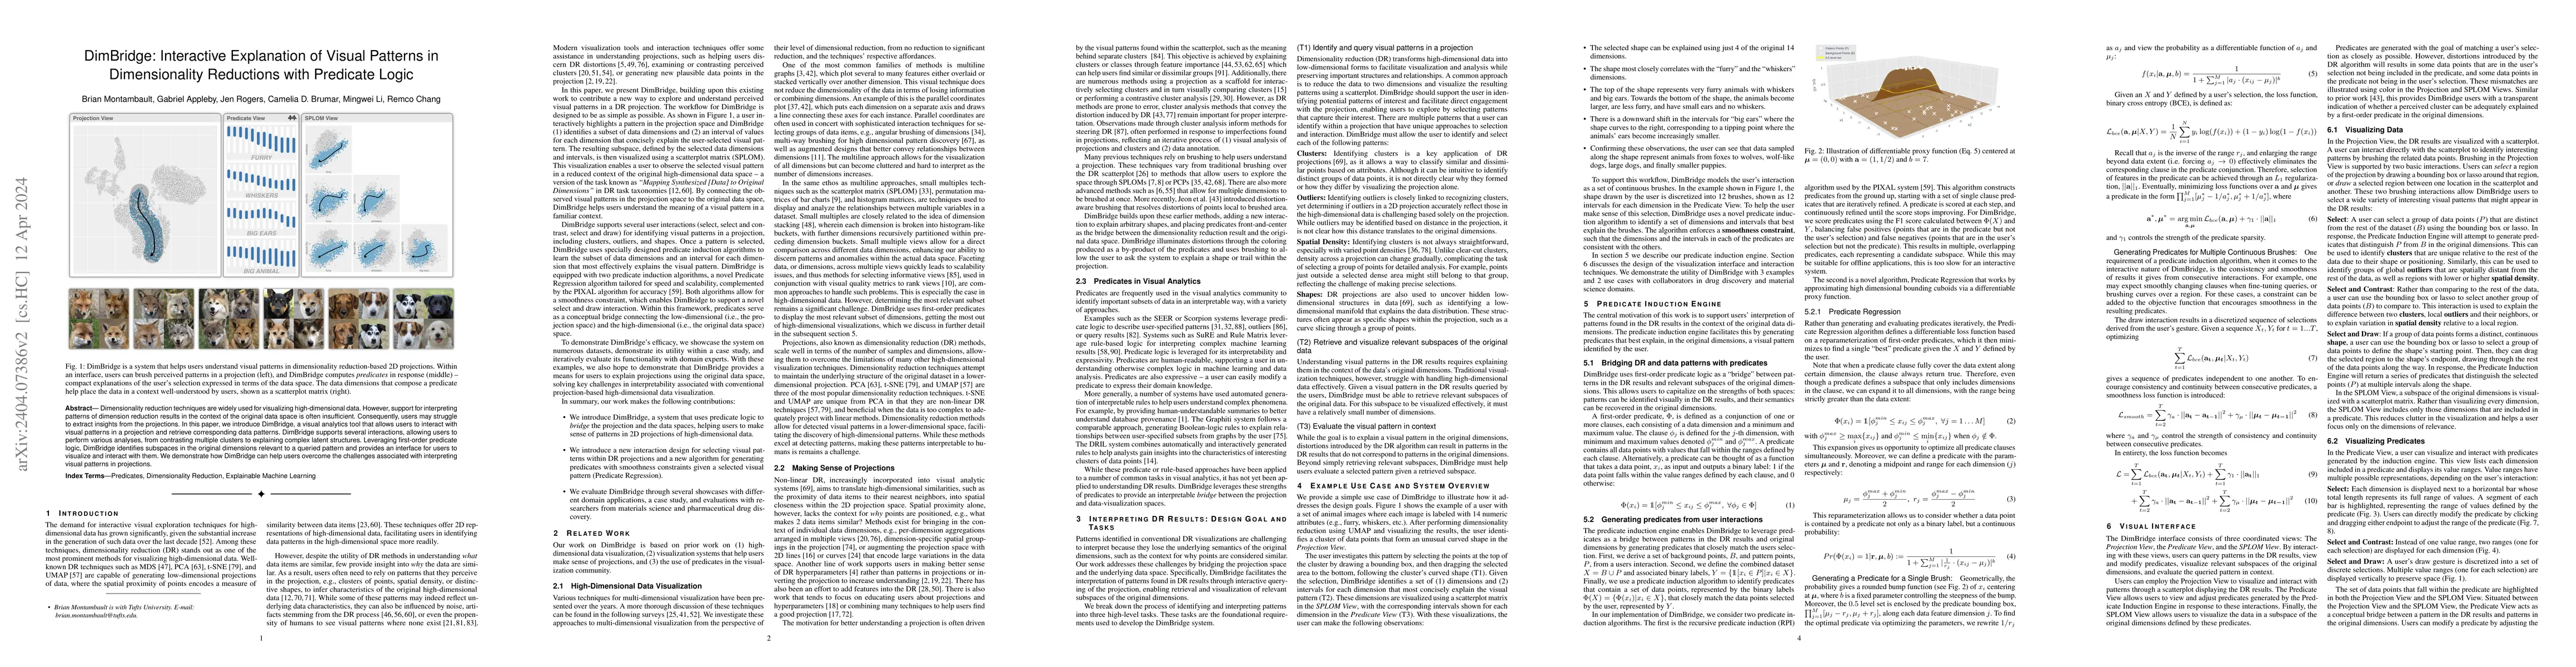
Dimensionality reduction techniques are widely used for visualizing high-dimensional data. However, support for interpreting patterns of dimension reduction results in the context of the original da...
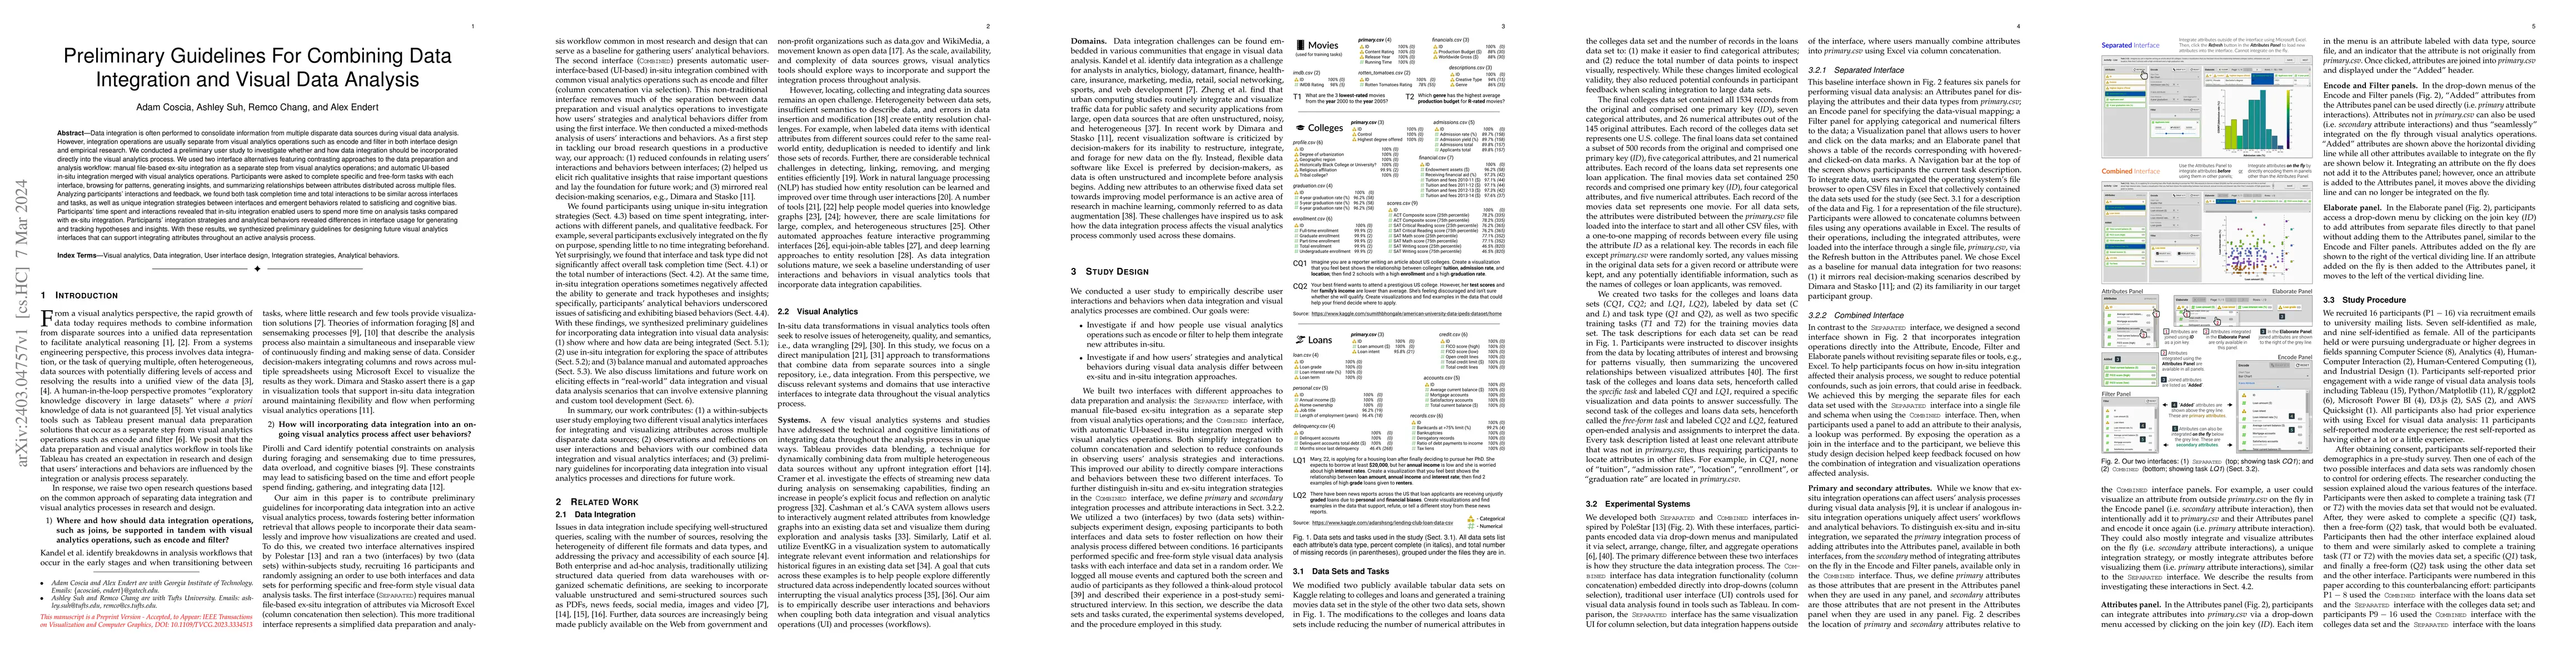
Data integration is often performed to consolidate information from multiple disparate data sources during visual data analysis. However, integration operations are usually separate from visual anal...
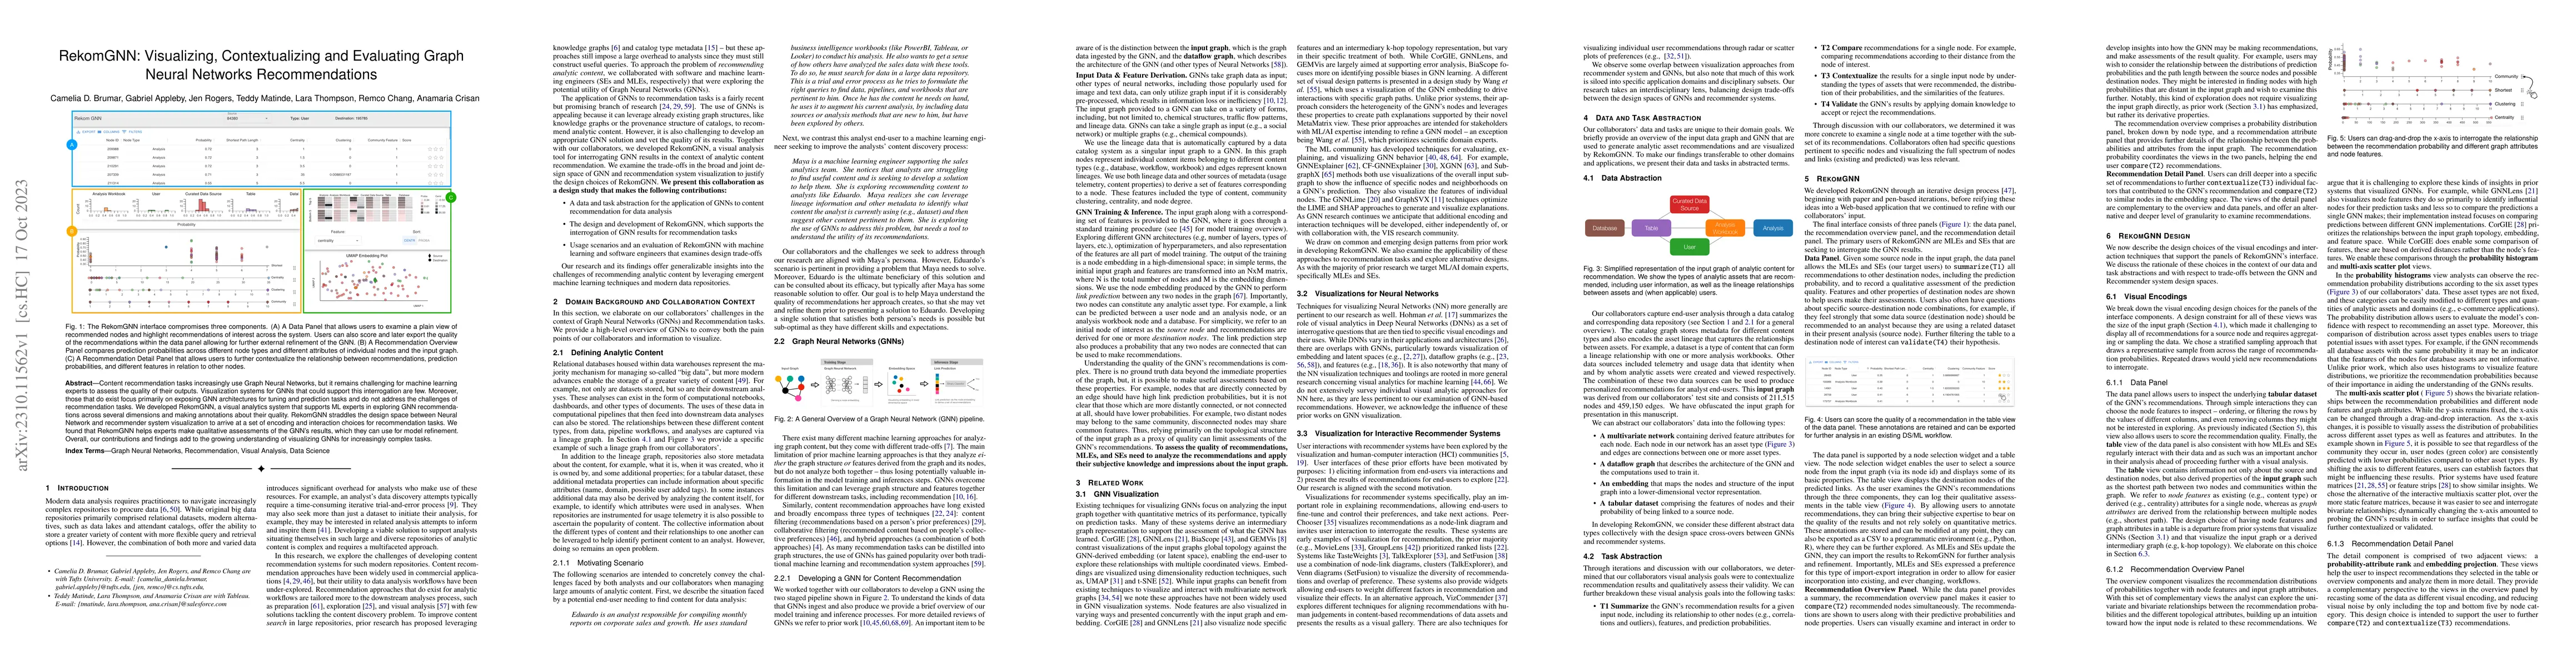
Content recommendation tasks increasingly use Graph Neural Networks, but it remains challenging for machine learning experts to assess the quality of their outputs. Visualization systems for GNNs th...
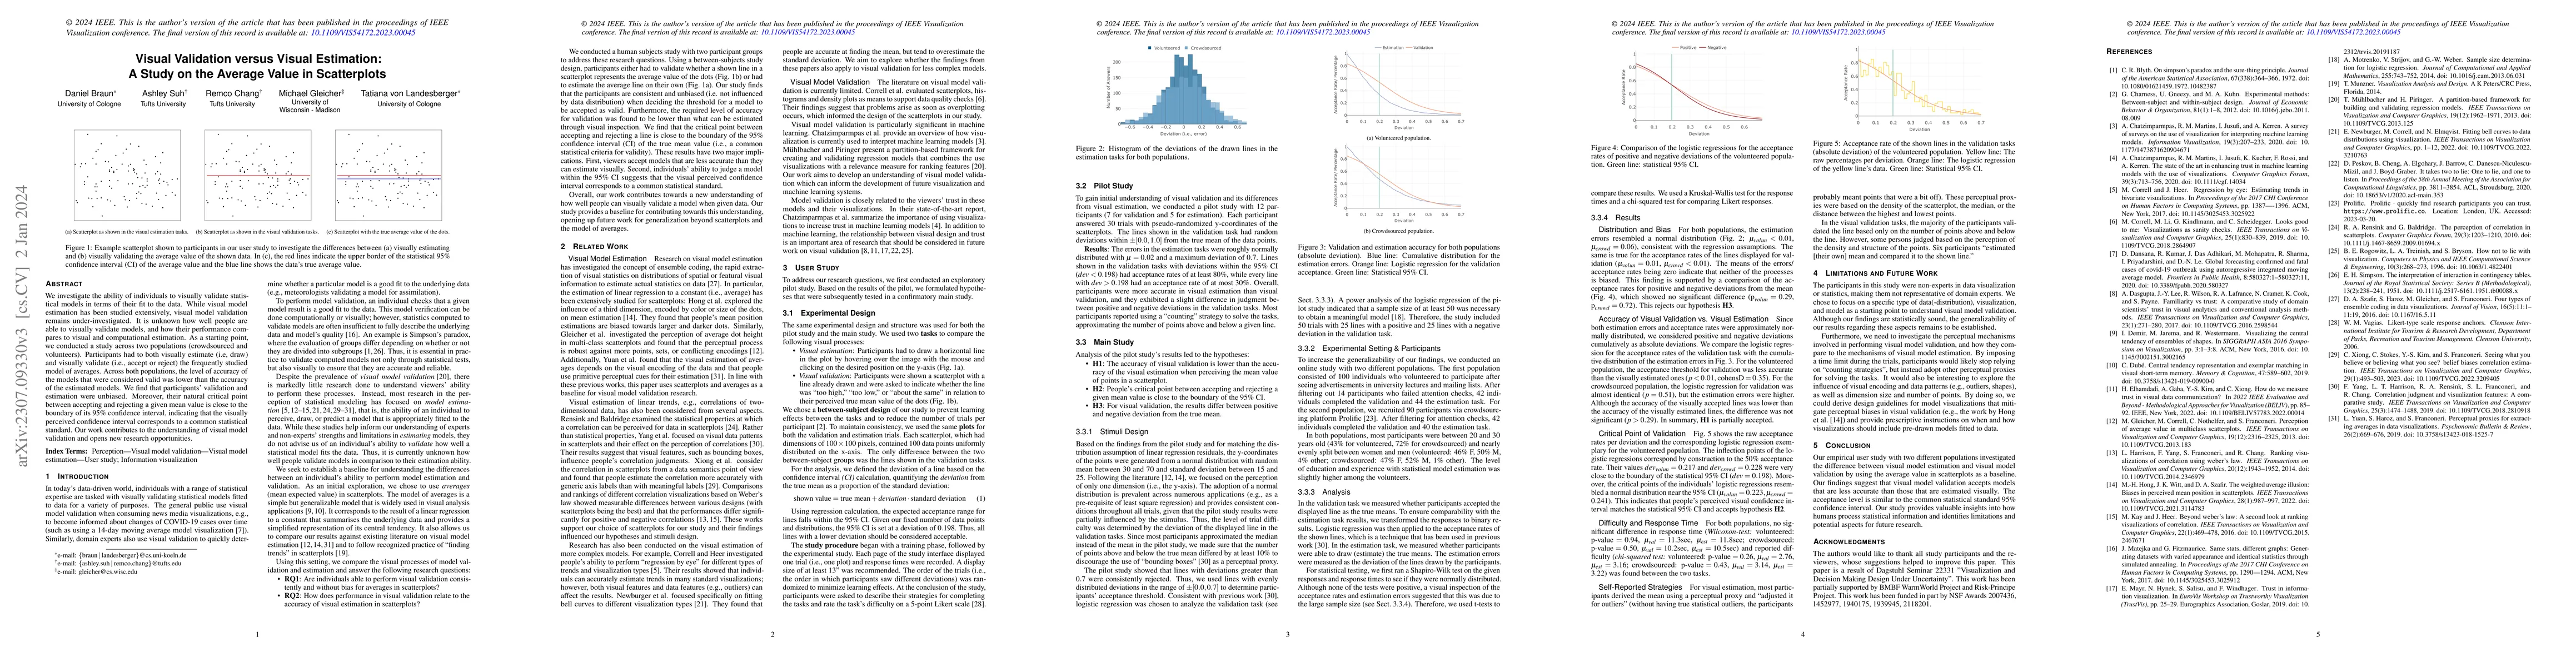
We investigate the ability of individuals to visually validate statistical models in terms of their fit to the data. While visual model estimation has been studied extensively, visual model validati...
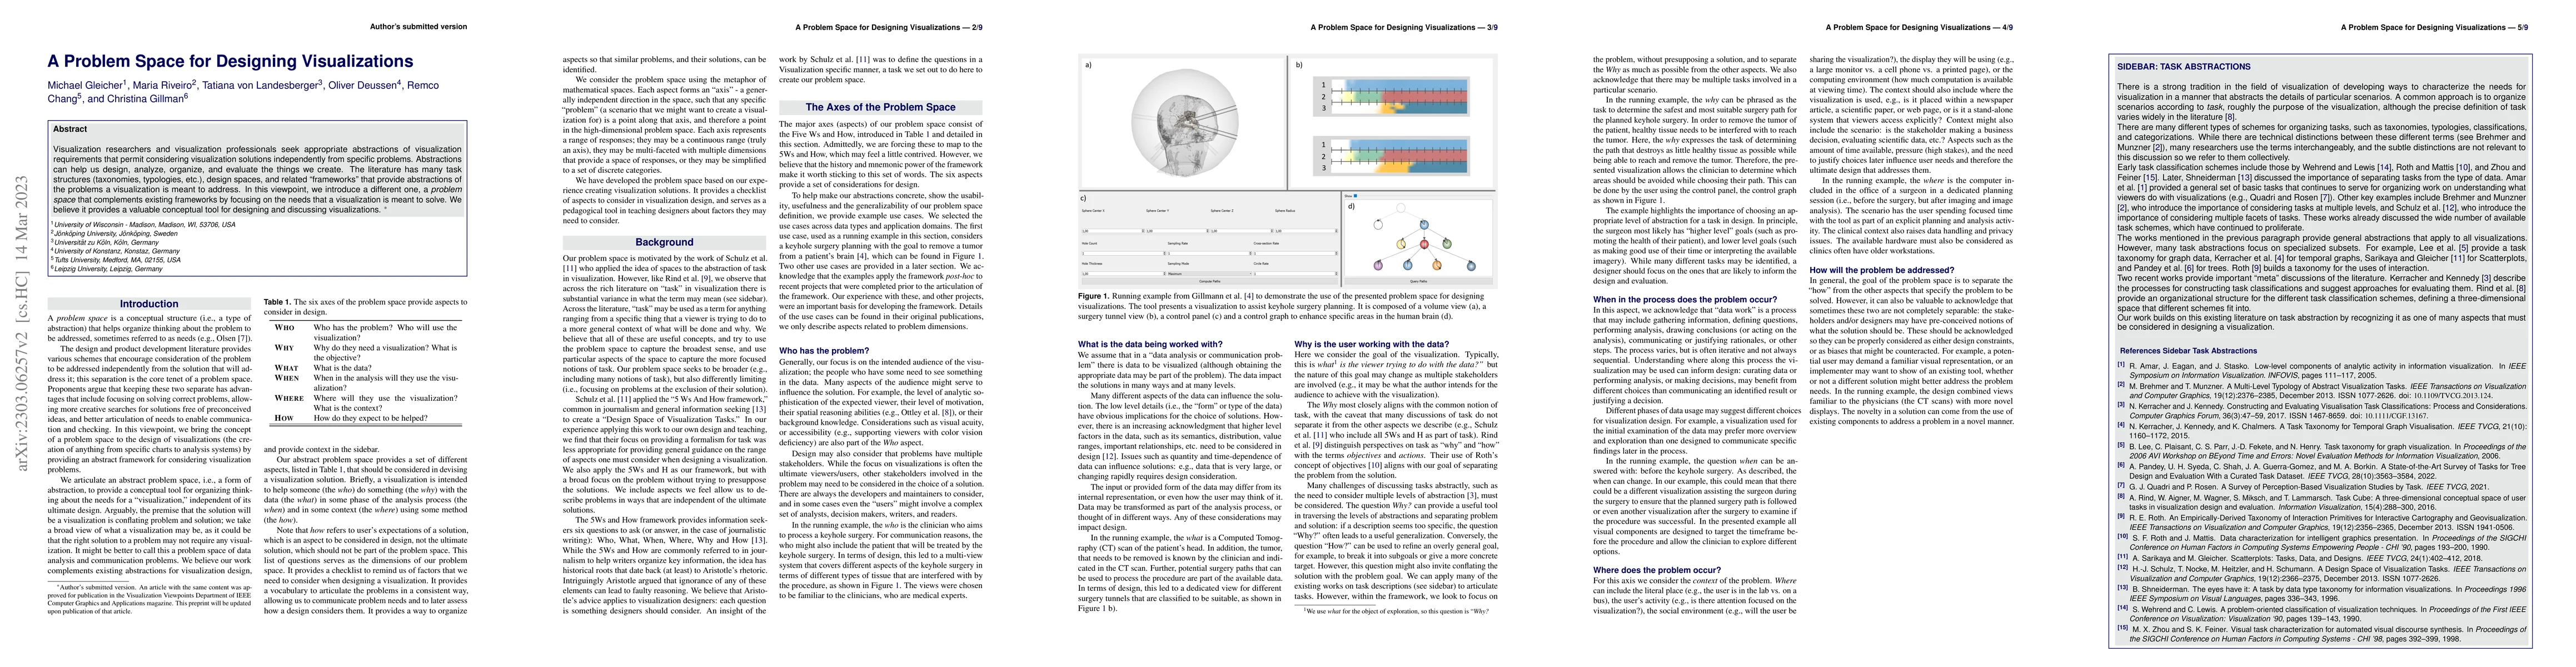
Visualization researchers and visualization professionals seek appropriate abstractions of visualization requirements that permit considering visualization solutions independently from specific prob...
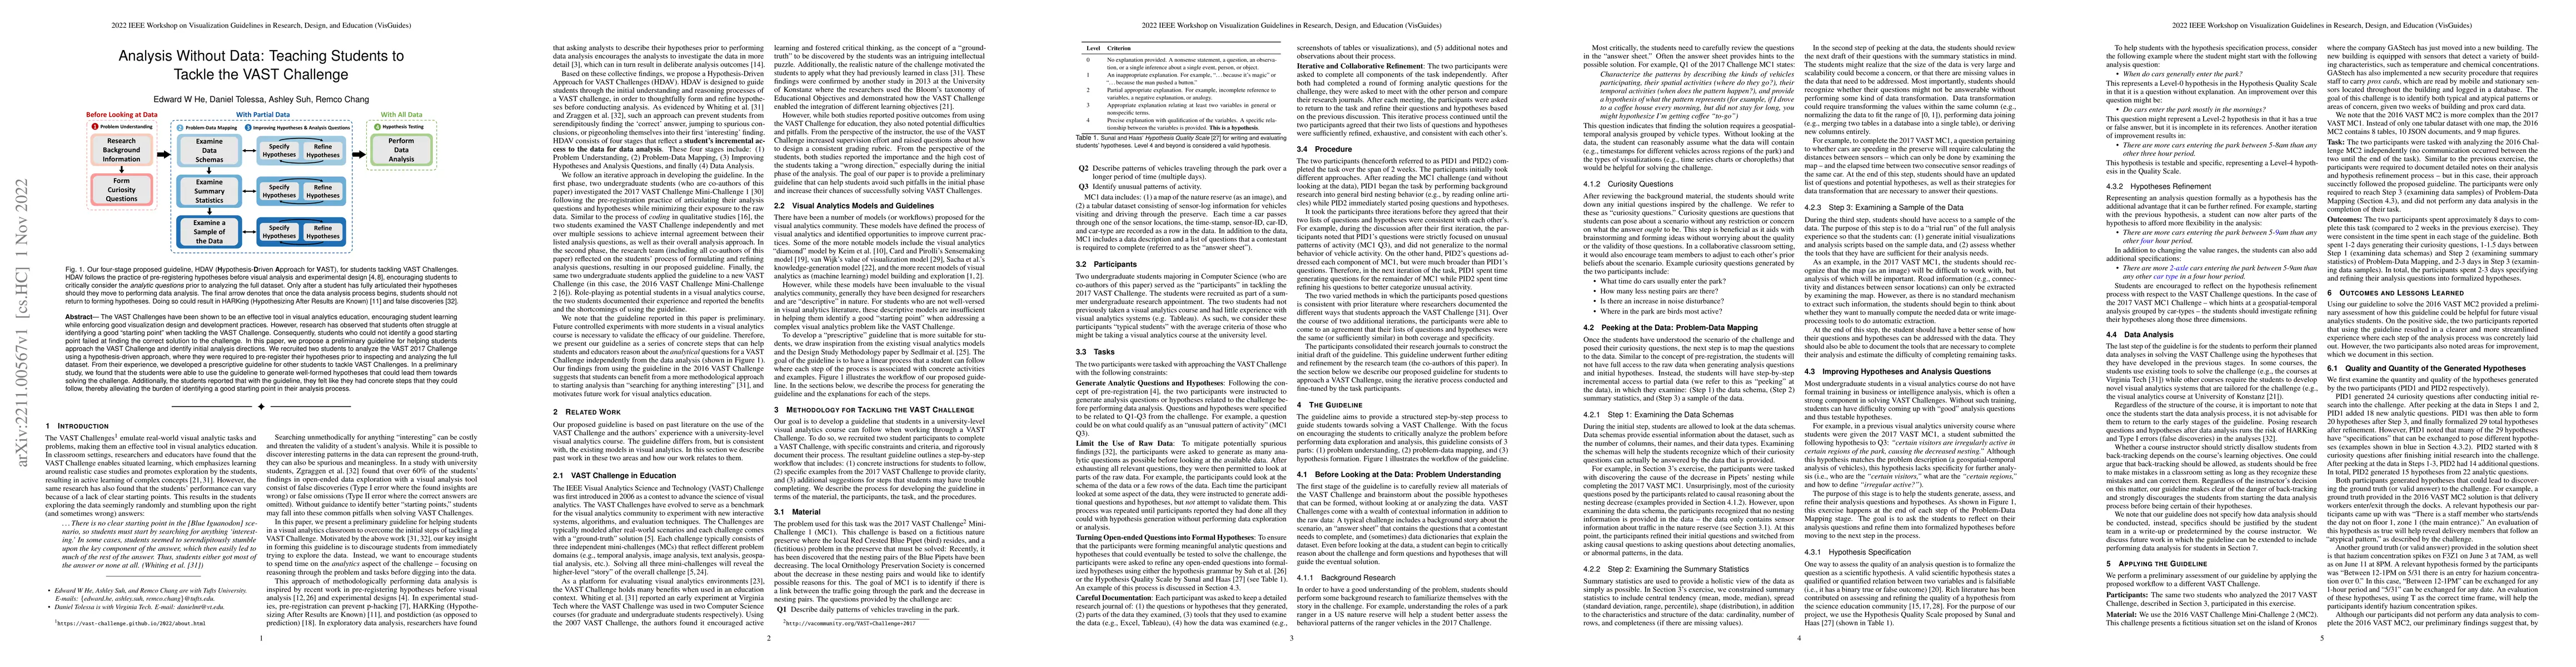
The VAST Challenges have been shown to be an effective tool in visual analytics education, encouraging student learning while enforcing good visualization design and development practices. However, ...
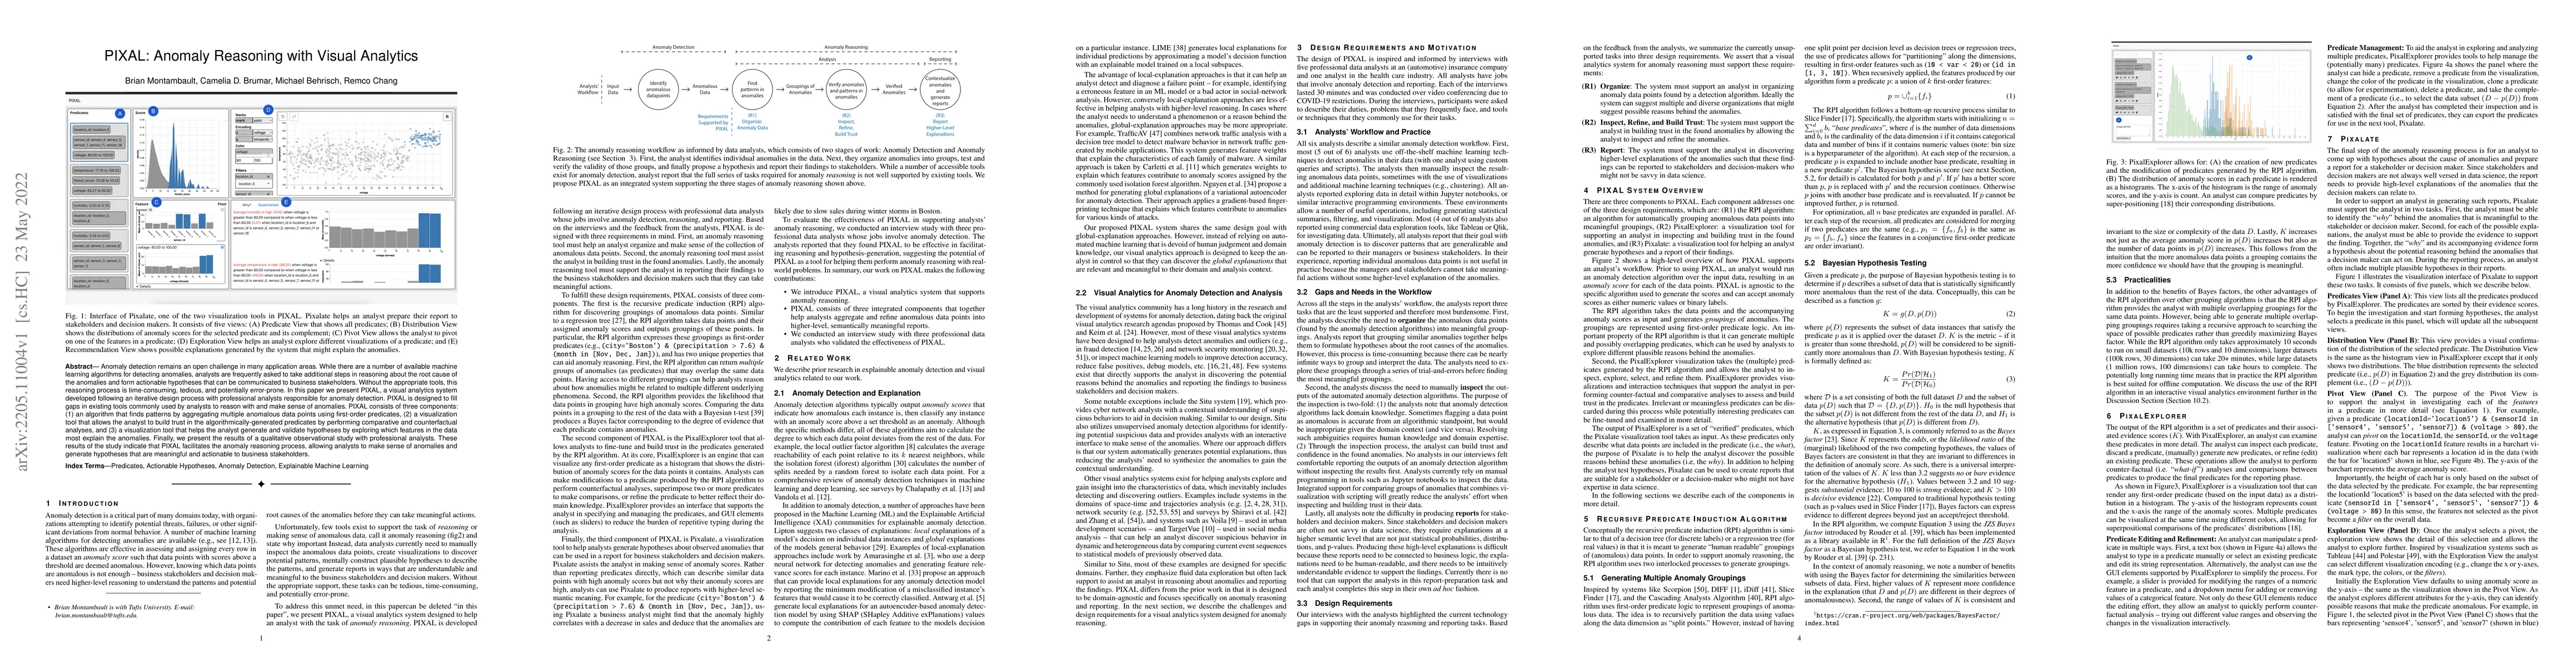
Anomaly detection remains an open challenge in many application areas. While there are a number of available machine learning algorithms for detecting anomalies, analysts are frequently asked to tak...
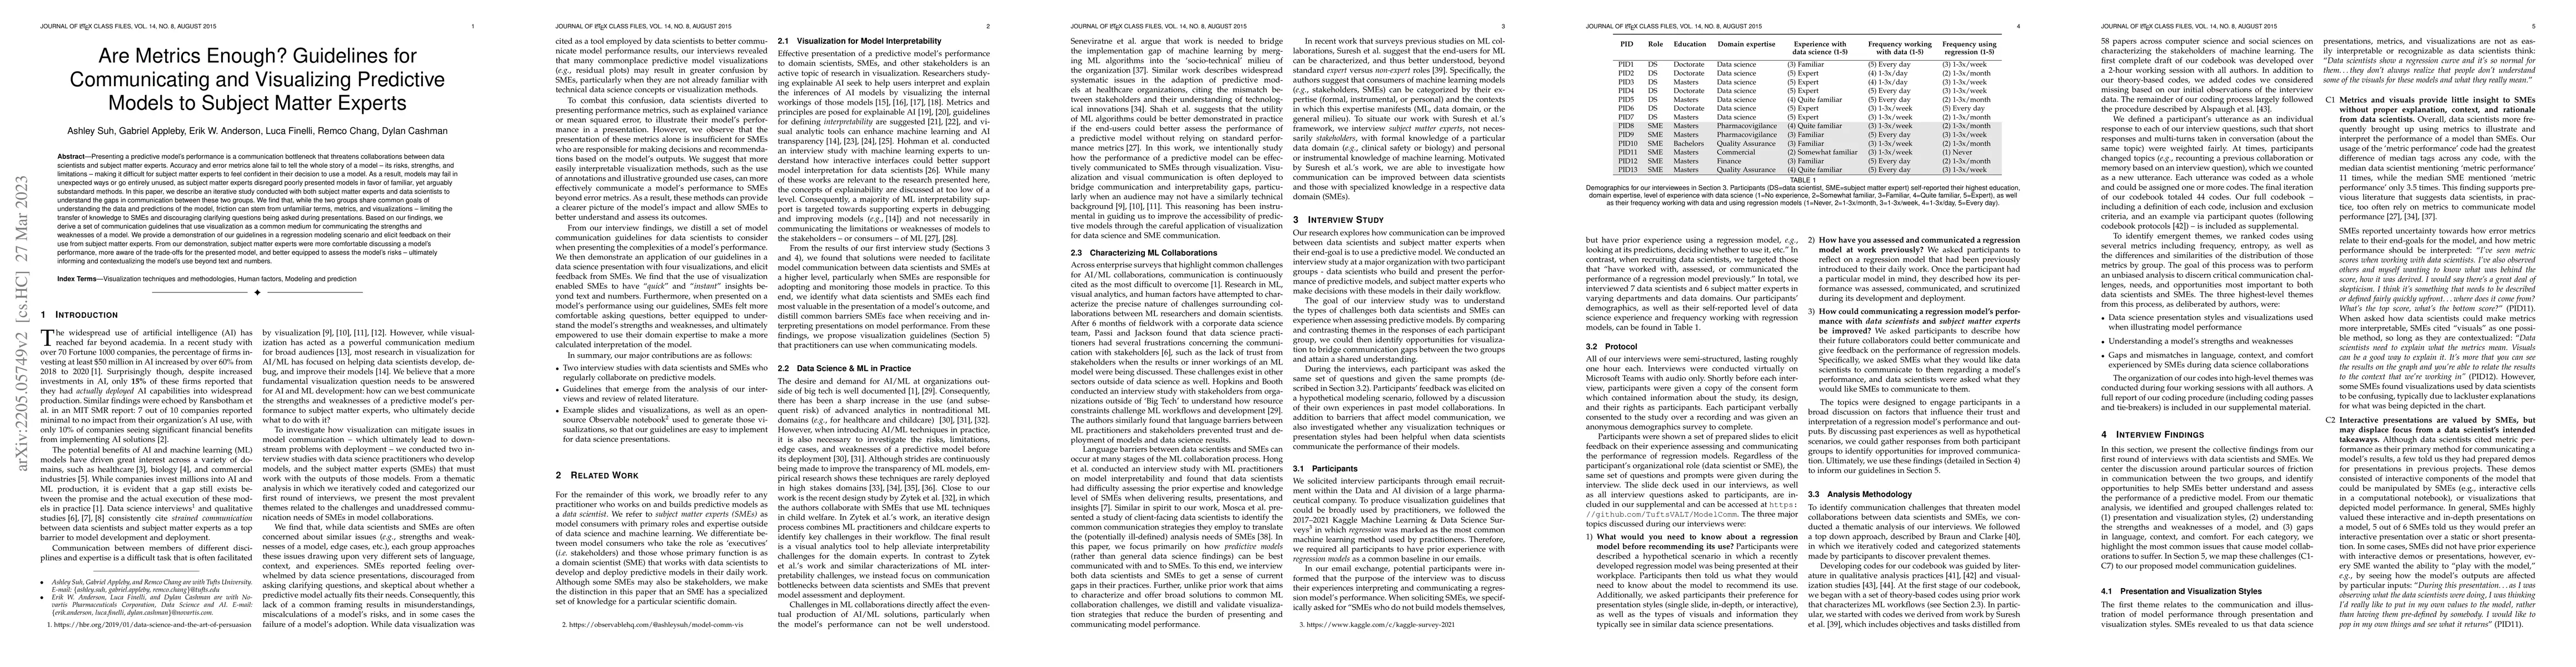
Presenting a predictive model's performance is a communication bottleneck that threatens collaborations between data scientists and subject matter experts. Accuracy and error metrics alone fail to t...
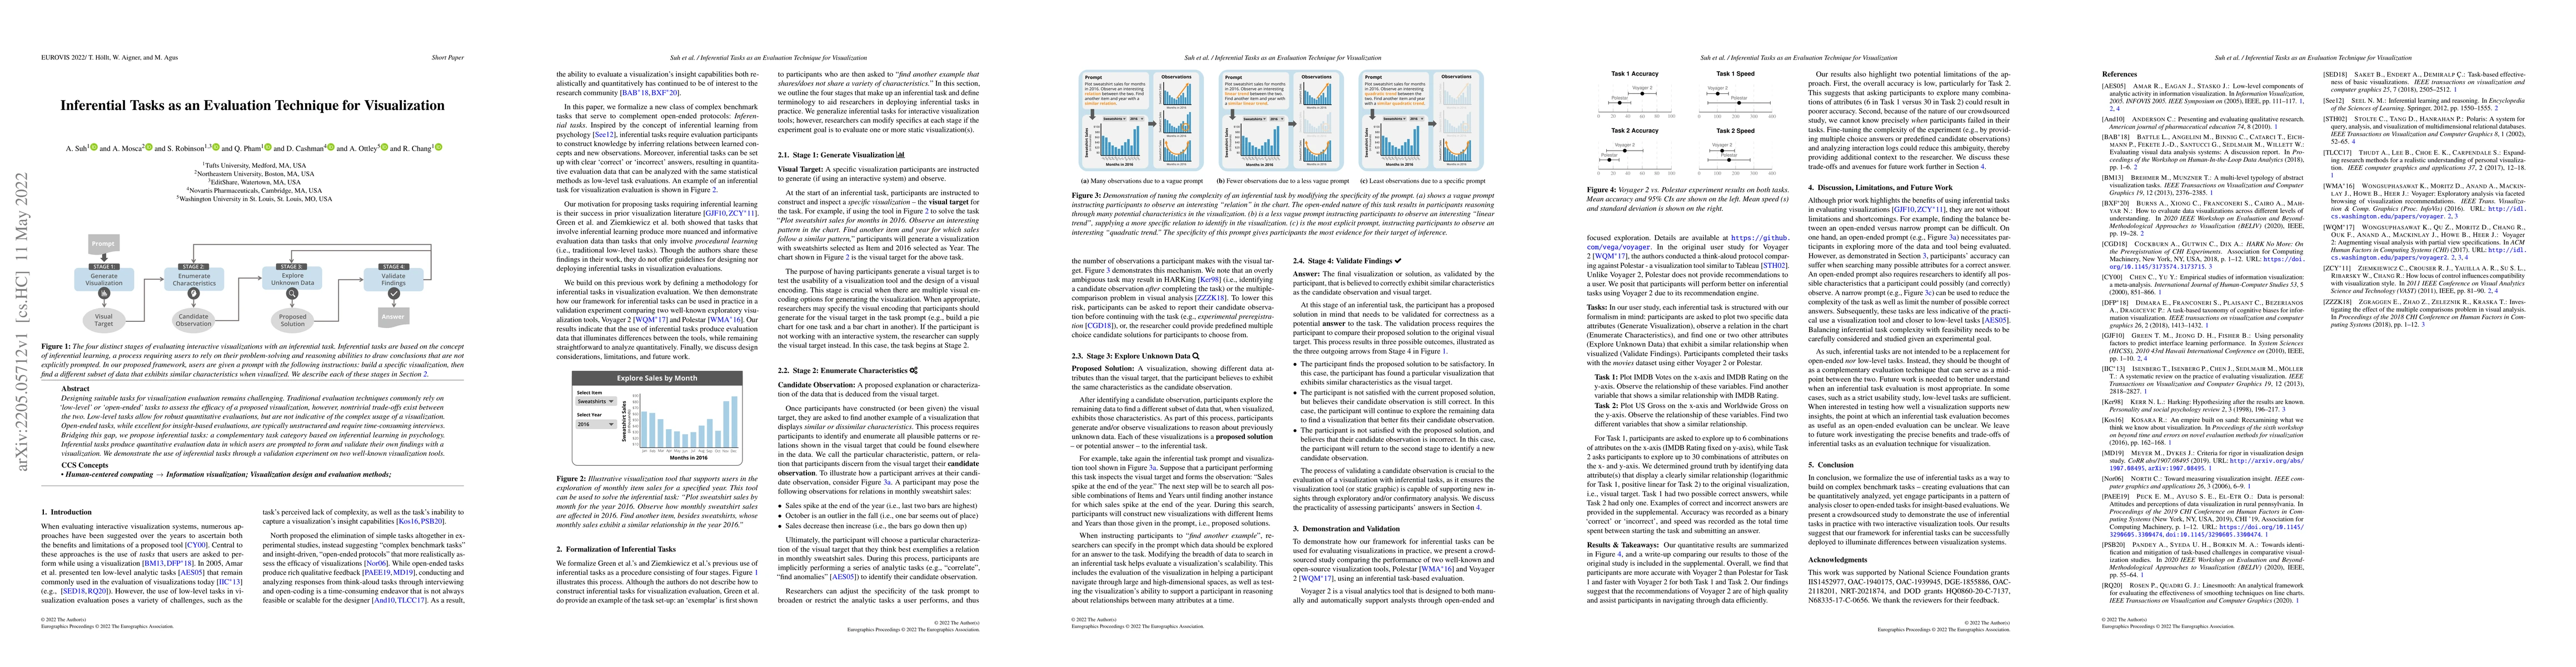
Designing suitable tasks for visualization evaluation remains challenging. Traditional evaluation techniques commonly rely on 'low-level' or 'open-ended' tasks to assess the efficacy of a proposed v...
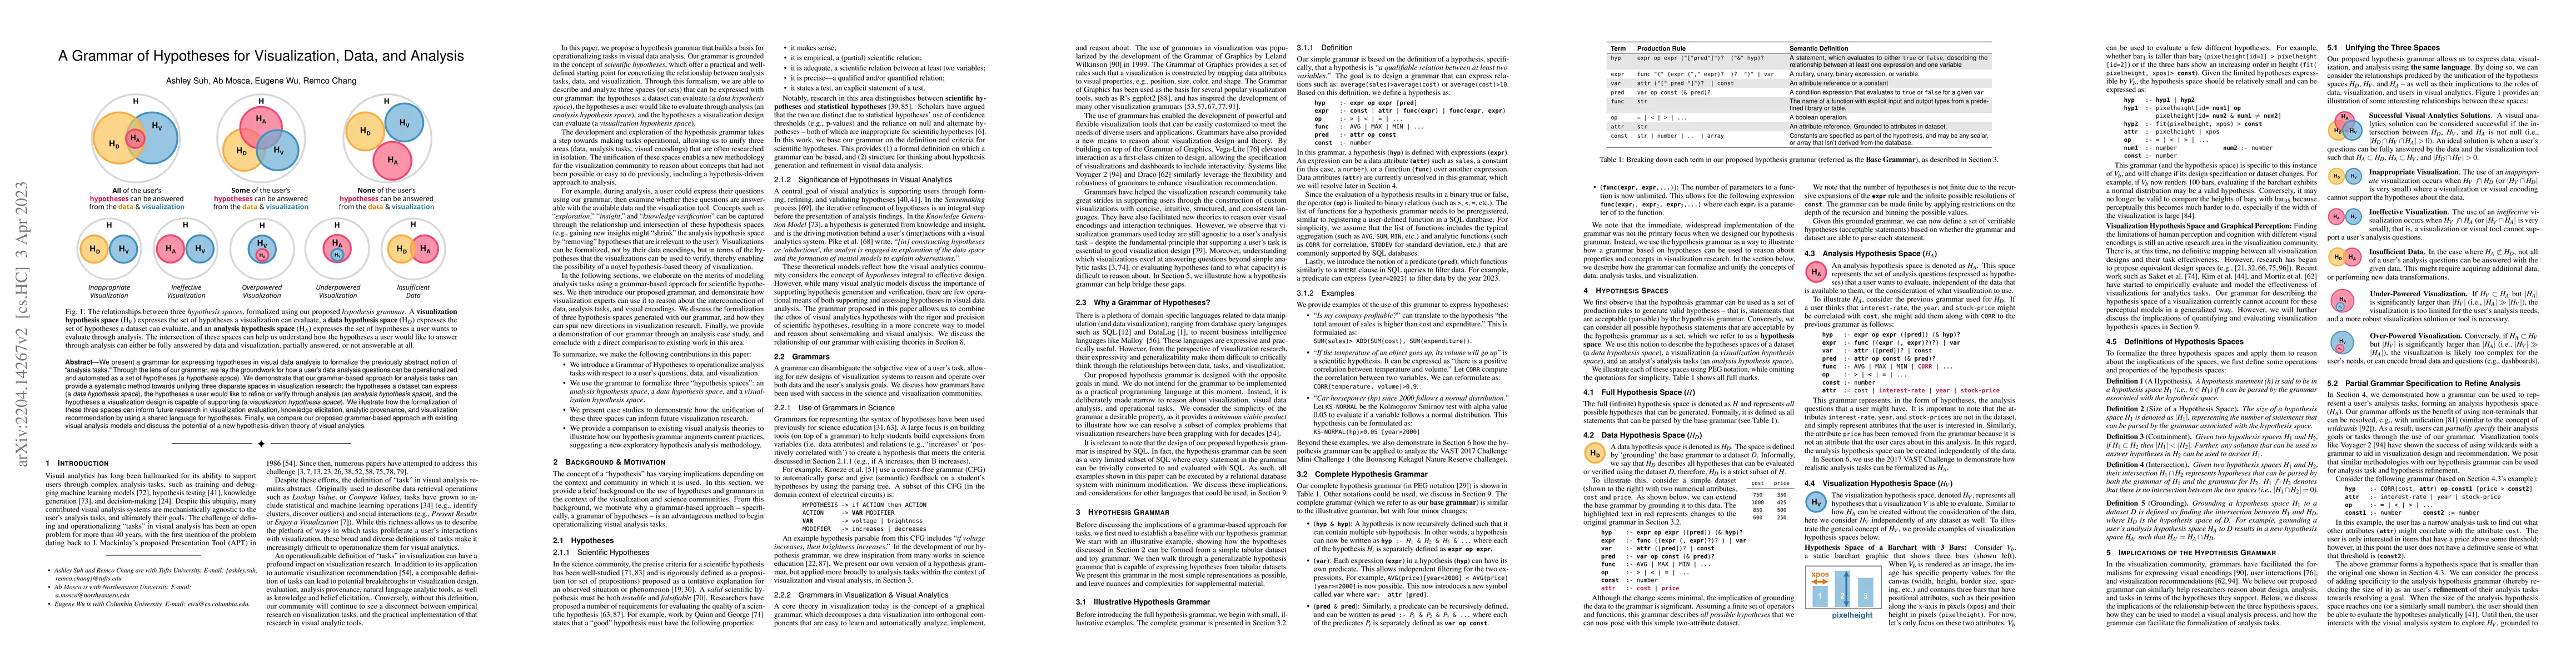
We present a grammar for expressing hypotheses in visual data analysis to formalize the previously abstract notion of "analysis tasks." Through the lens of our grammar, we lay the groundwork for how...
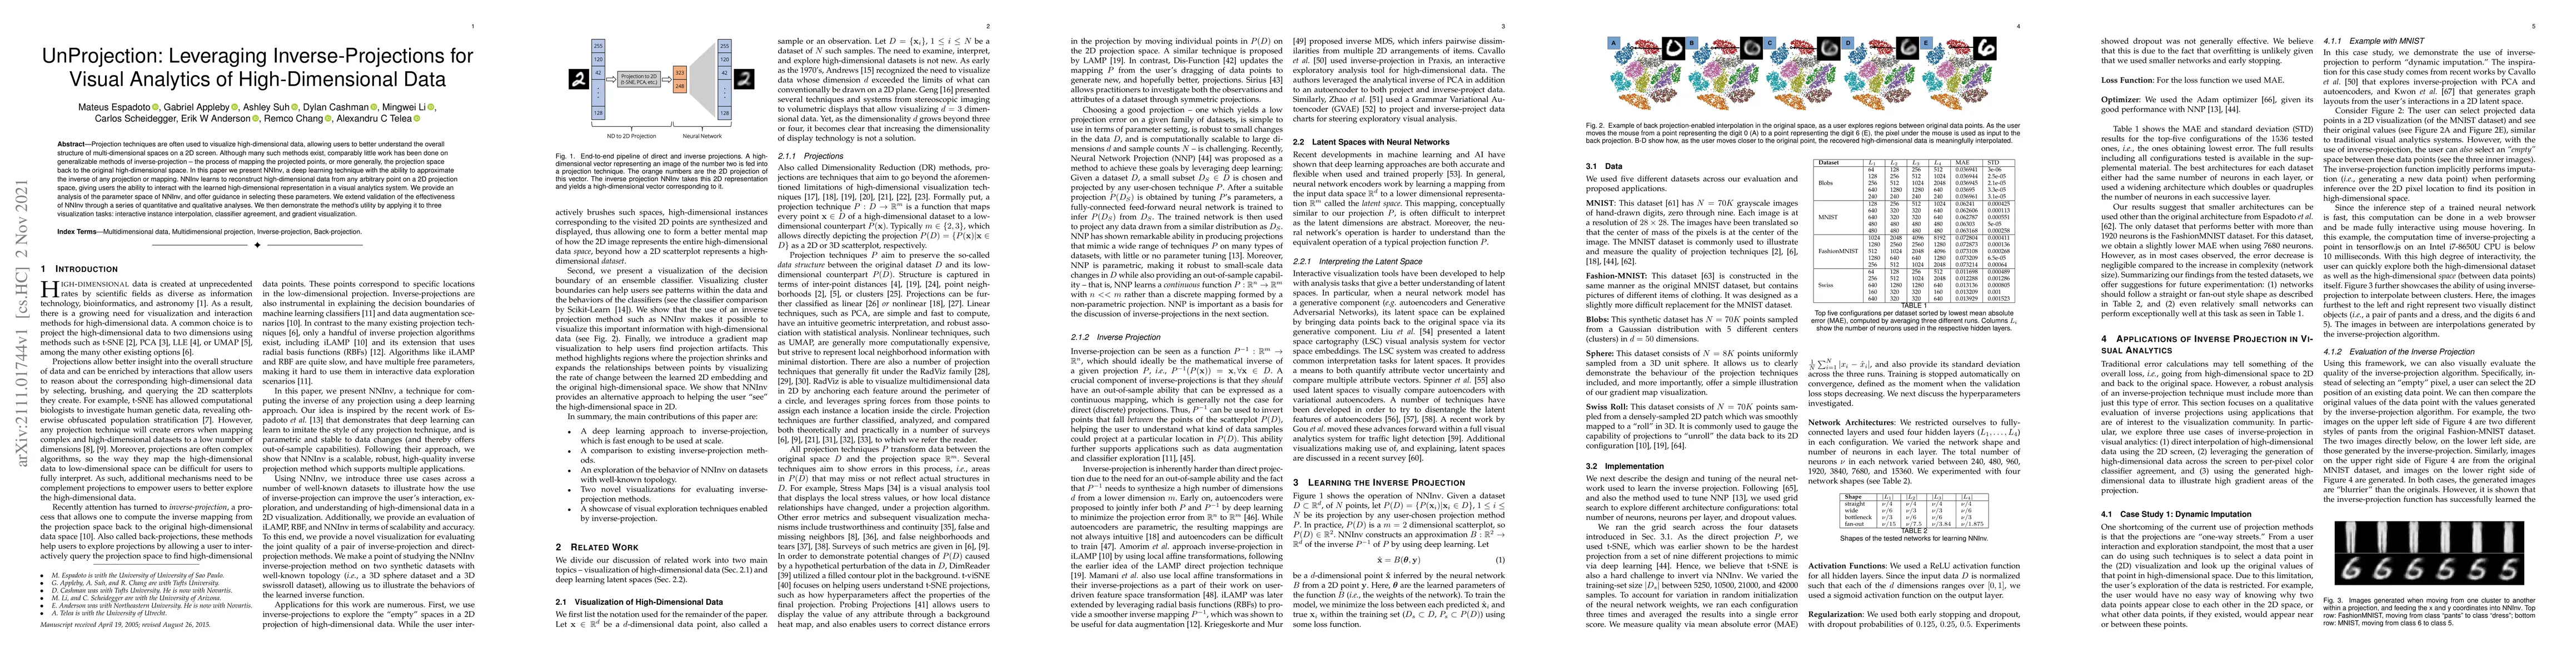
Projection techniques are often used to visualize high-dimensional data, allowing users to better understand the overall structure of multi-dimensional spaces on a 2D screen. Although many such meth...
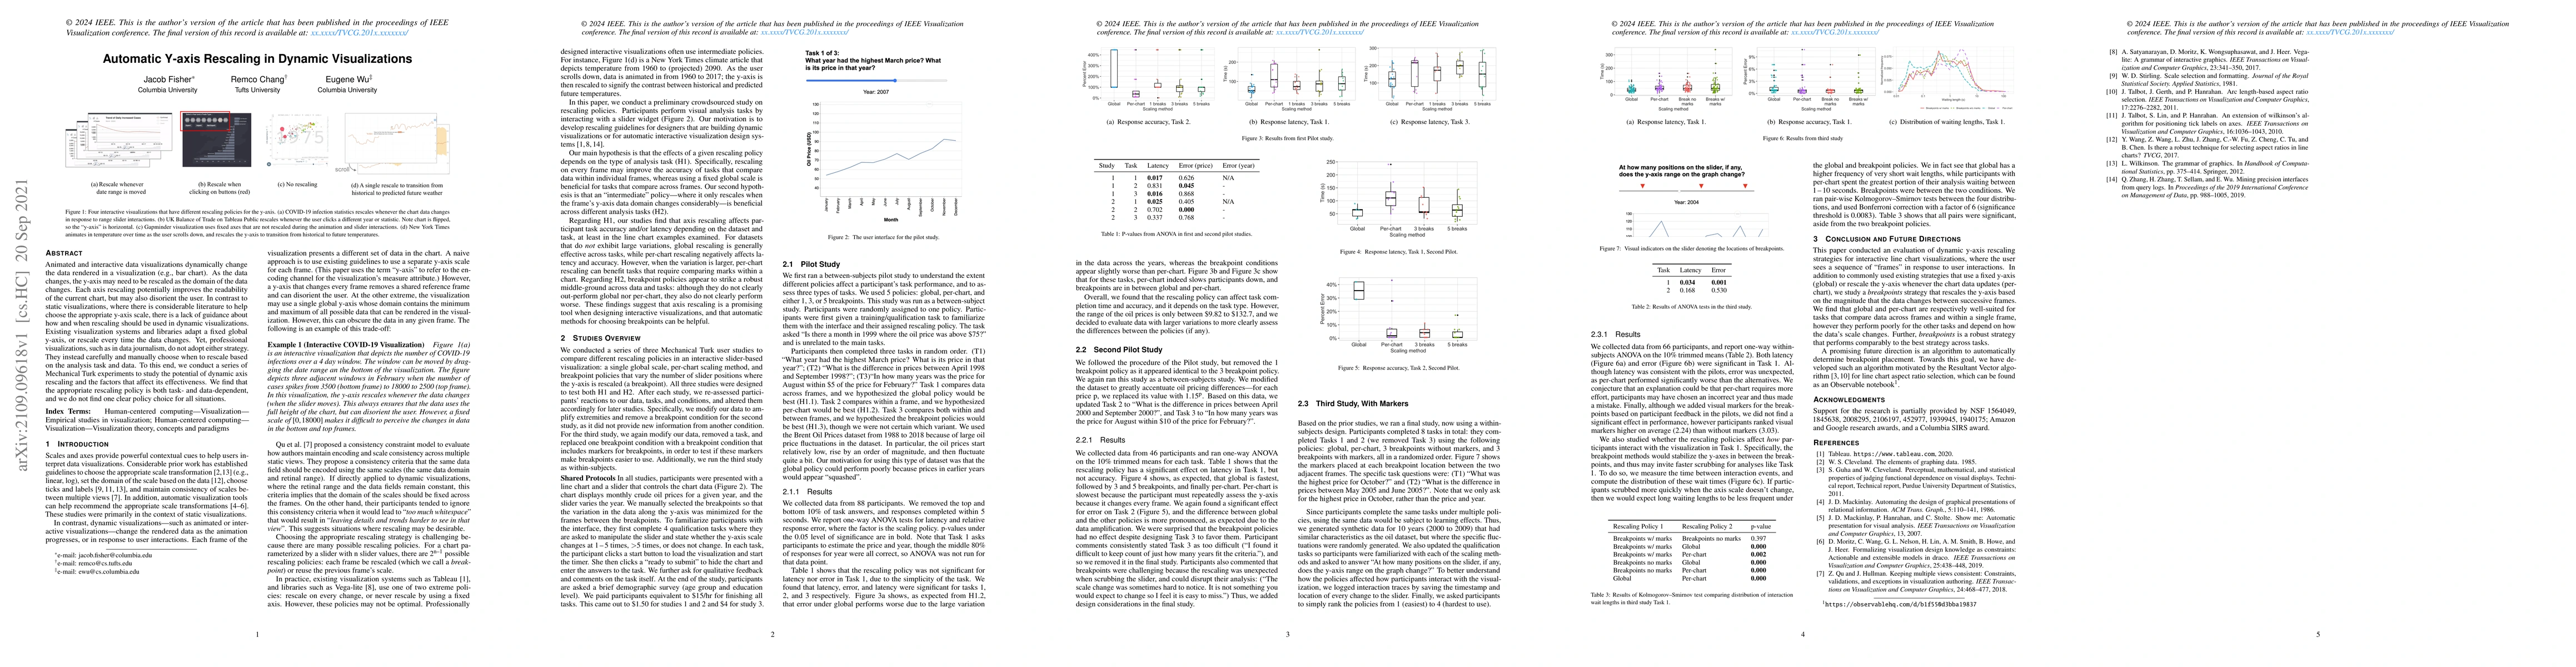
Animated and interactive data visualizations dynamically change the data rendered in a visualization (e.g., bar chart). As the data changes, the y-axis may need to be rescaled as the domain of the d...
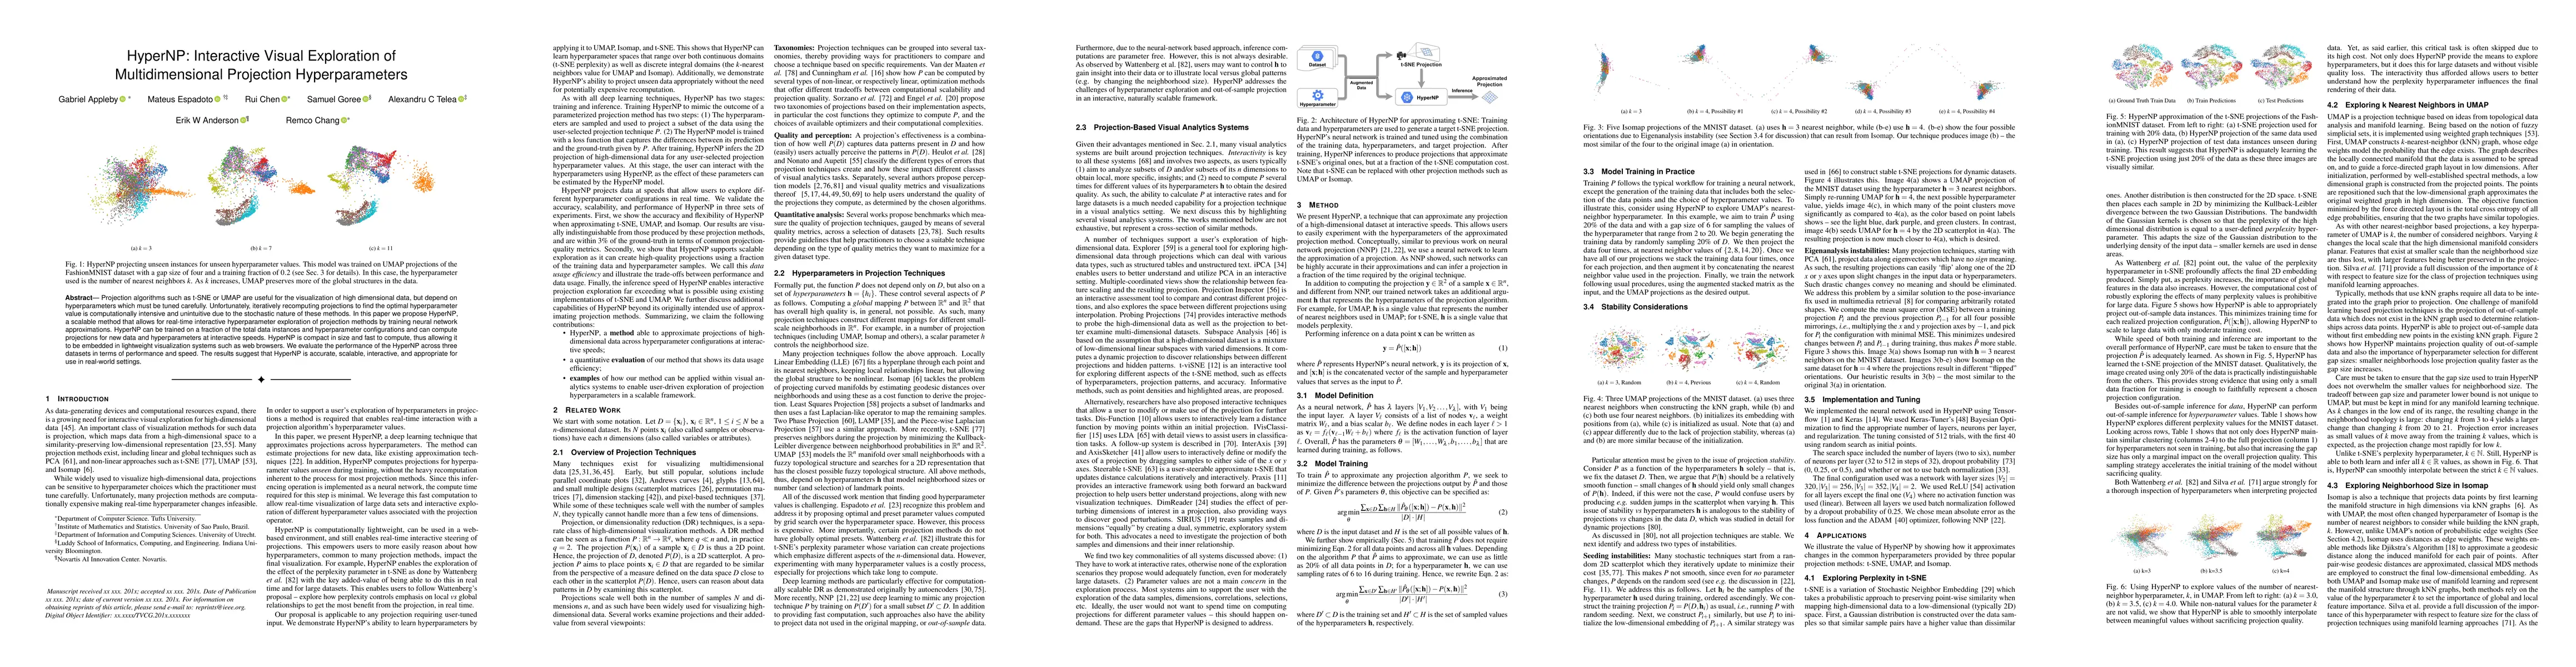
Projection algorithms such as t-SNE or UMAP are useful for the visualization of high dimensional data, but depend on hyperparameters which must be tuned carefully. Unfortunately, iteratively recompu...
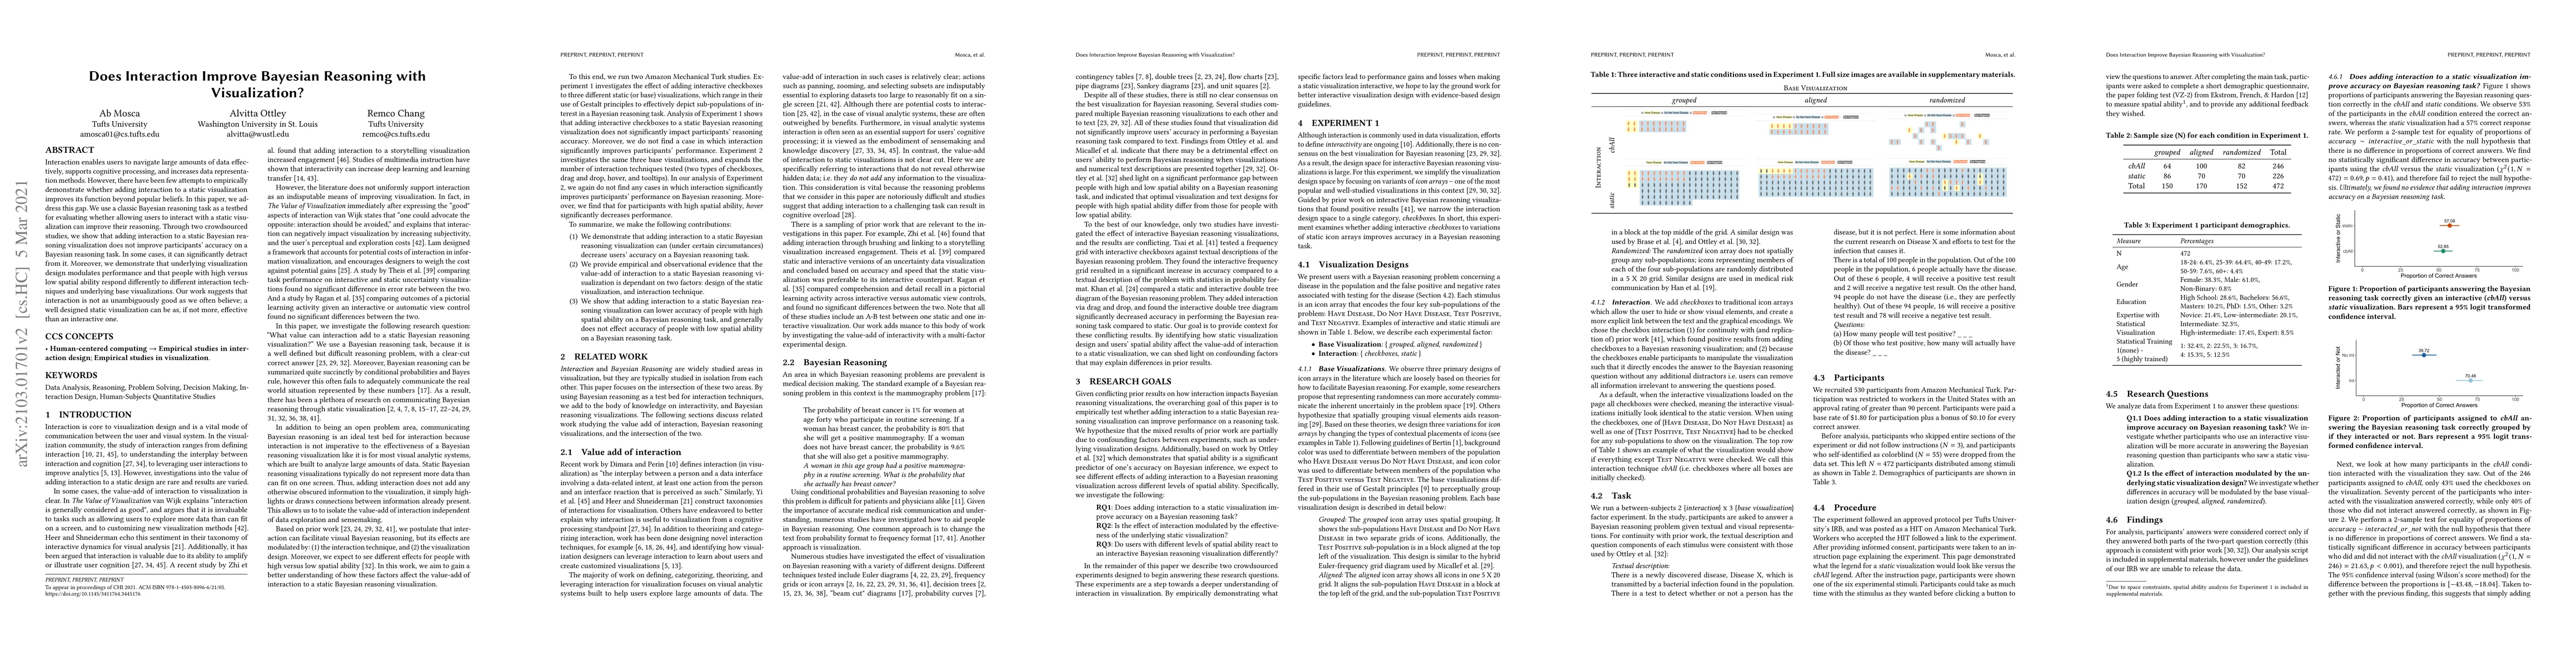
Interaction enables users to navigate large amounts of data effectively, supports cognitive processing, and increases data representation methods. However, there have been few attempts to empiricall...
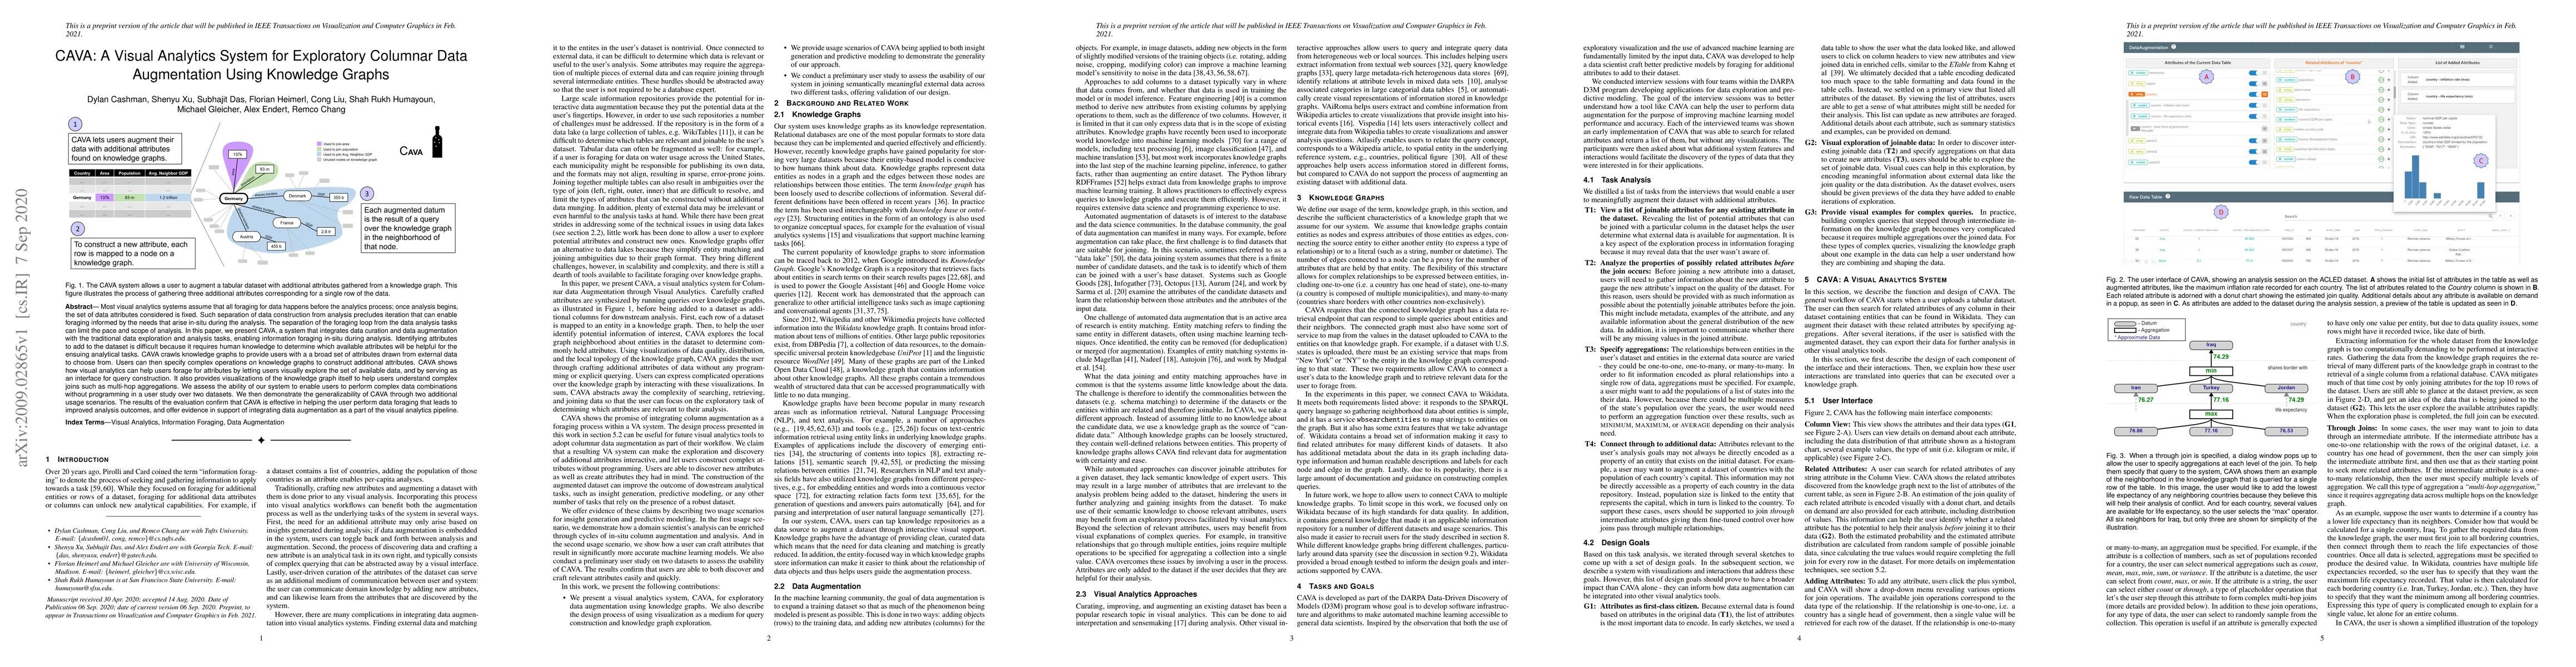
Most visual analytics systems assume that all foraging for data happens before the analytics process; once analysis begins, the set of data attributes considered is fixed. Such separation of data co...
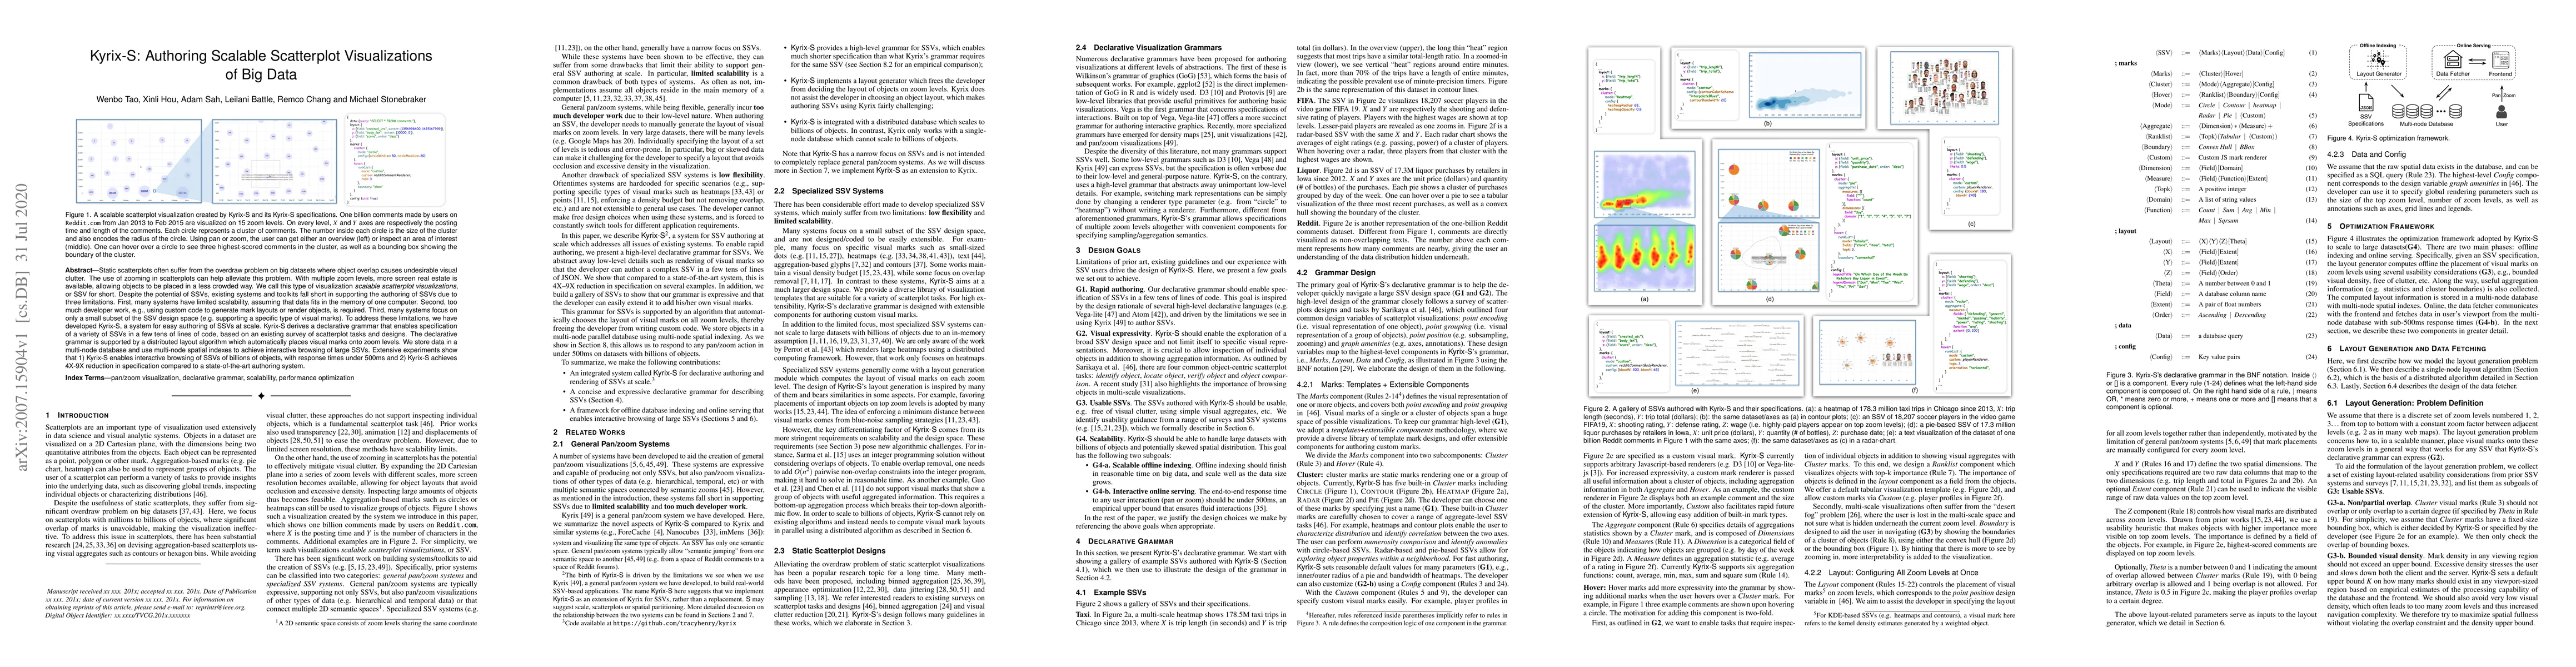
Static scatterplots often suffer from the overdraw problem on big datasets where object overlap causes undesirable visual clutter. The use of zooming in scatterplots can help alleviate this problem....
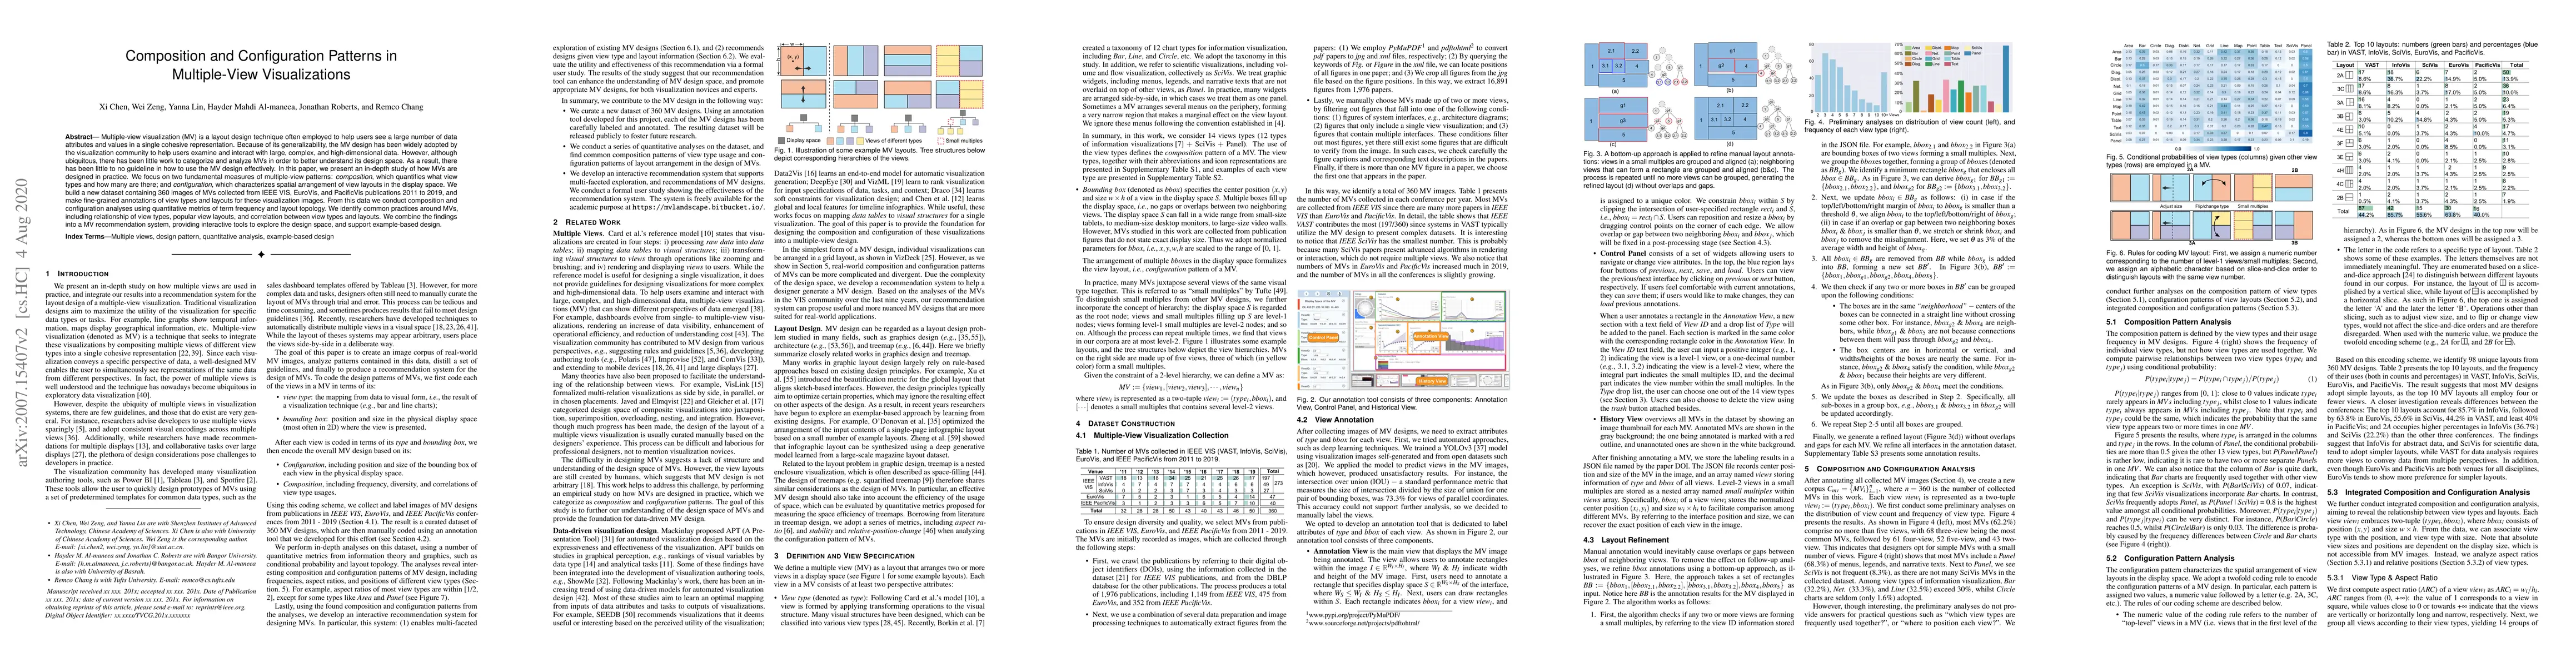
Multiple-view visualization (MV) is a layout design technique often employed to help users see a large number of data attributes and values in a single cohesive representation. Because of its genera...
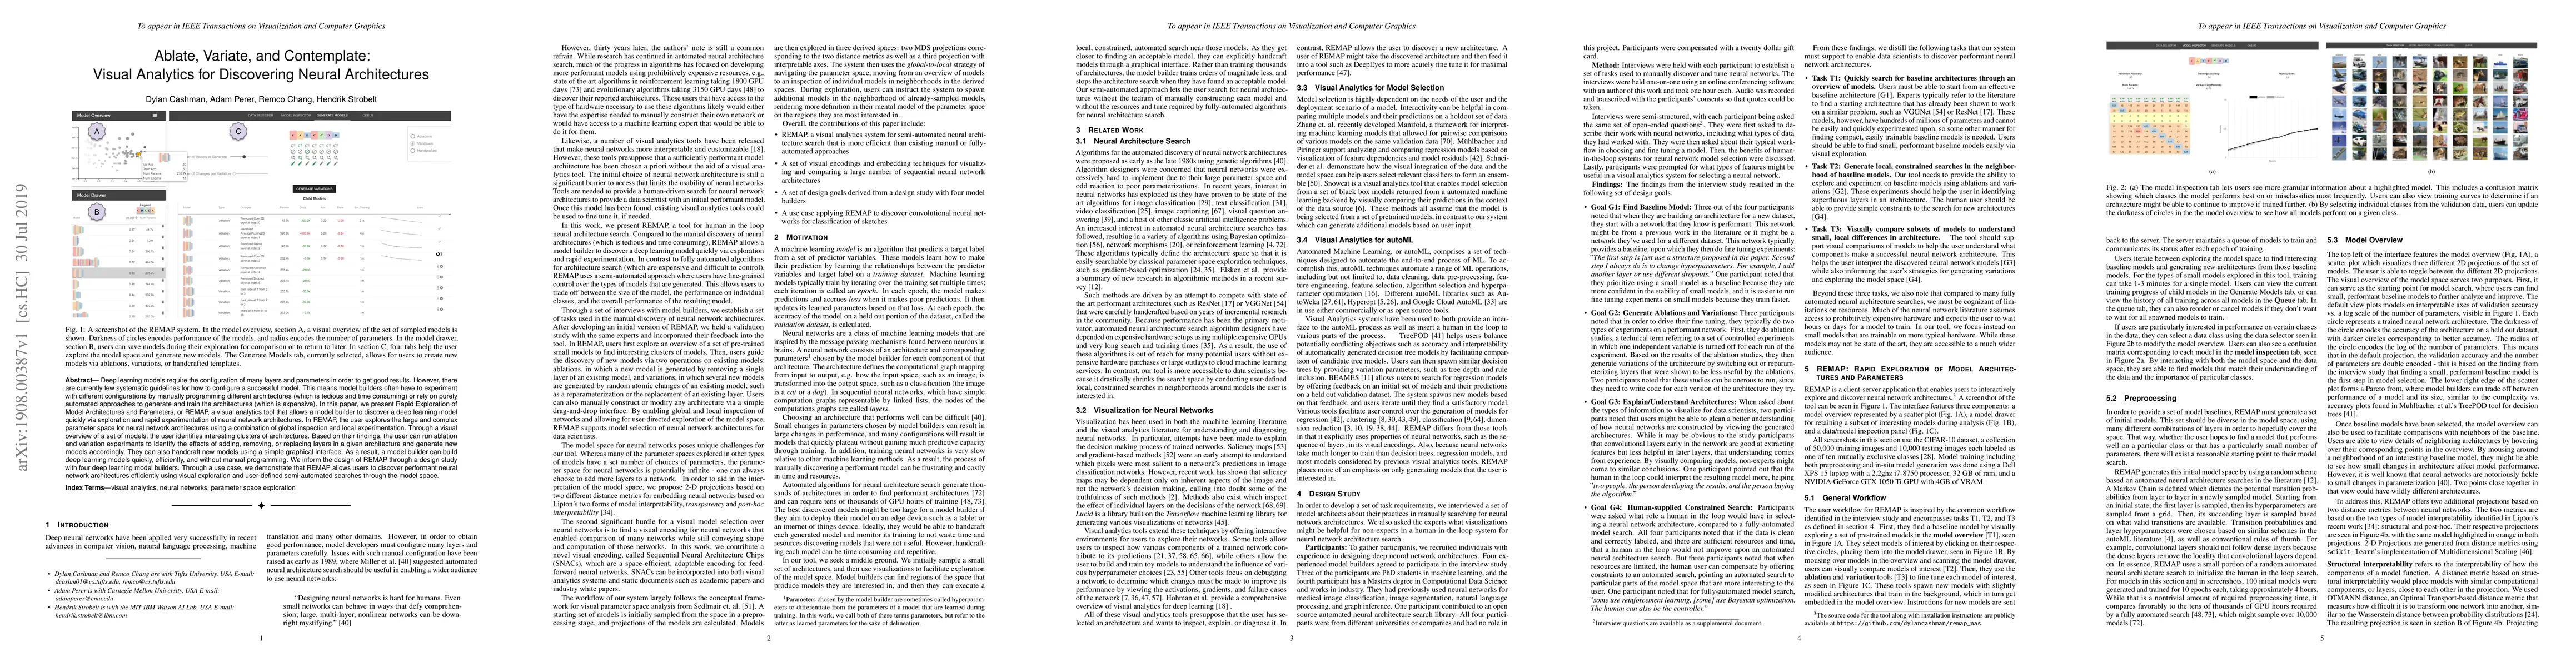
Deep learning models require the configuration of many layers and parameters in order to get good results. However, there are currently few systematic guidelines for how to configure a successful mo...
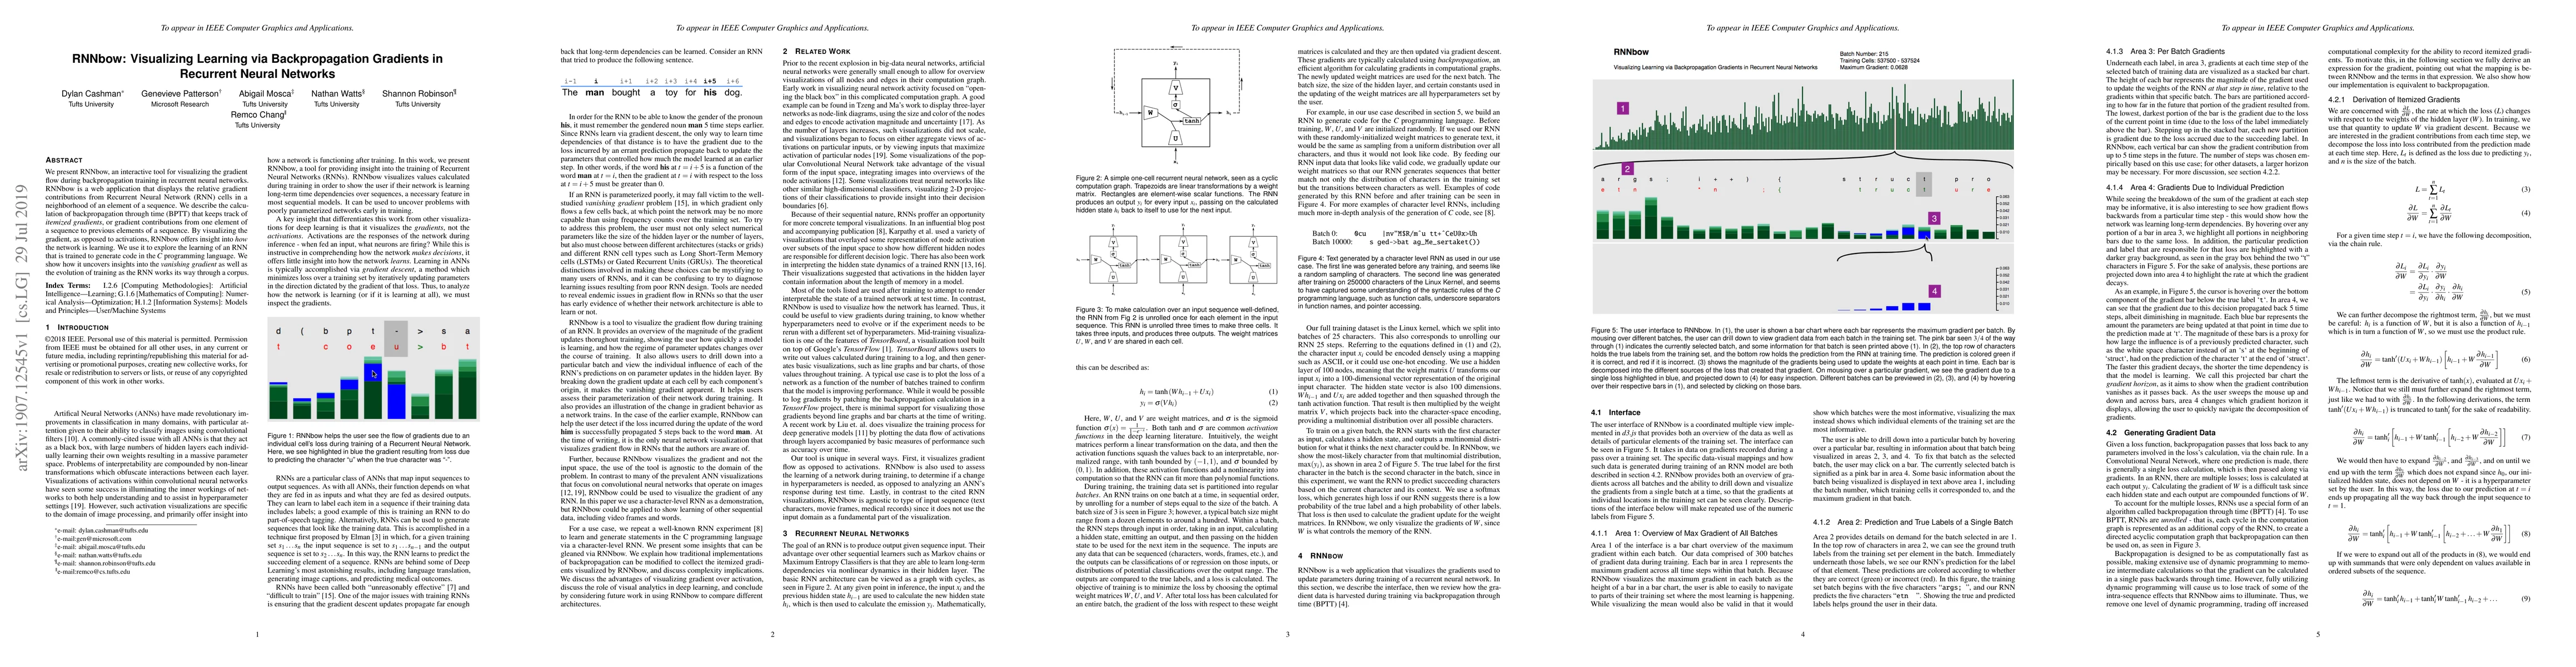
We present RNNbow, an interactive tool for visualizing the gradient flow during backpropagation training in recurrent neural networks. RNNbow is a web application that displays the relative gradient...
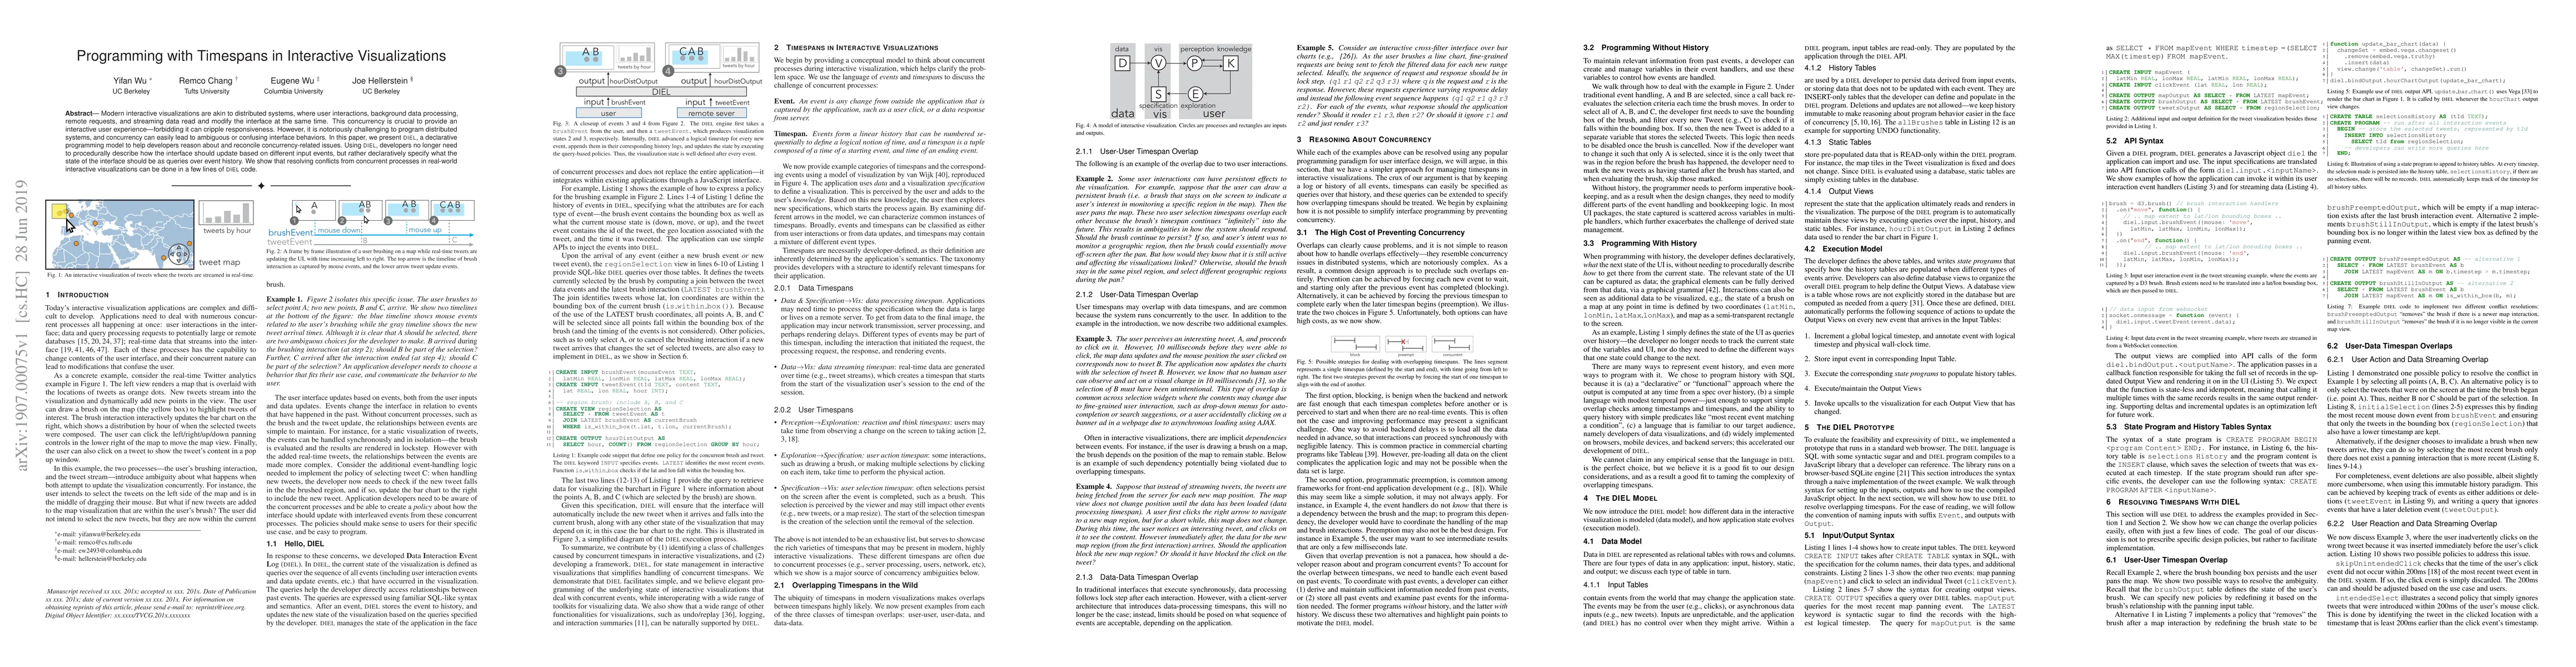
Modern interactive visualizations are akin to distributed systems, where user interactions, background data processing, remote requests, and streaming data read and modify the interface at the same ...
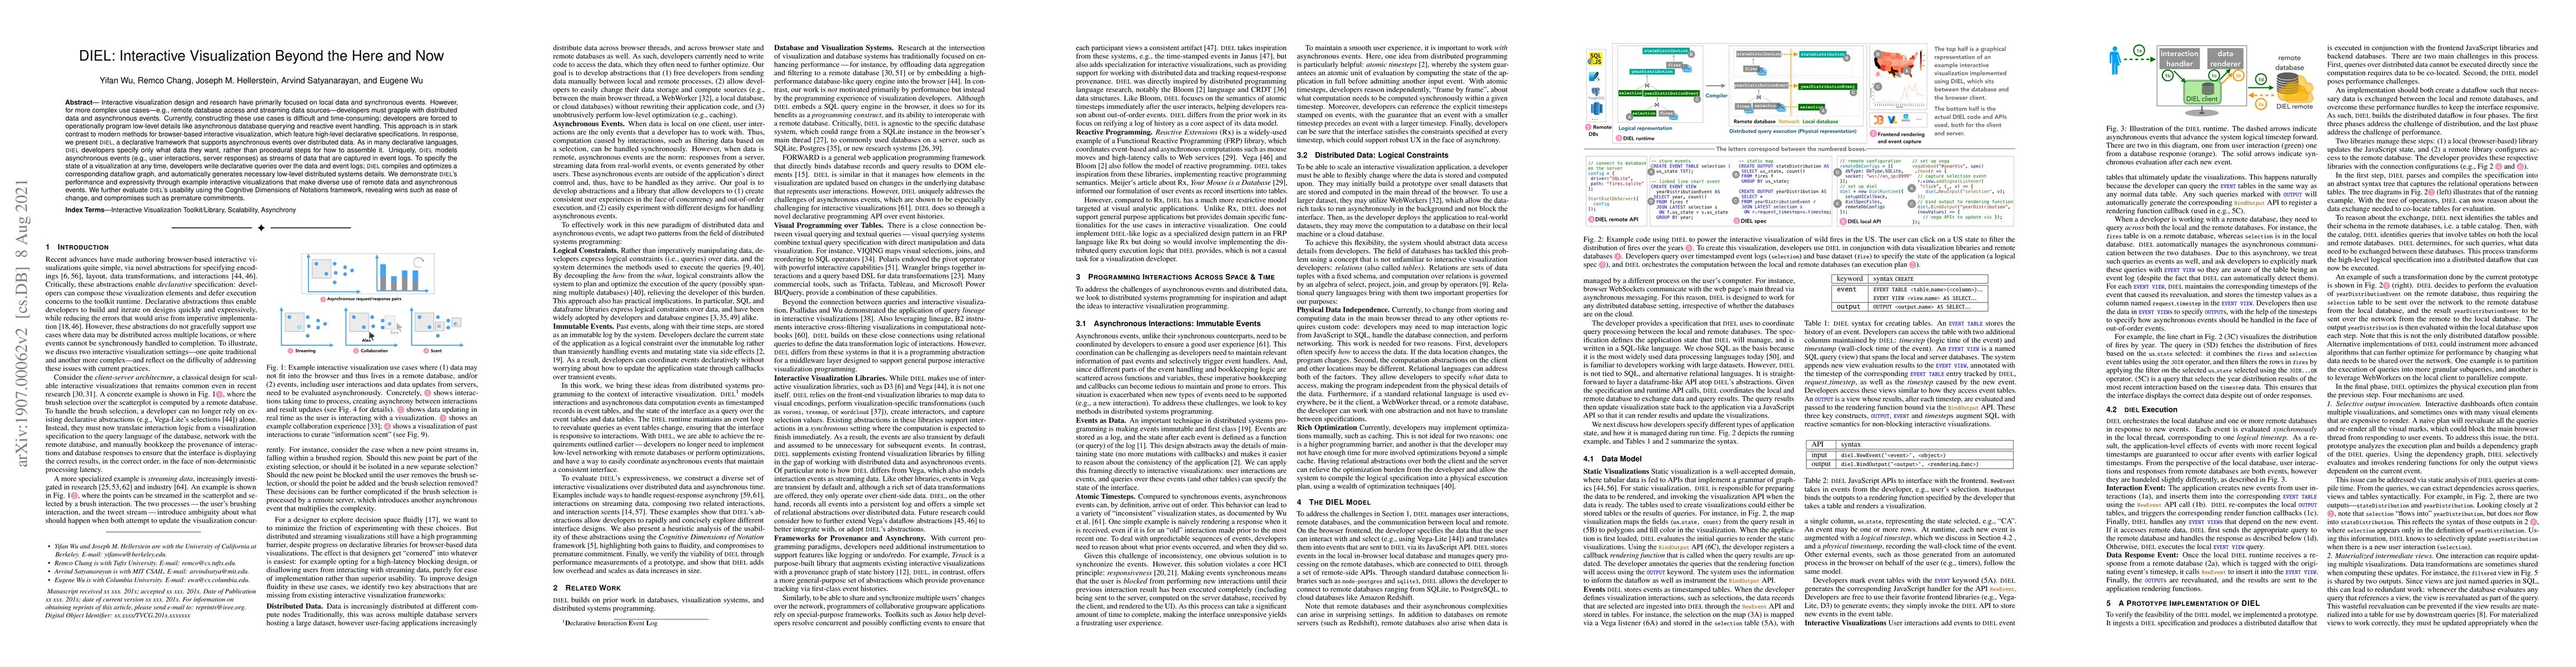
Interactive visualization design and research have primarily focused on local data and synchronous events. However, for more complex use cases---e.g., remote database access and streaming data sourc...
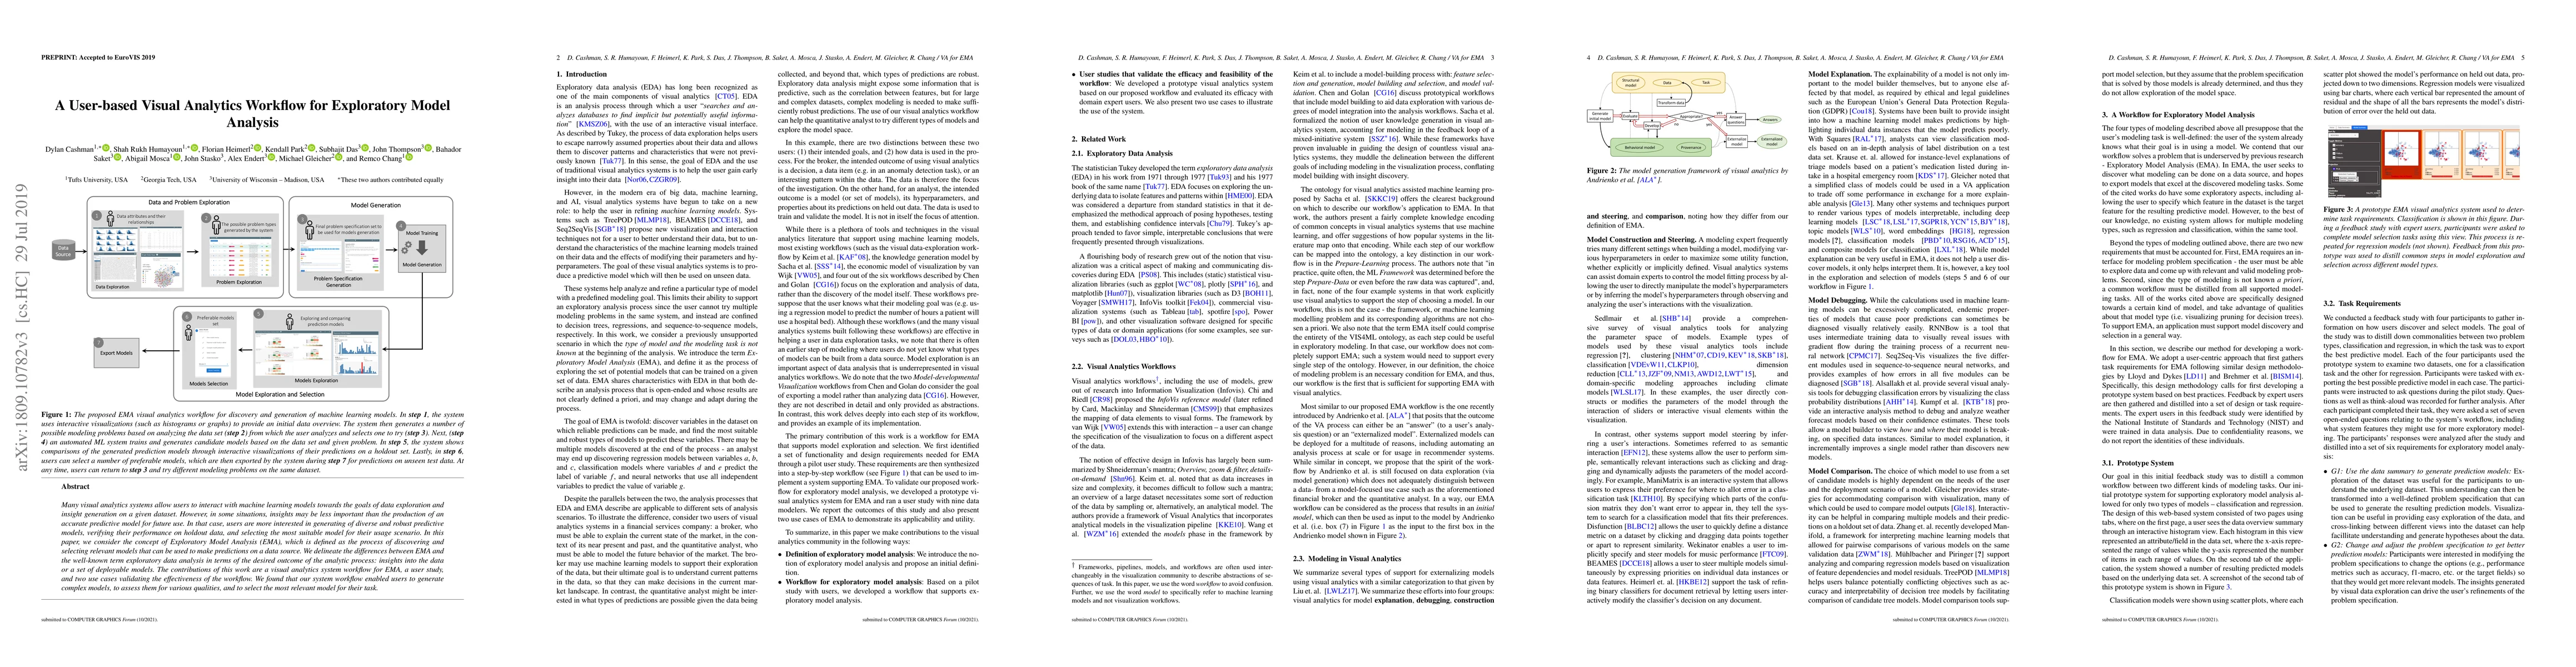
Many visual analytics systems allow users to interact with machine learning models towards the goals of data exploration and insight generation on a given dataset. However, in some situations, insig...
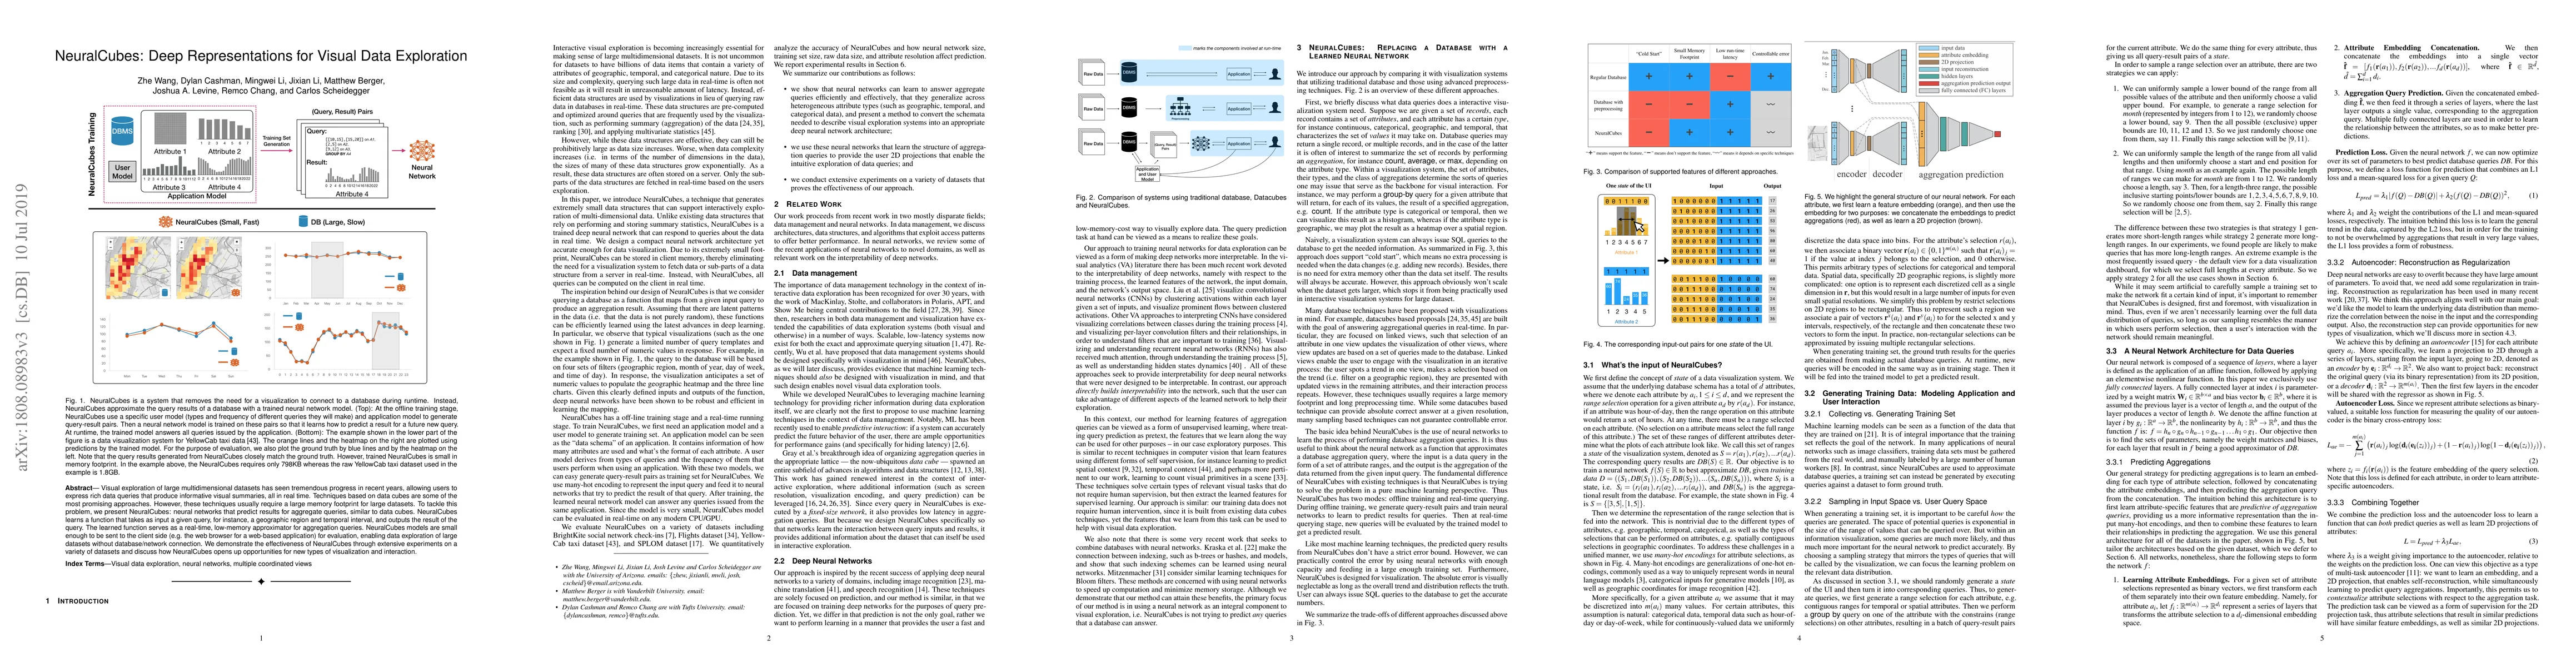
Visual exploration of large multidimensional datasets has seen tremendous progress in recent years, allowing users to express rich data queries that produce informative visual summaries, all in real...
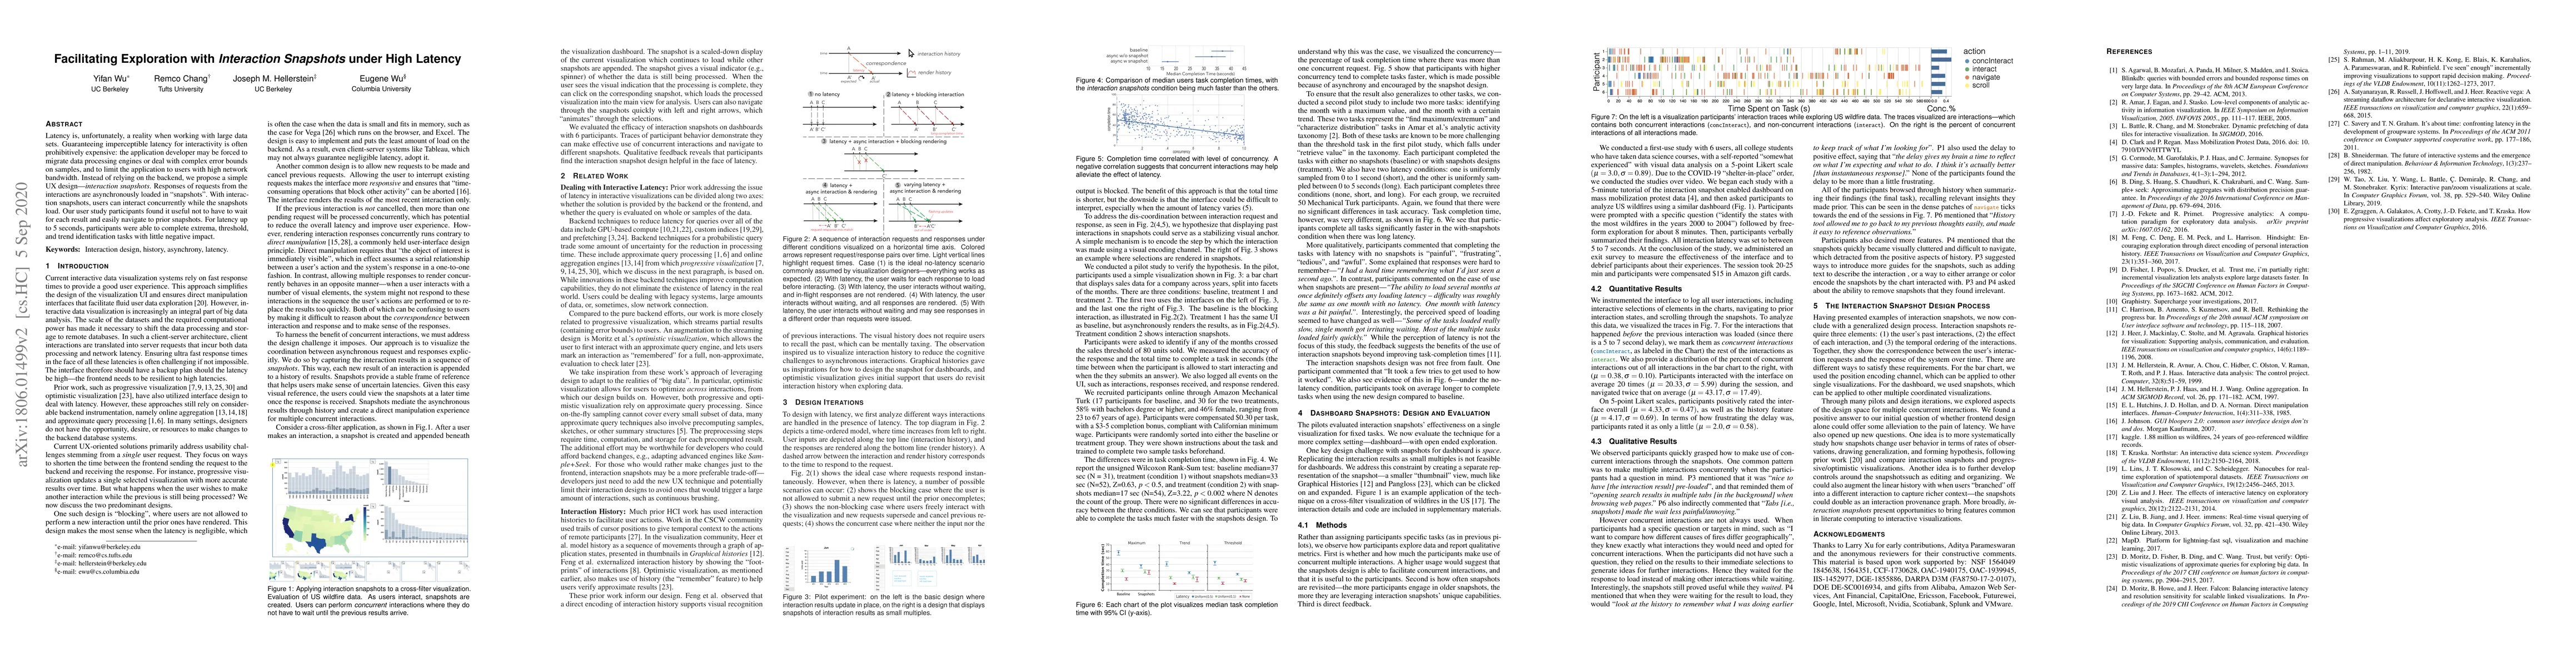
Latency is, unfortunately, a reality when working with large datasets. Guaranteeing imperceptible latency for interactivity is often prohibitively expensive: the application developer may be forced ...
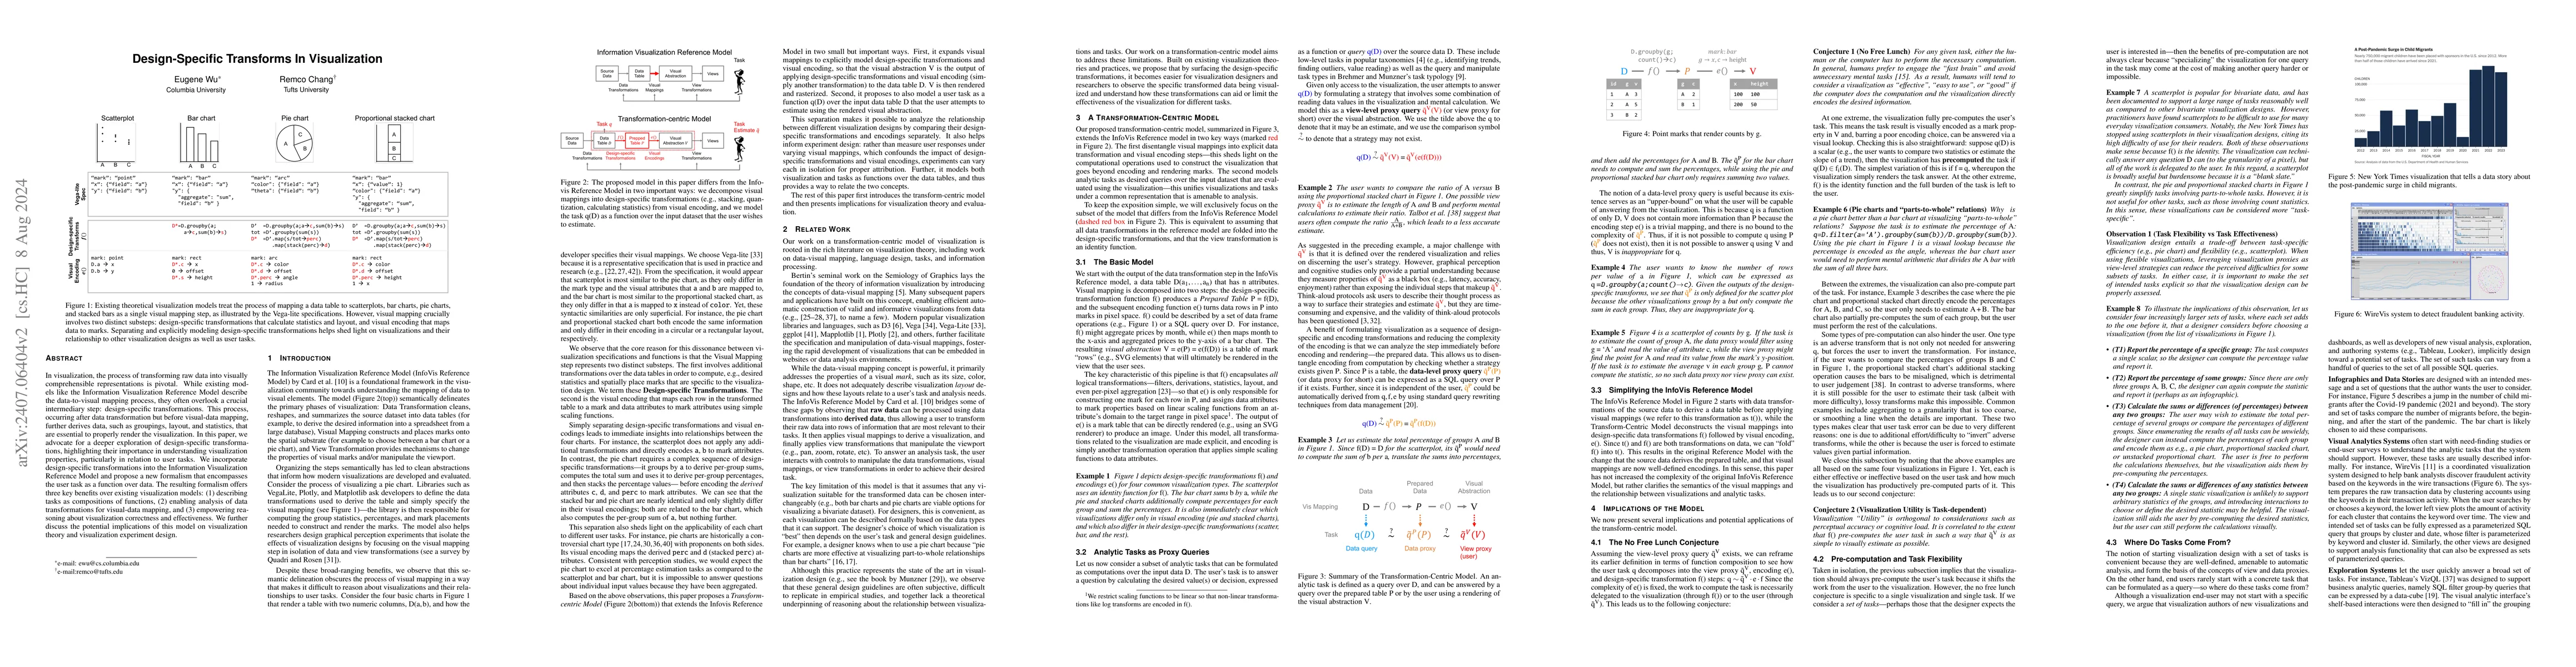
In visualization, the process of transforming raw data into visually comprehensible representations is pivotal. While existing models like the Information Visualization Reference Model describe the da...
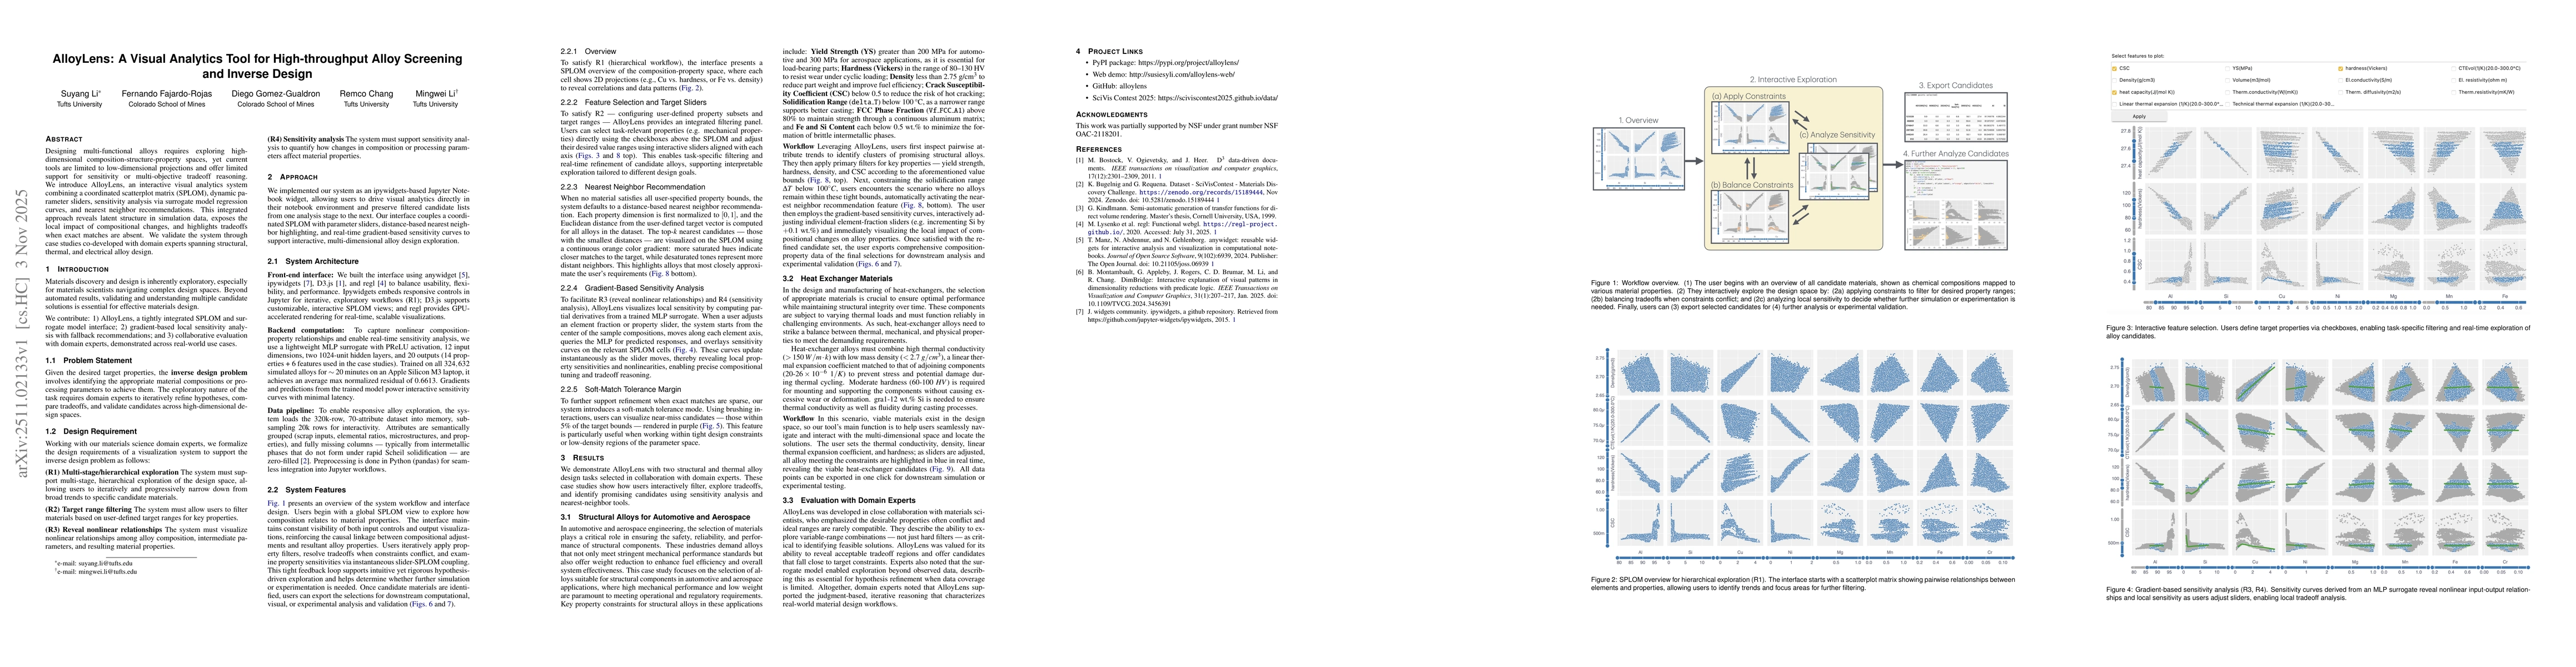
Designing multi-functional alloys requires exploring high-dimensional composition-structure-property spaces, yet current tools are limited to low-dimensional projections and offer limited support for ...
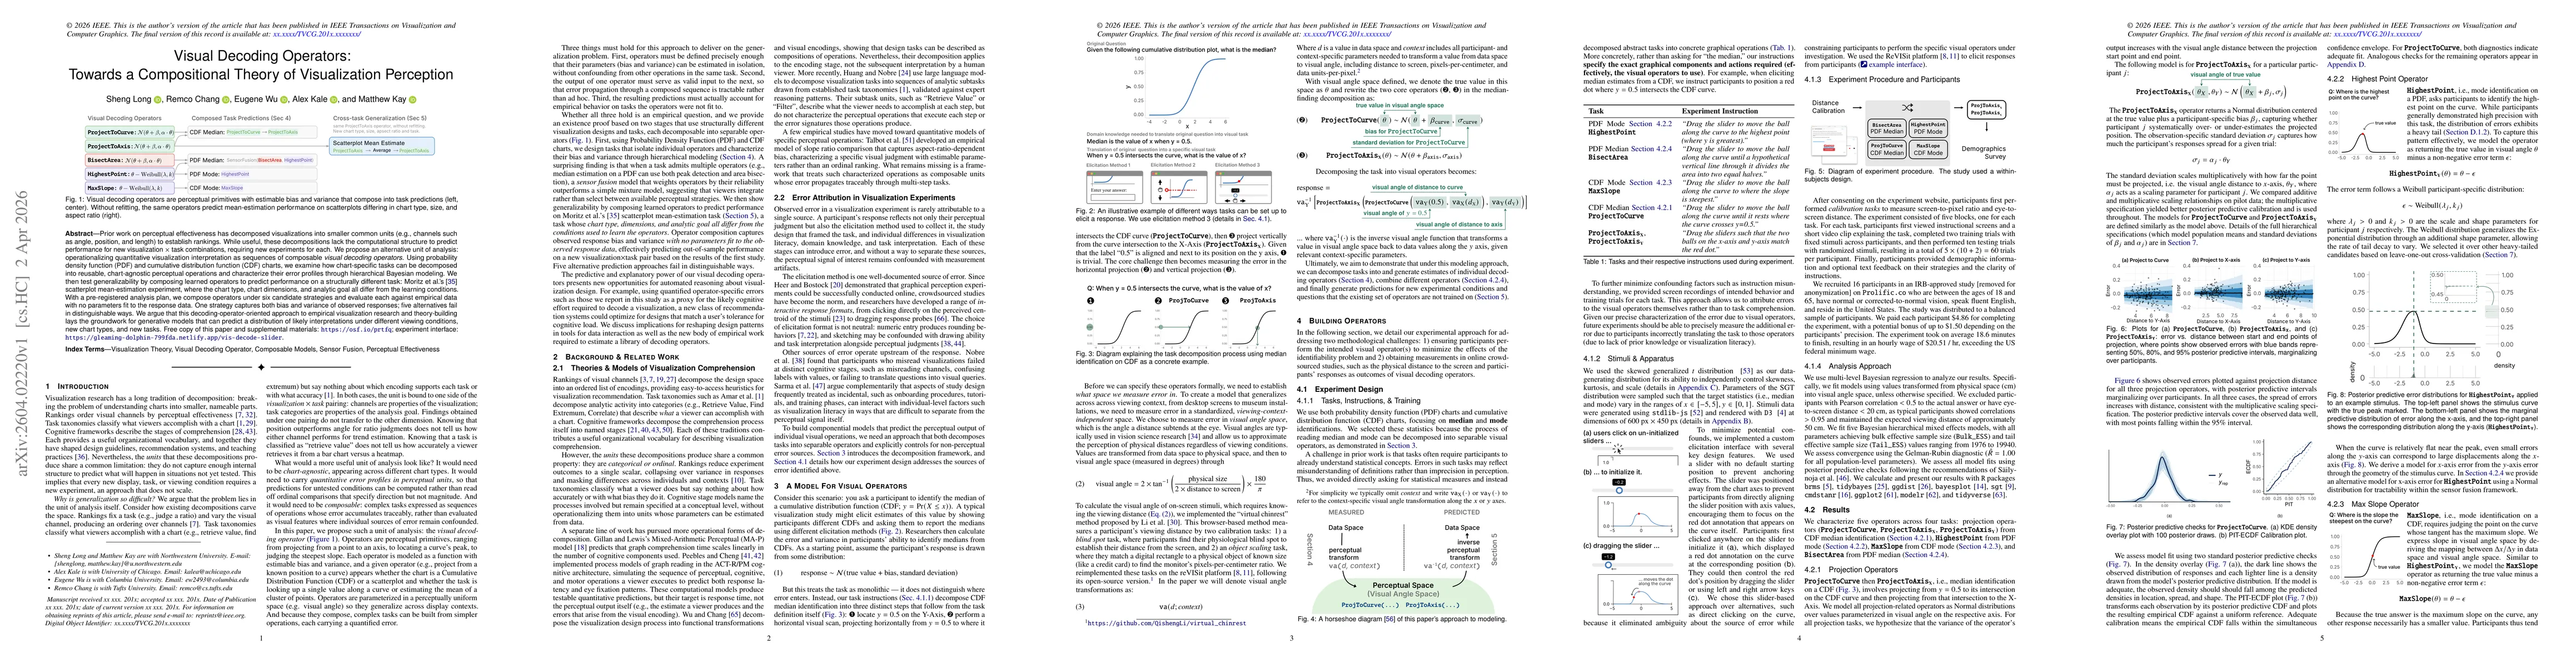
Prior work on perceptual effectiveness has decomposed visualizations into smaller common units (e.g., channels such as angle, position, and length) to establish rankings. While useful, these decomposi...
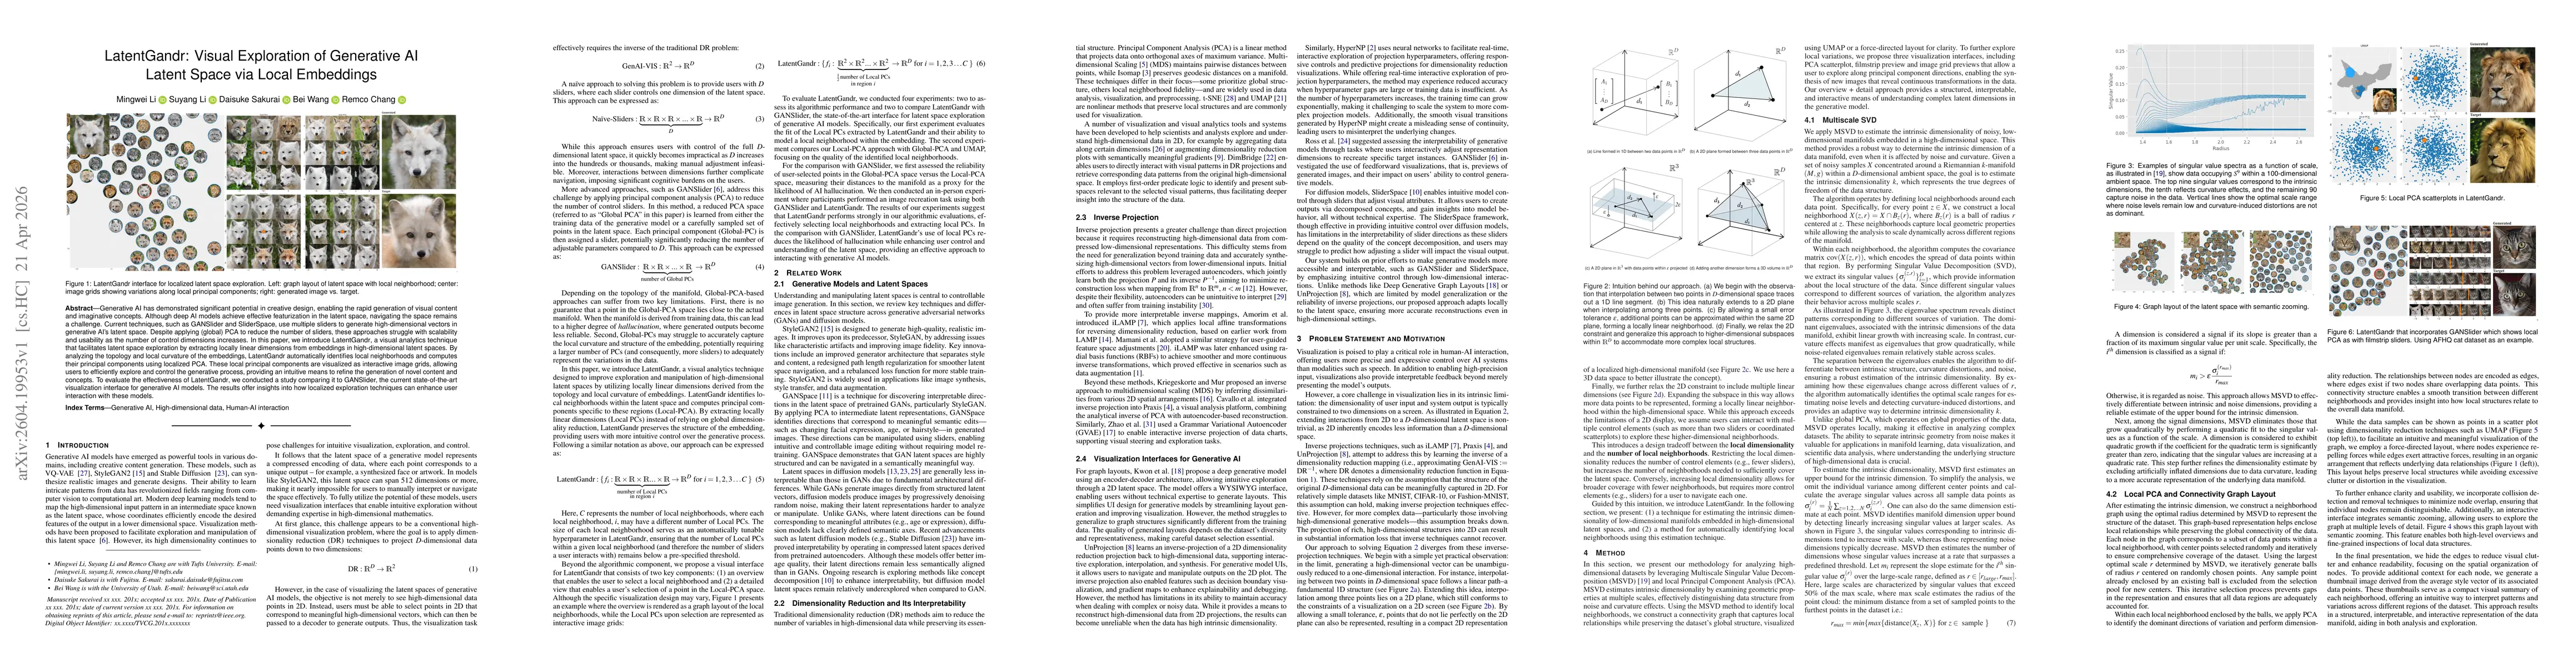
Generative AI has demonstrated significant potential in creative design, enabling the rapid generation of visual content and imaginative concepts. Although deep AI models achieve effective featurizati...