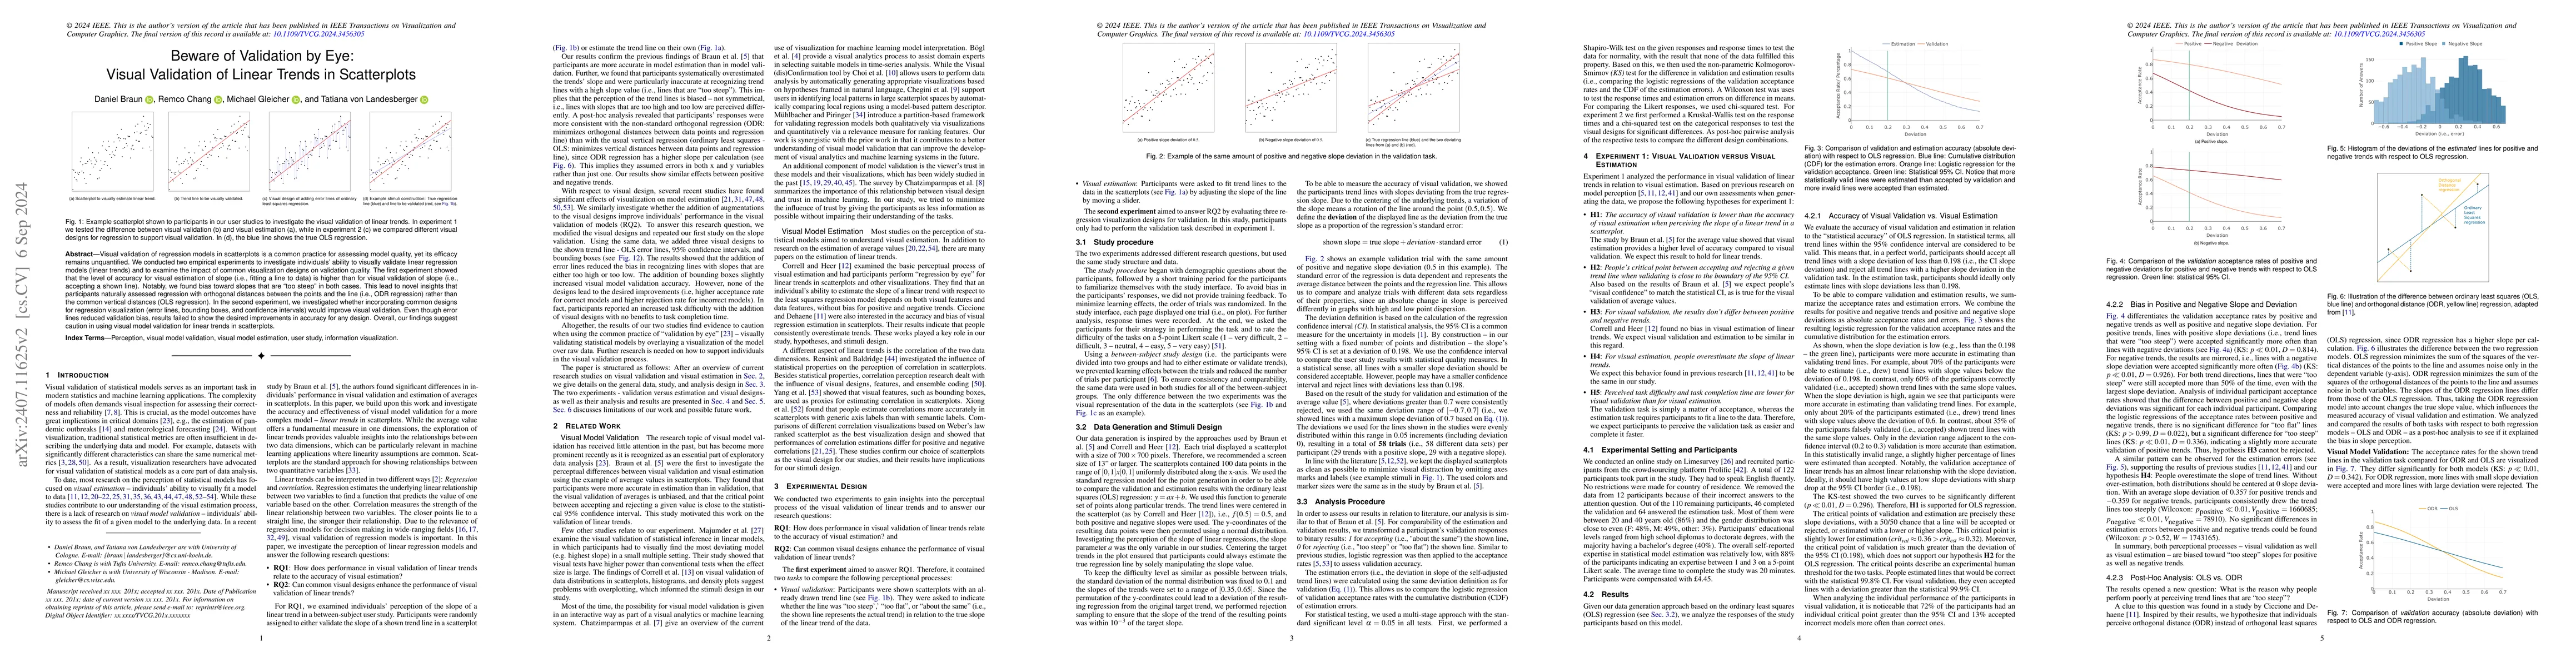
Adjusting Point Size to Facilitate More Accurate Correlation Perception in Scatterplots
|
Gabriel Strain, Andrew J. Stewart, Paul A. Warren, Caroline Jay
|
2023
|
View Paper
|
Average Estimates in Line Graphs Are Biased Toward Areas of Higher Variability
|
Dominik Moritz, Lace M. K. Padilla, F. Nguyen, S. Franconeri
|
2023
|
View Paper
|
Visual Validation versus Visual Estimation: A Study on the Average Value in Scatterplots
|
Daniel Braun, Ashley Suh, Remco Chang, Michael Gleicher, T. V. Landesberger
|
2023
|
View Paper
|
The Effects of Contrast on Correlation Perception in Scatterplots
|
Gabriel Strain, Andrew J. Stewart, P. Warren, C. Jay
|
2023
|
View Paper
|
Fitting Bell Curves to Data Distributions Using Visualization
|
E. Newburger, M. Correll, N. Elmqvist
|
2022
|
View Paper
|
How Do We Measure Trust in Visual Data Communication?
|
Hamza Elhamdadi, Aimen Gaba, Yea-Seul Kim, Cindy Xiong
|
2022
|
View Paper
|
Multiple Forecast Visualizations (MFVs): Trade-offs in Trust and Performance in Multiple COVID-19 Forecast Visualizations
|
Lace M. K. Padilla, Racquel Fygenson, Spencer C. Castro, E. Bertini
|
2022
|
View Paper
|
Seeing What You Believe or Believing What You See? Belief Biases Correlation Estimation
|
Cindy Xiong, Chase Stokes, Yea-Seul Kim, S. Franconeri
|
2022
|
View Paper
|
Hesitant Fuzzy Linear Regression Model for Decision Making
|
A. Sultan, W. Sałabun, Shahzad Faizi, Muhammad Ismail
|
2021
|
View Paper
|
The Weighted Average Illusion: Biases in Perceived Mean Position in Scatterplots
|
Matt-Heun Hong, J. Witt, D. Szafir
|
2021
|
View Paper
|
Designing for Interactive Exploratory Data Analysis Requires Theories of Graphical Inference
|
J. Hullman, A. Gelman
|
2021
|
View Paper
|
Visual Model Fit Estimation in Scatterplots: Influence of Amount and Decentering of Noise
|
Daniel Reimann, Christine Blech, Nilam Ram, R. Gaschler
|
2021
|
View Paper
|
Can humans perform mental regression on a graph? Accuracy and bias in the perception of scatterplots
|
Lorenzo Ciccione, S. Dehaene
|
2021
|
View Paper
|
No mark is an island: Precision and category repulsion biases in data reproductions
|
Caitlyn M. McColeman, Lane Harrison, Mi Feng, S. Franconeri
|
2020
|
View Paper
|
Global Forecasting Confirmed and Fatal Cases of COVID-19 Outbreak Using Autoregressive Integrated Moving Average Model
|
Debabrata Dansana, Raghvendra Kumar, Janmejoy Das Adhikari, Mans Mohapatra, Rohit Sharma, Ishaani Priyadarshini, Dac-Nhuong Le
|
2020
|
View Paper
|
Revealing Perceptual Proxies with Adversarial Examples
|
Brian D. Ondov, Fumeng Yang, M. Kay, N. Elmqvist, S. Franconeri
|
2020
|
View Paper
|
It Takes Two to Lie: One to Lie, and One to Listen
|
Denis Peskov, Benny Cheng, Ahmed Elgohary, Joe Barrow, Cristian Danescu-Niculescu-Mizil, Jordan L. Boyd-Graber
|
2020
|
View Paper
|
The State of the Art in Enhancing Trust in Machine Learning Models with the Use of Visualizations
|
Angelos Chatzimparmpas, R. M. Martins, Ilir Jusufi, Kostiantyn Kucher, Fabrice Rossi, A. Kerren
|
2020
|
View Paper
|
Uncertainty Visualization
|
Lace M. K. Padilla, M. Kay, J. Hullman
|
2020
|
View Paper
|
A survey of surveys on the use of visualization for interpreting machine learning models
|
Angelos Chatzimparmpas, R. M. Martins, Ilir Jusufi, A. Kerren
|
2020
|
View Paper
|
A Task-Based Taxonomy of Cognitive Biases for Information Visualization
|
Evanthia Dimara, S. Franconeri, C. Plaisant, A. Bezerianos, Pierre Dragicevic
|
2020
|
View Paper
|
Visual (dis)Confirmation: Validating Models and Hypotheses with Visualizations
|
In Kwon Choi, Nirmal Kumar Raveendranath, J. Westerfield, K. Reda
|
2019
|
View Paper
|
Correlation Judgment and Visualization Features: A Comparative Study
|
Fumeng Yang, Lane Harrison, Ronald A. Rensink, S. Franconeri, Remco Chang
|
2019
|
View Paper
|
Looks Good To Me: Visualizations As Sanity Checks
|
M. Correll, Mingwei Li, G. Kindlmann, C. Scheidegger
|
2019
|
View Paper
|
Perceptual proxies for extracting averages in data visualizations
|
Lei Yuan, Steve Haroz, S. Franconeri
|
2018
|
View Paper
|
Interactive Visual Exploration of Local Patterns in Large Scatterplot Spaces
|
Mohammad Chegini, Lin Shao, Robert Gregor, D. Lehmann, K. Andrews, Tobias Schreck
|
2018
|
View Paper
|
Regression by Eye: Estimating Trends in Bivariate Visualizations
|
M. Correll, Jeffrey Heer
|
2017
|
View Paper
|
Same Stats, Different Graphs: Generating Datasets with Varied Appearance and Identical Statistics through Simulated Annealing
|
Justin Matejka, G. Fitzmaurice
|
2017
|
View Paper
|
Four types of ensemble coding in data visualizations.
|
D. Szafir, Steve Haroz, Michael Gleicher, S. Franconeri
|
2016
|
View Paper
|
Beyond Weber's Law: A Second Look at Ranking Visualizations of Correlation
|
Matthew Kay, Jeffrey Heer
|
2016
|
View Paper
|
Non-expert interpretations of hurricane forecast uncertainty visualizations
|
Ian T. Ruginski, Alexander P. Boone, Lace M. K. Padilla, M. Hegarty, W. Thompson, D. House, Sarah H. Creem-Regehr
|
2016
|
View Paper
|
Visualization Analysis and Design
|
T. Munzner
|
2014
|
View Paper
|
Ranking Visualizations of Correlation Using Weber's Law
|
Lane Harrison, Fumeng Yang, S. Franconeri, Remco Chang
|
2014
|
View Paper
|
Perception of Average Value in Multiclass Scatterplots
|
Michael Gleicher, M. Correll, Christine Nothelfer, S. Franconeri
|
2013
|
View Paper
|
Visual Analytics for Model Selection in Time Series Analysis
|
M. Bögl, W. Aigner, P. Filzmoser, T. Lammarsch, S. Miksch, A. Rind
|
2013
|
View Paper
|
A Partition-Based Framework for Building and Validating Regression Models
|
T. Mühlbacher, H. Piringer
|
2013
|
View Paper
|
Validation of Visual Statistical Inference, Applied to Linear Models
|
M. Majumder, H. Hofmann, D. Cook
|
2013
|
View Paper
|
Statistics review 7: Correlation and regression
|
Viv Bewick, Liz Cheek, J. Ball
|
2003
|
View Paper
|
Effect of regression to the mean on decision making in health care
|
V. Morton, D. Torgerson
|
2003
|
View Paper
|
On the potential of assimilating meteorological analyses in a global climate model for the purpose of model validation
|
A. Jeuken, P. Siegmund, L. C. Heijboer, J. Feichter, L. Bengtsson
|
1996
|
View Paper
|
How not to lie with visualization
|
B. Rogowitz, L. Treinish, S. Bryson
|
1996
|
View Paper
|
Perceiving geographical slant
|
D. Proffitt, M. Bhalla, Rich Gossweiler, Jonathan Midgett
|
1995
|
View Paper
|
Linear models in decision making.
|
R. Dawes, Bernard Corrigan
|
1974
|
View Paper
|
On Simpson's Paradox and the Sure-Thing Principle
|
C. Blyth
|
1972
|
View Paper
|
A review of uncertainty visualization errors: Working memory as an explanatory theory
|
Lace M. K. Padilla, Spencer C. Castro, Helia Hosseinpour
|
2021
|
View Paper
|
Trust in Information Visualization
|
E. Mayr, Nicole Hynek, Saminu M. Salisu, F. Windhager
|
2019
|
View Paper
|
Familiarity Vs Trust: A Comparative Study of Domain Scientists' Trust in Visual Analytics and Conventional Analysis Methods
|
Aritra Dasgupta, Joon-Yong Lee, Ryan Wilson, Robert A. Lafrance, Nick Cramer, Kristin A. Cook, S. Payne
|
2017
|
View Paper
|
Journal of Economic Behavior & Organization
|
G. Charness, U. Gneezy, Michael A. Kuhn
|
|
View Paper
|
Likert-type scale response anchors
|
|
2006
|
|
Statistics with confidence: Confidence intervals and statistical guidelines .
|
D. Altman, D. Machin, T. Bryant, M. Gardner
|
1990
|
View Paper
|
Prolific · quickly find research participants you can trust
|
|
|
|
LimeSurvey Project Team / Carsten Schmitz
|
|
|
|
Comments (0)