Publication
Metrics
AI Quick Summary
This paper introduces design-specific transformations as a crucial step in visualization, emphasizing their role in rendering visualizations comprehensible. It proposes a new formalism integrating these transformations into the Information Visualization Reference Model, offering benefits like describing tasks as function compositions and enabling effective visualization analysis.
Paper Preview
Abstract
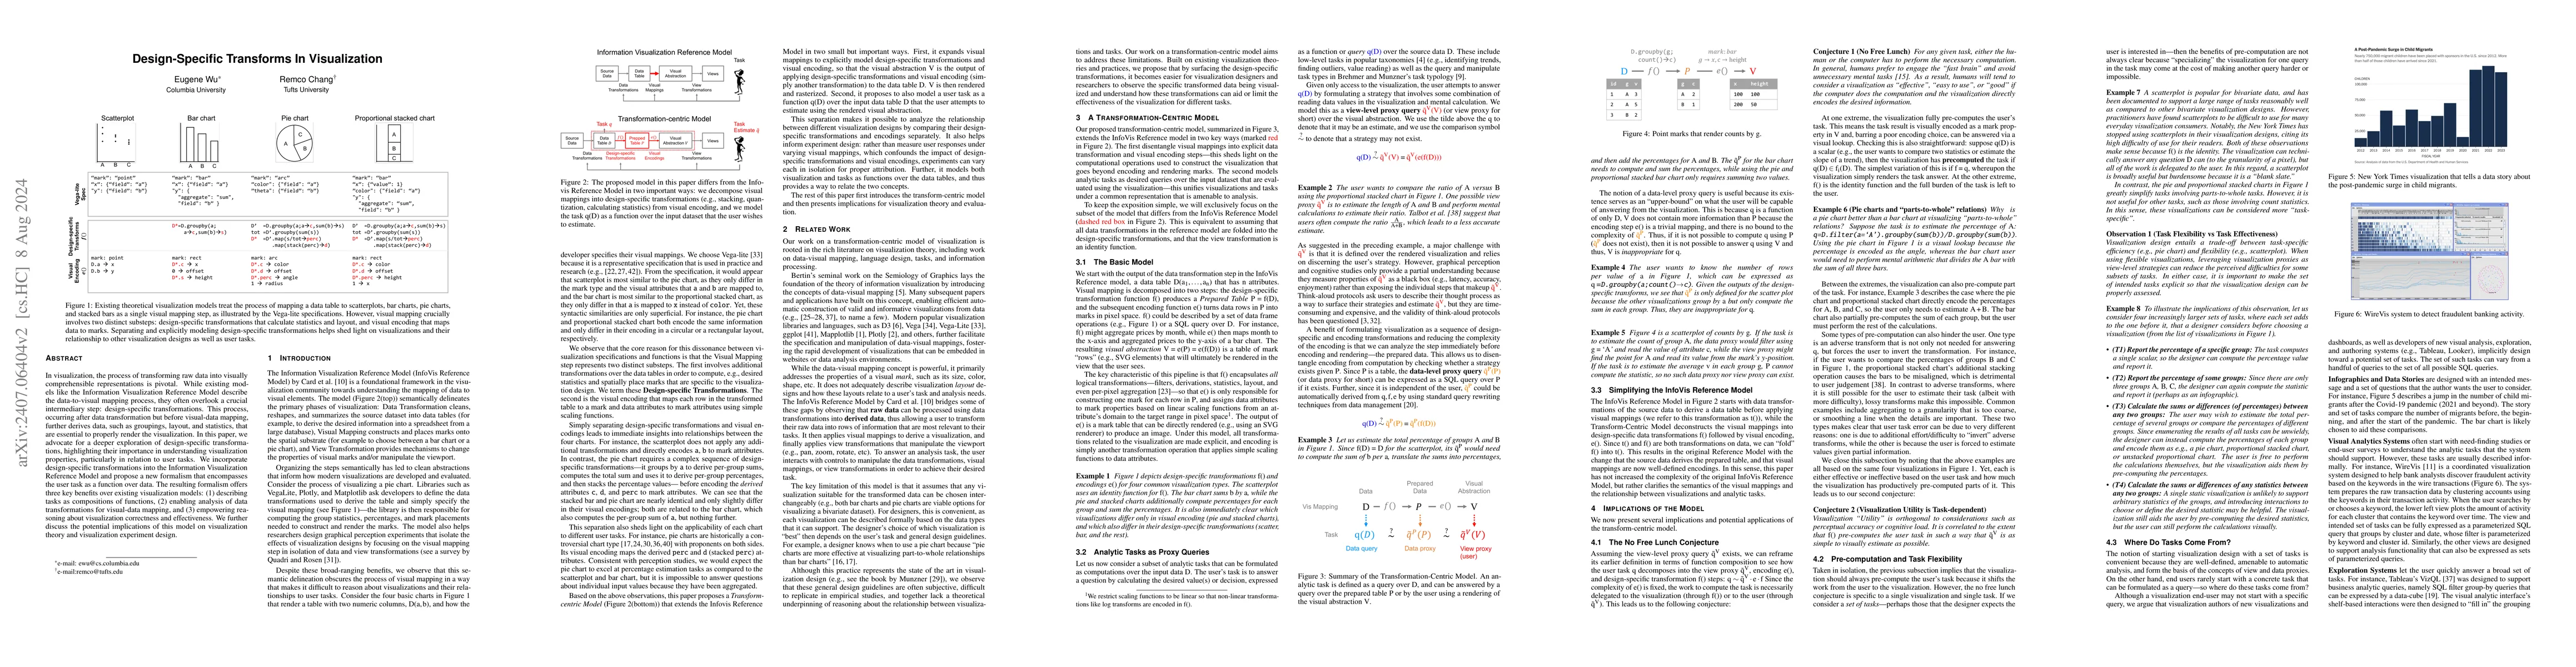
In visualization, the process of transforming raw data into visually comprehensible representations is pivotal. While existing models like the Information Visualization Reference Model describe the data-to-visual mapping process, they often overlook a crucial intermediary step: design-specific transformations. This process, occurring after data transformation but before visual-data mapping, further derives data, such as groupings, layout, and statistics, that are essential to properly render the visualization. In this paper, we advocate for a deeper exploration of design-specific transformations, highlighting their importance in understanding visualization properties, particularly in relation to user tasks. We incorporate design-specific transformations into the Information Visualization Reference Model and propose a new formalism that encompasses the user task as a function over data. The resulting formalism offers three key benefits over existing visualization models: (1) describing task as compositions of functions, (2) enabling analysis of data transformations for visual-data mapping, and (3) empowering reasoning about visualization correctness and effectiveness. We further discuss the potential implications of this model on visualization theory and visualization experiment design.
AI Key Findings
Get AI-generated insights about this paper's methodology, results, significance, and more — seven facets brought into focus.
Impact
Authors
PDF Preview
Citation Network
Current paper (gray), citations (green), references (blue)
Display is limited for performance on very large graphs.
Discussion 0