This paper introduces a grammar for formalizing analysis tasks in visual data analysis, enabling the operationalization and automation of user questions as hypotheses. It unifies three hypothesis spaces in visualization research and suggests its potential to advance visualization evaluation, knowledge elicitation, and analytic provenance.
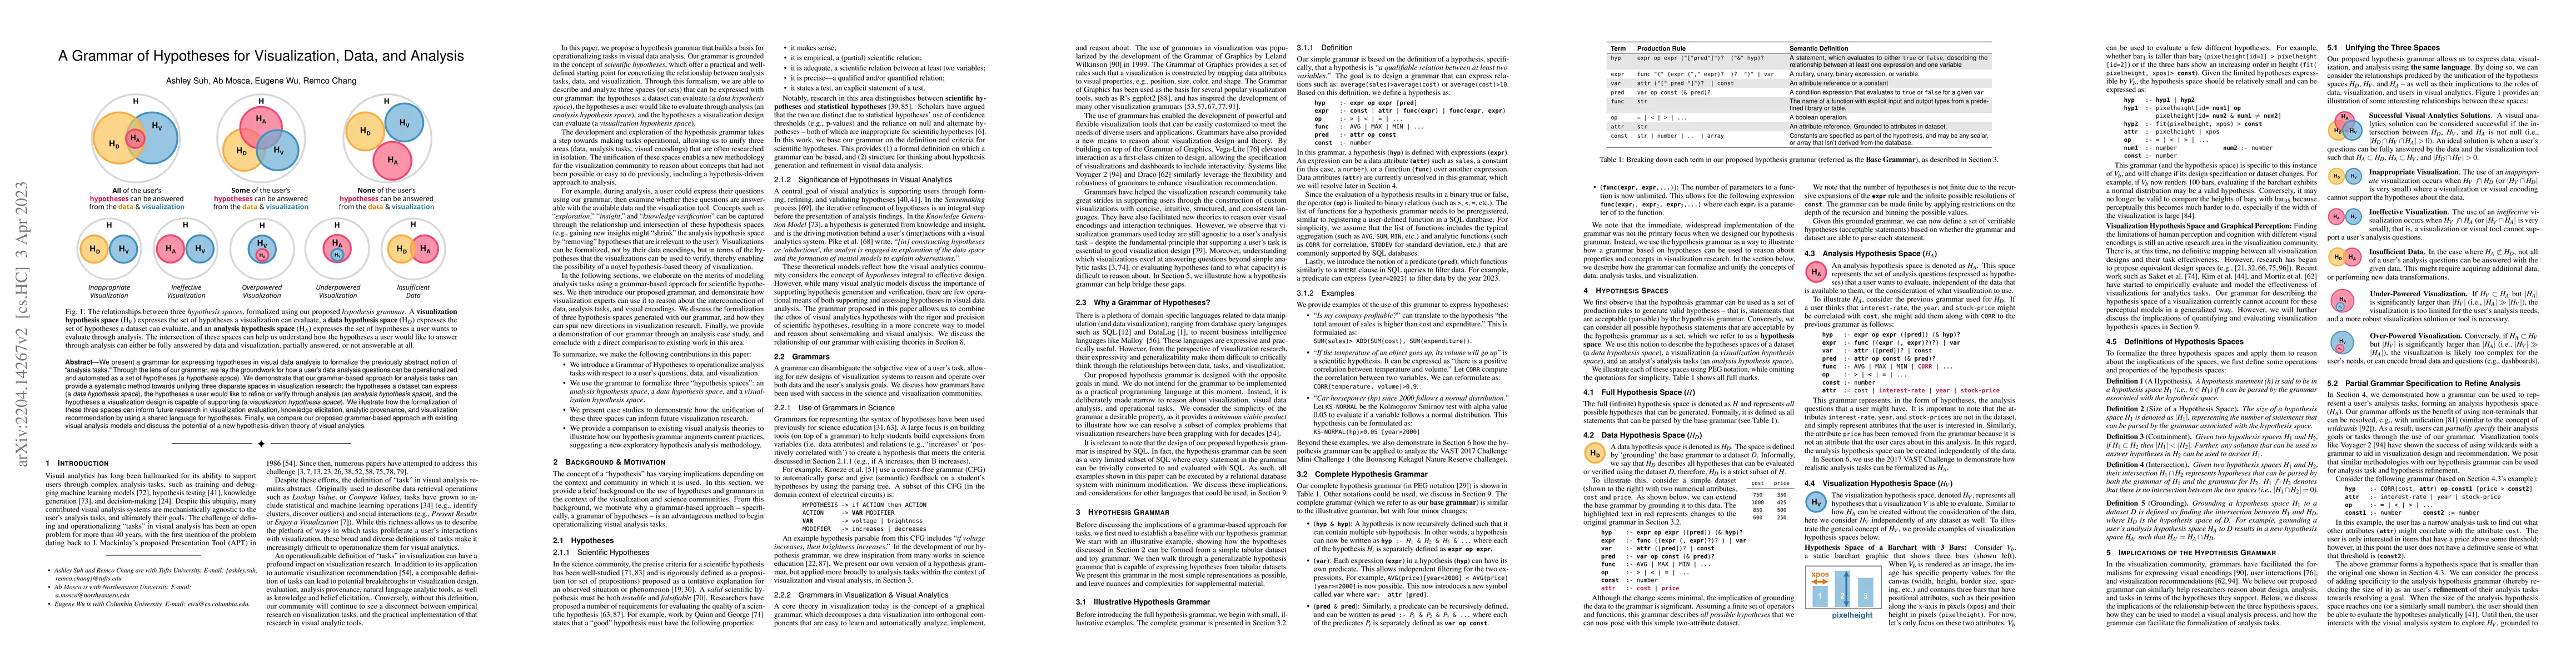
We present a grammar for expressing hypotheses in visual data analysis to formalize the previously abstract notion of "analysis tasks." Through the lens of our grammar, we lay the groundwork for how a user's data analysis questions can be operationalized and automated as a set of hypotheses (a hypothesis space). We demonstrate that our grammar-based approach for analysis tasks can provide a systematic method towards unifying three disparate spaces in visualization research: the hypotheses a dataset can express (a data hypothesis space), the hypotheses a user would like to refine or verify through analysis (an analysis hypothesis space), and the hypotheses a visualization design is capable of supporting (a visualization hypothesis space). We illustrate how the formalization of these three spaces can inform future research in visualization evaluation, knowledge elicitation, analytic provenance, and visualization recommendation by using a shared language for hypotheses. Finally, we compare our proposed grammar-based approach with existing visual analysis models and discuss the potential of a new hypothesis-driven theory of visual analytics.
Get AI-generated insights about this paper's methodology, results, and significance.
Current paper (gray), citations (green), references (blue)
Benjamin Bach, James Scott-Brown
Shunan Guo, Ryan Rossi, Jessica Hullman et al.
Leilani Battle, Shayan Monadjemi, Alvitta Ottley et al.
Title | Authors | Year | Actions |
---|---|---|---|
Vi(E)va LLM! A Conceptual Stack for Evaluating and Interpreting Generative AI-based Visualizations
|
L. Podo, M. Ishmal, M. Angelini
|
2024
|
View Paper |
Title | Authors | Year | Actions |
---|---|---|---|
Visual Belief Elicitation Reduces the Incidence of False Discovery
|
Ratanond Koonchanok, Gauri Yatindra Tawde, Gokul Ragunandhan Narayanasamy, Shalmali Walimbe, K. Reda
|
2023
|
View Paper |
FlowNL: Asking the Flow Data in Natural Languages
|
Jieyin Huang, Yang Xi, Junnan Hu, Jun Tao
|
2022
|
View Paper |
No Grammar to Rule Them All: A Survey of JSON-style DSLs for Visualization
|
A. Mcnutt
|
2022
|
View Paper |
Facilitating Conversational Interaction in Natural Language Interfaces for Visualization
|
Rishab Mitra, Arpit Narechania, A. Endert, J. Stasko
|
2022
|
View Paper |
VIBE: A Design Space for VIsual Belief Elicitation in Data Journalism
|
Shambhavi Mahajan, Bonnie Chen, Alireza Karduni, Yea-Seul Kim, Emily Wall
|
2022
|
View Paper |
A Critical Reflection on Visualization Research: Where Do Decision Making Tasks Hide?
|
Evanthia Dimara, J. Stasko
|
2021
|
View Paper |
Designing for Interactive Exploratory Data Analysis Requires Theories of Graphical Inference
|
J. Hullman, A. Gelman
|
2021
|
View Paper |
The data-hypothesis relationship
|
Teppo Felin, J. Koenderink, J. Krueger, D. Noble, G. Ellis
|
2021
|
View Paper |
Data Prophecy: Exploring the Effects of Belief Elicitation in Visual Analytics
|
Ratanond Koonchanok, Parul Baser, Abhinav Sikharam, Nirmal Kumar Raveendranath, K. Reda
|
2021
|
View Paper |
Communicating with Interactive Articles
|
Fred Hohman, Matthew Conlen, Jeffrey Heer, Duen Horng Chau
|
2020
|
View Paper |
CAVA: A Visual Analytics System for Exploratory Columnar Data Augmentation Using Knowledge Graphs
|
Dylan Cashman, Shenyu Xu, Subhajit Das, Florian Heimerl, Cong Liu, S. Humayoun, Michael Gleicher, A. Endert, Remco Chang
|
2020
|
View Paper |
A hypothesis is a liability
|
I. Yanai, M. Lercher
|
2020
|
View Paper |
Encodable: Configurable Grammar for Visualization Components
|
K. Wongsuphasawat
|
2020
|
View Paper |
NL4DV: A Toolkit for Generating Analytic Specifications for Data Visualization from Natural Language Queries
|
Arpit Narechania, Arjun Srinivasan, J. Stasko
|
2020
|
View Paper |
GoTree: A Grammar of Tree Visualizations
|
Guozheng Li, Min Tian, Q. Xu, Michael J. McGuffin, Xiaoru Yuan
|
2020
|
View Paper |
A Task-Based Taxonomy of Cognitive Biases for Information Visualization
|
Evanthia Dimara, S. Franconeri, C. Plaisant, A. Bezerianos, Pierre Dragicevic
|
2020
|
View Paper |
ggplot2
|
R. Irizarry
|
2019
|
View Paper |
Visual (dis)Confirmation: Validating Models and Hypotheses with Visualizations
|
In Kwon Choi, Nirmal Kumar Raveendranath, J. Westerfield, K. Reda
|
2019
|
View Paper |
Concept-Driven Visual Analytics: an Exploratory Study of Model- and Hypothesis-Based Reasoning with Visualizations
|
In Kwon Choi, Taylor Childers, Nirmal Kumar Raveendranath, Swati Mishra, Kyle Harris, K. Reda
|
2019
|
View Paper |
Correlation Judgment and Visualization Features: A Comparative Study
|
Fumeng Yang, Lane Harrison, Ronald A. Rensink, S. Franconeri, Remco Chang
|
2019
|
View Paper |
A Bayesian Cognition Approach to Improve Data Visualization
|
Yea-Seul Kim, Logan Walls, P. Krafft, J. Hullman
|
2019
|
View Paper |
Automated Feedback Can Improve Hypothesis Quality
|
K. Kroeze, Stéphanie M. van den Berg, A. Lazonder, B. Veldkamp, Ton de Jong
|
2019
|
View Paper |
VIS4ML: An Ontology for Visual Analytics Assisted Machine Learning
|
D. Sacha, Matthias Kraus, D. Keim, Min Chen
|
2019
|
View Paper |
Where's My Data? Evaluating Visualizations with Missing Data
|
Hayeong Song, D. Szafir
|
2019
|
View Paper |
Atom: A Grammar for Unit Visualizations
|
Deokgun Park, S. Drucker, R. Fernandez, N. Elmqvist
|
2018
|
View Paper |
Vega-Lite: A Grammar of Interactive Graphics
|
Arvind Satyanarayan, Dominik Moritz, Kanit Wongsuphasawat, Jeffrey Heer
|
2018
|
View Paper |
Formalizing Visualization Design Knowledge as Constraints: Actionable and Extensible Models in Draco
|
Dominik Moritz, Chenglong Wang, Greg L. Nelson, Halden Lin, Adam M. Smith, Bill Howe, Jeffrey Heer
|
2018
|
View Paper |
Exploratory data analysis
|
H. Hinterberger
|
2018
|
View Paper |
VizML: A Machine Learning Approach to Visualization Recommendation
|
K. Hu, Michiel A. Bakker, Stephen Li, Tim Kraska, César A. Hidalgo
|
2018
|
View Paper |
Assessing Effects of Task and Data Distribution on the Effectiveness of Visual Encodings
|
Younghoon Kim, Jeffrey Heer
|
2018
|
View Paper |
Investigating the Effect of the Multiple Comparisons Problem in Visual Analysis
|
Emanuel Zgraggen, Zheguang Zhao, R. Zeleznik, Tim Kraska
|
2018
|
View Paper |
HARK No More: On the Preregistration of CHI Experiments
|
A. Cockburn, C. Gutwin, A. Dix
|
2018
|
View Paper |
Exploring Lekagul Sensor Events using Rules, Aggregations, and Selections
|
B. Cappers
|
2017
|
View Paper |
ODIX: A Rapid Hypotheses Testing System for Origin-Destination Data IEEE VAST Challenge Award for Excellence in Spatio-temporal Graph Analytics
|
J. Buchmüller, Wolfgang Jentner, Dirk Streeb, D. Keim
|
2017
|
View Paper |
Interactive Visual Analytics Application for Spatiotemporal Movement Data VAST Challenge 2017 Mini-Challenge 1: Award for Actionable and Detailed Analysis
|
Yifei Guan, Kam Tin Seong
|
2017
|
View Paper |
Task-Based Effectiveness of Basic Visualizations
|
B. Saket, A. Endert, Çağatay Demiralp
|
2017
|
View Paper |
Visual Perceptual Learning and Models.
|
B. Dosher, Zhonglin Lu
|
2017
|
View Paper |
Explaining the Gap: Visualizing One's Predictions Improves Recall and Comprehension of Data
|
Yea-Seul Kim, Katharina Reinecke, J. Hullman
|
2017
|
View Paper |
Regression by Eye: Estimating Trends in Bivariate Visualizations
|
M. Correll, Jeffrey Heer
|
2017
|
View Paper |
Voyager 2: Augmenting Visual Analysis with Partial View Specifications
|
Kanit Wongsuphasawat, Zening Qu, Dominik Moritz, Riley Chang, Felix Ouk, Anushka Anand, J. Mackinlay, Bill Howe, Jeffrey Heer
|
2017
|
View Paper |
Controlling False Discoveries During Interactive Data Exploration
|
Zheguang Zhao, L. Stefani, Emanuel Zgraggen, Carsten Binnig, E. Upfal, Tim Kraska
|
2016
|
View Paper |
Towards a general-purpose query language for visualization recommendation
|
Kanit Wongsuphasawat, Dominik Moritz, Anushka Anand, J. Mackinlay, Bill Howe, Jeffrey Heer
|
2016
|
View Paper |
Towards Understanding Human Similarity Perception in the Analysis of Large Sets of Scatter Plots
|
Anshul Vikram Pandey, Josua Krause, Cristian Felix, Jeremy Boy, E. Bertini
|
2016
|
View Paper |
Voyager: Exploratory Analysis via Faceted Browsing of Visualization Recommendations
|
Kanit Wongsuphasawat, Dominik Moritz, Anushka Anand, J. Mackinlay, Bill Howe, Jeffrey Heer
|
2016
|
View Paper |
A classification of user tasks in visual analysis of volume data
|
B. Laha, D. Bowman, D. Laidlaw, J. Socha
|
2015
|
View Paper |
A Task Taxonomy for Temporal Graph Visualisation
|
Natalie Kerracher, J. Kennedy, K. Chalmers
|
2015
|
View Paper |
Knowledge Generation Model for Visual Analytics
|
D. Sacha, A. Stoffel, Florian Stoffel, Bum Chul Kwon, Geoffrey P. Ellis, D. Keim
|
2014
|
View Paper |
Ranking Visualizations of Correlation Using Weber's Law
|
Lane Harrison, Fumeng Yang, S. Franconeri, Remco Chang
|
2014
|
View Paper |
Four Experiments on the Perception of Bar Charts
|
Justin Talbot, V. Setlur, Anushka Anand
|
2014
|
View Paper |
Declarative interaction design for data visualization
|
Arvind Satyanarayan, Kanit Wongsuphasawat, Jeffrey Heer
|
2014
|
View Paper |
A matter of time: Applying a data-users-tasks design triangle to visual analytics of time-oriented data
|
S. Miksch, W. Aigner
|
2014
|
View Paper |
A Multi-Level Typology of Abstract Visualization Tasks
|
M. Brehmer, T. Munzner
|
2013
|
View Paper |
A Design Space of Visualization Tasks
|
Hans-Jörg Schulz, T. Nocke, M. Heitzler, H. Schumann
|
2013
|
View Paper |
A Systematic Review on the Practice of Evaluating Visualization
|
Tobias Isenberg, Petra Isenberg, Jing Chen, M. Sedlmair, Torsten Möller
|
2013
|
View Paper |
Design Study Methodology: Reflections from the Trenches and the Stacks
|
M. Sedlmair, Miriah D. Meyer, T. Munzner
|
2012
|
View Paper |
Developing the Research Hypothesis
|
A. Toledo, Robert M Flikkema, L. Toledo-Pereyra
|
2011
|
View Paper |
Graphical inference for infovis
|
H. Wickham, D. Cook, H. Hofmann, A. Buja
|
2010
|
View Paper |
Finding Out How They Find It Out: An empirical analysis of inquiry learners’ need for support
|
Y. Mulder, A. Lazonder, Ton de Jong
|
2010
|
View Paper |
Learning-based evaluation of visual analytic systems
|
Remco Chang, Caroline Ziemkiewicz, Roman Pyzh, Joseph Kielman, W. Ribarsky
|
2010
|
View Paper |
The Science of Interaction
|
W. Pike, J. Stasko, Remco Chang, T. O'Connell
|
2009
|
View Paper |
Toward a Deeper Understanding of the Role of Interaction in Information Visualization
|
Ji Soo Yi, Y. Kang, J. Stasko, J. Jacko
|
2007
|
View Paper |
A Data–Frame Theory of Sensemaking
|
Gary Klein, Jennifer K. Phillips, Erica Rall, Deborah A. Peluso
|
2007
|
View Paper |
Issues in computer supported inquiry learning in science
|
W. Joolingen, T. Jong, Angelique Dimitrakopoulou
|
2007
|
View Paper |
The Grammar of Graphics
|
Mark Bailey
|
2007
|
View Paper |
Challenges in Visual Data Analysis
|
D. Keim, Florian Mansmann, Jörn Schneidewind, H. Ziegler
|
2006
|
View Paper |
Toward measuring visualization insight
|
Chris North
|
2006
|
View Paper |
Technological Advances in Inquiry Learning
|
Ton de Jong
|
2006
|
View Paper |
Low-level components of analytic activity in information visualization
|
R. Amar, James R. Eagan, J. Stasko
|
2005
|
View Paper |
The Relation between Prior Knowledge and Students' Collaborative Discovery Learning Processes.
|
H. Gijlers, T. Jong
|
2005
|
View Paper |
The Presumptions of Expertise: The Role of Ethos in Risk Analysis
|
Carolyn R. Miller
|
2004
|
View Paper |
Parsing expression grammars: a recognition-based syntactic foundation
|
B. Ford
|
2004
|
View Paper |
Scientific method in practice
|
H. Gauch
|
2002
|
View Paper |
Social Studies for the Elementary and Middle Grades: A Constructivist Approach
|
C. Sunal, M. Haas
|
2001
|
View Paper |
An operator interaction framework for visualization systems
|
Ed H. Chi, J. Riedl
|
1998
|
View Paper |
Foundations of Databases
|
S. Abiteboul, R. Hull, V. Vianu
|
1994
|
View Paper |
Task-analytic approach to the automated design of graphic presentations
|
S. Casner
|
1991
|
View Paper |
The Logic of Scientific Discovery
|
G. Jason
|
1988
|
View Paper |
Automating the design of graphical presentations of relational information
|
J. Mackinlay
|
1986
|
View Paper |
Teaching hypothesis formation
|
M. Quinn, K. D. George
|
1975
|
View Paper |
SEQUEL: A structured English query language
|
D. Chamberlin, Raymond F. Boyce
|
1974
|
View Paper |
Task Taxonomy: Science or Technology?
|
R. B. Miller
|
1967
|
View Paper |
The Difference between Statistical Hypotheses and Scientific Hypotheses
|
R. Bolles
|
1962
|
View Paper |
Three models for the description of language
|
N. Chomsky
|
1956
|
View Paper |
An Introduction to Logic and Scientific Method
|
M. Cohen, E. Nagel
|
1934
|
View Paper |
TaskVis: Task-oriented Visualization Recommendation
|
Leixian Shen, Enya Shen, Zhiwei Tai, Yiran Song, Jianmin Wang
|
2021
|
View Paper |
Imagining Replications: Graphical Prediction & Discrete Visualizations Improve Recall & Estimation of Effect Uncertainty
|
J. Hullman, Matthew Kay, Yea-Seul Kim, Samana Shrestha
|
2018
|
View Paper |
Scatterplots: Tasks, Data, and Designs
|
Alper Sarıkaya, Michael Gleicher
|
2018
|
View Paper |
Making data visual - a practical guide to using visualization for insight
|
D. Fisher, Miriah D. Meyer
|
2018
|
View Paper |
Mystery at legakul preserve: The pipits kick it
|
2017
|
||
Articulate 2 : Toward a Conversational Interface for Visual Data Exploration
|
Jillian Aurisano
|
2016
|
View Paper |
The Sensemaking Process and Leverage Points for Analyst Technology as Identified Through Cognitive Task Analysis
|
P. Pirolli, Stuart Card
|
2015
|
View Paper |
A User-centric Taxonomy for Multidimensional Data Projection Tasks
|
Ronak Etemadpour, L. Linsen, C. Crick, A. Forbes
|
2015
|
View Paper |
You draw it: How family income predicts children’s college chances
|
2015
|
||
Introduction: The vast challenge: History, scope, and outcomes: An introduction to the special issue
|
2014
|
||
Mastering the Information Age - Solving Problems with Visual Analytics
|
D. Keim, J. Kohlhammer, Geoffrey P. Ellis, Florian Mansmann
|
2010
|
View Paper |
Definition of Scientific Hypothesis: A Generalization or a Causal Explanation?
|
Jin-Su Jeong, Yong-Ju Kwon
|
2006
|
View Paper |
Here is the evidence, now what is the hypothesis? The complementary roles of inductive and hypothesis-driven science in the post-genomic era.
|
D. Kell, S. Oliver
|
2004
|
View Paper |
An Introduction to Unification-Based Approaches to Grammar
|
Stuart M. Shieber
|
1986
|
View Paper |
Showing first page preview. Click "Open Full PDF" to view the complete paper.
Your comment contains inappropriate language and has been rejected.
Are you sure you want to remove this tag? This action cannot be undone.
Someone just favorited a paper!
Comments (0)