NetPanorama is a declarative language designed to simplify the creation of complex network visualizations through a pipeline of customizable steps, aiming to streamline the iterative design process and enhance transparency in data transformations and visual mappings. The tool facilitates the exploration of diverse network visualizations with minimal implementation overhead.
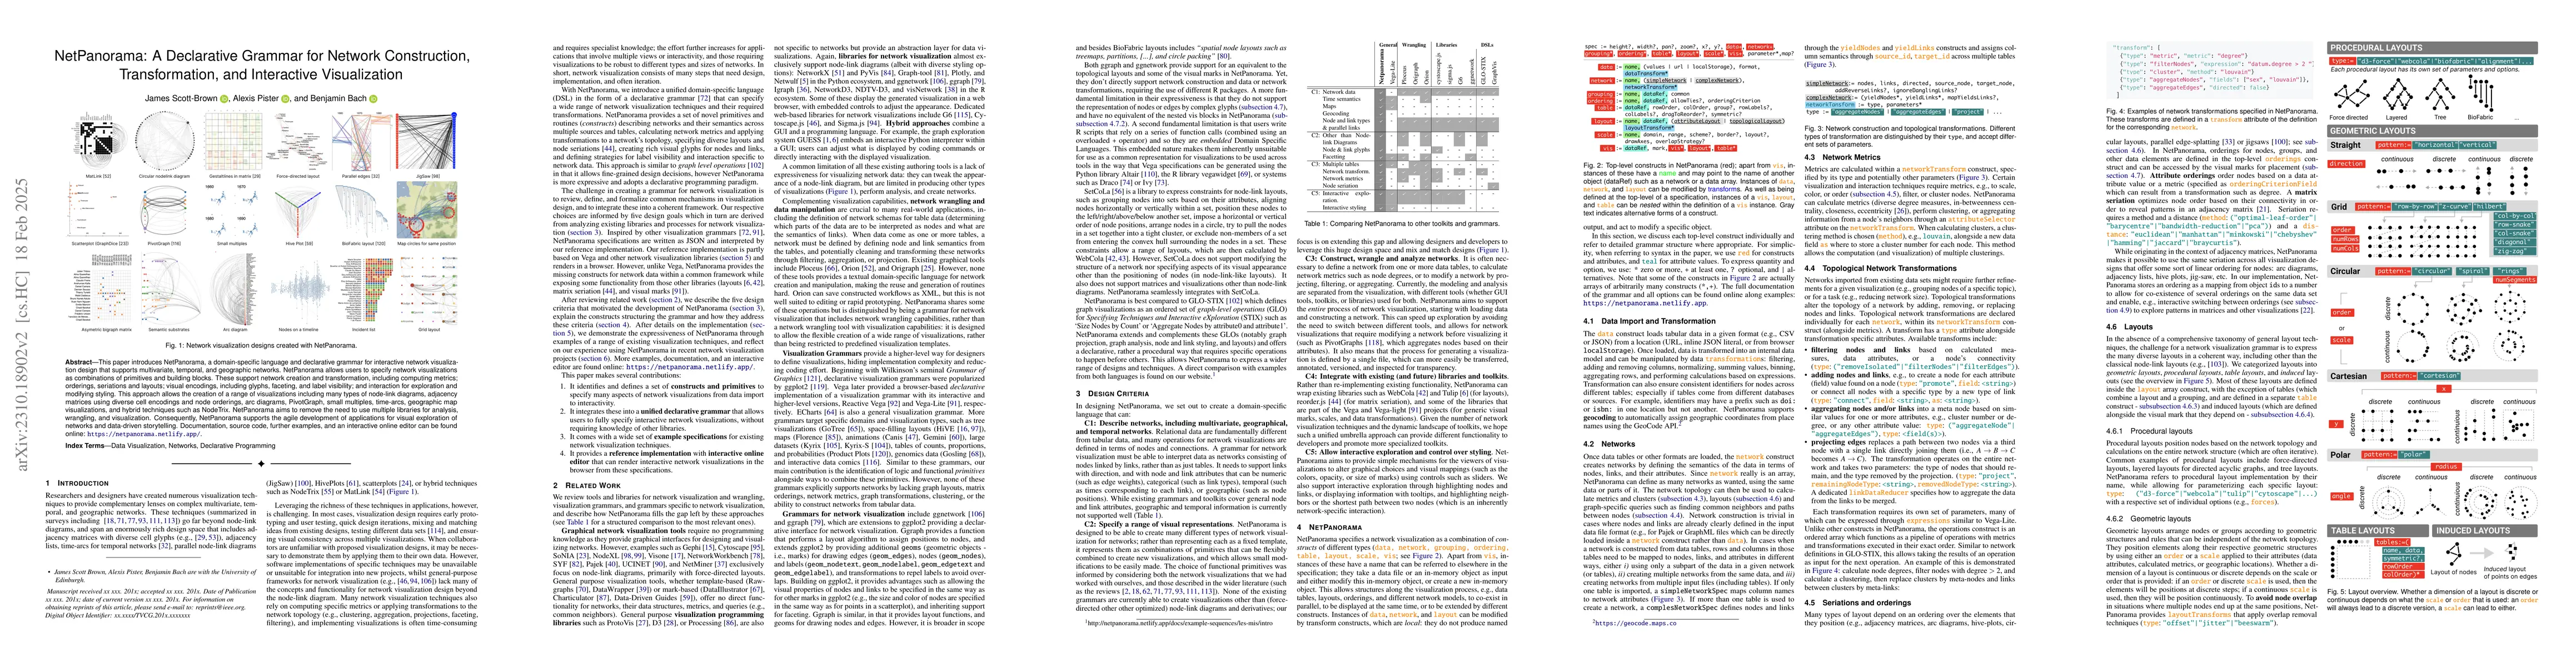
This paper introduces NetPanorama, a domain-specific language and declarative grammar for interactive network visualizations. Exploring complex networks with multivariate, geographical, or temporal information often require bespoke visualization designs, such as adjacency matrices, arc-diagrams, small multiples, timelines, or geographic map visualizations. However, creating these requires implementing data loading, data transformations, visualization, and interactivity, which is time-consuming and slows down the iterative exploration of this huge design space. With NetPanorama, a developer specifies a network visualization design as a pipeline of parameterizable steps. Our specification and reference implementation aims to facilitate visualization development and reuse; allow for easy design exploration and iteration; and make data transformation and visual mapping decisions transparent. Documentation, source code, examples, and an interactive online editor can be found online: https://netpanorama.netlify.app/
This graph shows how this paper is connected to other research. The current paper is shown in dark gray, papers that cite it are in green, and papers it references are in blue. You can:
• Hover over any node to see the paper title
• Click a node to view that paper's details
• Drag nodes to rearrange the graph
• Use the zoom controls (bottom right) to zoom in/out
Title | Authors | Year | Actions |
---|---|---|---|
Constraint-Based Breakpoints for Responsive Visualization Design and Development
|
Sarah Schöttler, J. Dykes, Jo Wood, Uta Hinrichs, Benjamin Bach
|
2024
|
View Paper |
Title | Authors | Year | Actions |
---|---|---|---|
Understanding Barriers to Network Exploration with Visualization: A Report from the Trenches
|
Mashael AlKadi, Vanessa Serrano, James Scott-Brown, C. Plaisant, Jean-Daniel Fekete, Uta Hinrichs, B. Bach
|
2022
|
View Paper |
No Grammar to Rule Them All: A Survey of JSON-style DSLs for Visualization
|
A. Mcnutt
|
2022
|
View Paper |
Demonstration of VegaPlus: Optimizing Declarative Visualization Languages
|
Junran Yang, Kevin Hyekang Joo, Sai Yerramreddy, Siyao Li, Dominik Moritz, L. Battle
|
2022
|
View Paper |
G6: A web-based library for graph visualization
|
Yanyan Wang, Zhanning Bai, Zhi Lin, Xiaoqing Dong, Yingchaojie Feng, Jiacheng Pan, Wei Chen
|
2021
|
View Paper |
Gosling: A Grammar-based Toolkit for Scalable and Interactive Genomics Data Visualization
|
S. L’Yi, Qianwen Wang, Fritz Lekschas, Nils Gehlenborg
|
2021
|
View Paper |
Simultaneous Matrix Orderings for Graph Collections
|
Nathan van Beusekom, Wouter Meulemans, B. Speckmann
|
2021
|
View Paper |
Interactive Data Comics
|
Zezhong Wang, Hugo Romat, Fanny Chevalier, N. Riche, Dave Murray-Rust, Benjamin Bach
|
2021
|
View Paper |
Integrated Visualization Editing via Parameterized Declarative Templates
|
A. Mcnutt, Ravi Chugh
|
2021
|
View Paper |
Visualizing and Interacting with Geospatial Networks: A Survey and Design Space
|
Sarah Schöttler, Yalong Yang, H. Pfister, B. Bach
|
2021
|
View Paper |
Florence: a Web-based Grammar of Graphics for Making Maps and Learning Cartography
|
A. Poorthuis, Lucas van der Zee, Grace Guo, Jo Hsi Keong, Bianchi Dy
|
2020
|
View Paper |
Gemini: A Grammar and Recommender System for Animated Transitions in Statistical Graphics
|
Younghoon Kim, Jeffrey Heer
|
2020
|
View Paper |
Kyrix-S: Authoring Scalable Scatterplot Visualizations of Big Data
|
Wenbo Tao, Xinli Hou, Adam Sah, L. Battle, Remco Chang, M. Stonebraker
|
2020
|
View Paper |
Canis: A High‐Level Language for Data‐Driven Chart Animations
|
Tong Ge, Yue Zhao, Bongshin Lee, Donghao Ren, Baoquan Chen, Yunhai Wang
|
2020
|
View Paper |
GoTree: A Grammar of Tree Visualizations
|
Guozheng Li, Min Tian, Q. Xu, Michael J. McGuffin, Xiaoru Yuan
|
2020
|
View Paper |
Netwulf: Interactive visualization of networks in Python
|
Ulf Aslak, B. Maier
|
2019
|
View Paper |
Data Changes Everything: Challenges and Opportunities in Data Visualization Design Handoff
|
Jagoda Walny, Christian Frisson, Mieka West, Doris Kosminsky, S. Knudsen, Sheelagh Carpendale, Wesley Willett
|
2019
|
View Paper |
Kyrix: Interactive Pan/Zoom Visualizations at Scale
|
Wenbo Tao, Xiaoyu Liu, Yedi Wang, L. Battle, Çağatay Demiralp, Remco Chang, M. Stonebraker
|
2019
|
View Paper |
The State of the Art in Visualizing Multivariate Networks
|
C. Nobre, Miriah D. Meyer, M. Streit, A. Lex
|
2019
|
View Paper |
The State of the Art in Multilayer Network Visualization
|
M. Ghoniem, F. McGee, G. Melançon, B. Otjacques, Bruno Pinaud
|
2019
|
View Paper |
DXR: A Toolkit for Building Immersive Data Visualizations
|
Ronell Sicat, Jiabao Li, Junyoung Choi, Maxime Cordeil, W. Jeong, Benjamin Bach, H. Pfister
|
2019
|
View Paper |
Charticulator: Interactive Construction of Bespoke Chart Layouts
|
Donghao Ren, Bongshin Lee, M. Brehmer
|
2019
|
View Paper |
Origraph: Interactive Network Wrangling
|
Alex Bigelow, C. Nobre, Miriah D. Meyer, A. Lex
|
2018
|
View Paper |
Altair: Interactive Statistical Visualizations for Python
|
J. Vanderplas, B. Granger, Jeffrey Heer, Dominik Moritz, Kanit Wongsuphasawat, Arvind Satyanarayan, Eitan Lees, I. Timofeev, Ben Welsh, Scott Sievert
|
2018
|
View Paper |
Vega-Lite: A Grammar of Interactive Graphics
|
Arvind Satyanarayan, Dominik Moritz, Kanit Wongsuphasawat, Jeffrey Heer
|
2018
|
View Paper |
Formalizing Visualization Design Knowledge as Constraints: Actionable and Extensible Models in Draco
|
Dominik Moritz, Chenglong Wang, Greg L. Nelson, Halden Lin, Adam M. Smith, Bill Howe, Jeffrey Heer
|
2018
|
View Paper |
Exploring the Limits of Complexity: A Survey of Empirical Studies on Graph Visualisation
|
Vahan Yoghourdjian, D. Archambault, S. Diehl, Tim Dwyer, Karsten Klein, H. Purchase, Hsiang-Yun Wu
|
2018
|
View Paper |
SetCoLa: High-Level Constraints for Graph Layout
|
J. Hoffswell, A. Borning, Jeffrey Heer
|
2018
|
View Paper |
ECharts: A declarative framework for rapid construction of web-based visualization
|
Deqing Li, Honghui Mei, Yi Shen, Shuang Su, Wenli Zhang, Junting Wang, Ming Zu, Wei Chen
|
2018
|
View Paper |
State of the Art in Edge and Trail Bundling Techniques
|
Antoine Lhuillier, C. Hurter, A. Telea
|
2017
|
View Paper |
Network Visualization with ggplot2
|
Samantha Tyner, F. Briatte, H. Hofmann
|
2017
|
View Paper |
Centrality measures in networks
|
Francis Bloch, M. Jackson, Pietro Tebaldi
|
2016
|
View Paper |
Matrix Reordering Methods for Table and Network Visualization
|
M. Behrisch, Benjamin Bach, N. Riche, Tobias Schreck, Jean-Daniel Fekete
|
2016
|
View Paper |
Reactive Vega: A Streaming Dataflow Architecture for Declarative Interactive Visualization
|
Arvind Satyanarayan, Ryan Russell, J. Hoffswell, Jeffrey Heer
|
2016
|
View Paper |
Time Curves: Folding Time to Visualize Patterns of Temporal Evolution in Data
|
Benjamin Bach, Conglei Shi, Nicolas Heulot, T. Madhyastha, T. Grabowski, Pierre Dragicevic
|
2016
|
View Paper |
Reducing Snapshots to Points: A Visual Analytics Approach to Dynamic Network Exploration
|
S. V. D. Elzen, Danny Holten, Jorik Blaas, J. V. Wijk
|
2016
|
View Paper |
Reorder.js: A JavaScript Library to Reorder Tables and Networks
|
Jean-Daniel Fekete
|
2015
|
View Paper |
NetworkCube: Bringing Dynamic Network Visualizations to Domain Scientists
|
Benjamin Bach, N. Riche, R. Fernandez, Emmanoulis Giannisakis, Bongshin Lee, Jean-Daniel Fekete
|
2015
|
View Paper |
Cytoscape.js: a graph theory library for visualisation and analysis
|
M. Franz, C. Lopes, Gerardo Huck, Yue Dong, Selçuk Onur Sümer, Gary D Bader
|
2015
|
View Paper |
Small MultiPiles: Piling Time to Explore Temporal Patterns in Dynamic Networks
|
Benjamin Bach, N. Riche, Tim Dwyer, T. Madhyastha, Jean-Daniel Fekete, T. Grabowski
|
2015
|
View Paper |
Unravelling Graph-Exchange File Formats
|
M. Roughan, Simon Jonathan Tuke
|
2015
|
View Paper |
GLO-STIX: Graph-Level Operations for Specifying Techniques and Interactive eXploration
|
Charles D. Stolper, Minsuk Kahng, Zhiyuan Jerry Lin, Florian Foerster, Aakash Goel, J. Stasko, Duen Horng Chau
|
2014
|
View Paper |
The graph-tool python library
|
Tiago P. Peixoto
|
2014
|
View Paper |
Dynamic Network Visualization withExtended Massive Sequence Views
|
S. V. D. Elzen, Danny Holten, Jorik Blaas, J. V. Wijk
|
2014
|
View Paper |
Visualizing dynamic networks with matrix cubes
|
Benjamin Bach, Emmanuel Pietriga, Jean-Daniel Fekete
|
2014
|
View Paper |
A Task Taxonomy for Network Evolution Analysis
|
Jae-wook Ahn, C. Plaisant, B. Shneiderman
|
2014
|
View Paper |
Ploceus: Modeling, visualizing, and analyzing tabular data as networks
|
Zhicheng Liu, S. Navathe, J. Stasko
|
2014
|
View Paper |
Handbook on Graph Drawing and Visualization
|
R. Tamassia
|
2013
|
View Paper |
Capturing the Design Space of Sequential Space-Filling Layouts
|
Thomas Baudel, B. Broeksema
|
2012
|
View Paper |
Combing the hairball with BioFabric: a new approach for visualization of large networks
|
William J. R. Longabaugh
|
2012
|
View Paper |
Hive plots - rational approach to visualizing networks
|
M. Krzywinski, I. Birol, Steven J. M. Jones, M. Marra
|
2012
|
View Paper |
Exploring the design space of interactive link curvature in network diagrams
|
N. Riche, Tim Dwyer, Bongshin Lee, Sheelagh Carpendale
|
2012
|
View Paper |
Orion: A system for modeling, transformation and visualization of multidimensional heterogeneous networks
|
Jeffrey Heer, Adam Perer
|
2011
|
View Paper |
D³ Data-Driven Documents
|
M. Bostock, Vadim Ogievetsky, Jeffrey Heer
|
2011
|
View Paper |
Product Plots
|
H. Wickham, H. Hofmann
|
2011
|
View Paper |
In Situ Exploration of Large Dynamic Networks
|
S. Hadlak, Hans-Jörg Schulz, H. Schumann
|
2011
|
View Paper |
Visual Analysis of Large Graphs: State‐of‐the‐Art and Future Research Challenges
|
T. V. Landesberger, Arjan Kuijper, Tobias Schreck, J. Kohlhammer, J. V. Wijk, Jean-Daniel Fekete, D. Fellner
|
2011
|
View Paper |
An extended evaluation of the readability of tapered, animated, and textured directed-edge representations in node-link graphs
|
Danny Holten, Petra Isenberg, J. V. Wijk, Jean-Daniel Fekete
|
2011
|
View Paper |
GraphDice: A System for Exploring Multivariate Social Networks
|
A. Bezerianos, Fanny Chevalier, Pierre Dragicevic, N. Elmqvist, Jean-Daniel Fekete
|
2010
|
View Paper |
A Layered Grammar of Graphics
|
Hadley Wickham
|
2010
|
View Paper |
Protovis: A Graphical Toolkit for Visualization
|
M. Bostock, Jeffrey Heer
|
2009
|
View Paper |
ABySS-Explorer: Visualizing Genome Sequence Assemblies
|
C. Nielsen, S. Jackman, I. Birol, Steven J. M. Jones
|
2009
|
View Paper |
Configuring Hierarchical Layouts to Address Research Questions
|
A. Slingsby, J. Dykes, J. Wood
|
2009
|
View Paper |
Analyzing (social media) networks with NodeXL
|
Marc A. Smith, B. Shneiderman, Natasa Milic-Frayling, E. M. Rodrigues, Vladimir Barash, Cody Dunne, Tony Capone, Adam Perer, Eric Gleave
|
2009
|
View Paper |
Topology-aware navigation in large networks
|
T. Moscovich, Fanny Chevalier, N. Riche, Emmanuel Pietriga, Jean-Daniel Fekete
|
2009
|
View Paper |
Gephi: An Open Source Software for Exploring and Manipulating Networks
|
Mathieu Bastian, Sebastien Heymann, Mathieu Jacomy
|
2009
|
View Paper |
Exploring Network Structure, Dynamics, and Function using NetworkX
|
A. Hagberg, D. Schult, P. Swart, JM Hagberg
|
2008
|
View Paper |
Fast unfolding of communities in large networks
|
V. Blondel, Jean-Loup Guillaume, R. Lambiotte, E. Lefebvre
|
2008
|
View Paper |
Animated Transitions in Statistical Data Graphics
|
Jeffrey Heer, G. Robertson
|
2007
|
View Paper |
Jigsaw: Supporting Investigative Analysis through Interactive Visualization
|
J. Stasko, C. Görg, Zhicheng Liu
|
2007
|
View Paper |
The Grammar of Graphics
|
Mark Bailey
|
2007
|
View Paper |
IPSep-CoLa: An Incremental Procedure for Separation Constraint Layout of Graphs
|
Tim Dwyer, Y. Koren, K. Marriott
|
2006
|
View Paper |
Exploratory social network analysis with Pajek
|
Bethany S. Dohleman
|
2006
|
View Paper |
Network Visualization by Semantic Substrates
|
B. Shneiderman, Aleks Aris
|
2006
|
View Paper |
Hierarchical Edge Bundles: Visualization of Adjacency Relations in Hierarchical Data
|
Danny Holten
|
2006
|
View Paper |
Processing: programming for the media arts
|
Casey Reas, Benjamin Fry
|
2006
|
View Paper |
Task taxonomy for graph visualization
|
Bongshin Lee, C. Plaisant, C. Parr, Jean-Daniel Fekete, N. Riche
|
2006
|
View Paper |
GUESS: a language and interface for graph exploration
|
Eytan Adar
|
2006
|
View Paper |
Visual exploration of multivariate graphs
|
M. Wattenberg
|
2006
|
View Paper |
Cytoscape: a software environment for integrated models of biomolecular interaction networks.
|
Paul Shannon, Andrew Markiel, Owen Ozier, N. Baliga, Jonathan T Wang, Daniel Ramage, Nada Amin, Benno Schwikowski, T. Ideker
|
2003
|
View Paper |
Overlaying Graph Links on Treemaps
|
Jean-Daniel Fekete, David Wang, Niem Dang, C. Plaisant
|
2003
|
View Paper |
Visualizing Related Metabolic Pathways in Two and a Half Dimensions
|
U. Brandes, Tim Dwyer, F. Schreiber
|
2003
|
View Paper |
Extending Distortion Viewing from 2D to 3D
|
M. Carpendale, D. Cowperthwaite, F. Fracchia
|
1997
|
View Paper |
Data Illustrator
|
2021
|
View Paper | |
Information Graphics
|
A. Griffin
|
2020
|
View Paper |
TULIP 5
|
D. Auber, D. Archambault, Romain Bourqui, M. Delest, Jonathan Dubois, Antoine Lambert, Patrick Mary, Morgan Mathiaut, G. Melançon, Bruno Pinaud, B. Renoust, J. Vallet
|
2019
|
View Paper |
An-imated edge textures in node-link diagrams
|
2018
|
||
Data-Driven Guides: Supporting Expressive Design for Information Graphics
|
N. Kim, Eston Schweickart, Zhicheng Liu, Mira Dontcheva, Wilmot Li, J. Popović, H. Pfister
|
2017
|
View Paper |
Towards Unambiguous Edge Bundling: Investigating Confluent Drawings for Network Visualization
|
Benjamin Bach, N. Riche, C. Hurter, K. Marriott, Tim Dwyer
|
2017
|
View Paper |
The State of the Art in Visualizing Group Structures in Graphs
|
Corinna Vehlow, Fabian Beck, D. Weiskopf
|
2015
|
View Paper |
The State of the Art in Visualizing Dynamic Graphs
|
Fabian Beck, Michael Burch, S. Diehl, D. Weiskopf
|
2014
|
View Paper |
A Survey of Visualization Construction User Interfaces
|
Lars Grammel, C. Bennett, Melanie Tory, M. Storey
|
2013
|
View Paper |
Sciences-Po médialab and OuestWare
|
2013
|
||
cola.js: Constraint-Based Layout in the Browser
|
2013
|
||
Visualizing Network Data
|
G. Wills
|
2009
|
View Paper |
visone - Software for the Analysis and Visualization of Social Networks
|
Michael Baur
|
2008
|
View Paper |
Systematic yet flexible discovery
|
2008
|
||
The igraph software package for complex network research
|
Gábor Csárdi, T. Nepusz
|
2006
|
View Paper |
The Art and Science of Dynamic Network Visualization
|
Skye Bender-deMoll, Daniel A. McFarland
|
2006
|
View Paper |
NWB Team
|
2006
|
||
UCINET for windows: Software for social network analysis
|
2002
|
||
Eurographics/ Ieee-vgtc Symposium on Visualization 2008 Timeradartrees: Visualizing Dynamic Compound Digraphs
|
A. Vilanova, A. Telea, G. Scheuermann, T. Möller, M. Burch, S. Diehl
|
View Paper | |
NodeXL: a free and open network overview, discovery and exploration add-in for excel 2007/2010/2013/2016 from the social media research foundation, 2010. 2
|
|||
Lyttle and Vega/Vega-Lite Developers
|
Showing first page preview. Click "Open Full PDF" to view the complete paper.
Remco Chang, Ashley Suh, Eugene Wu, Ab Mosca
Published: 2023-04-05
Qi Wu, Kwan-Liu Ma, Jacqueline H. Chen, Konduri Aditya, Oleg Igouchkine, Tyson Neuroth
Published: 2023-03-30
You need to log in to post a comment.
Your comment contains inappropriate language.
Are you sure you want to remove this tag?
Someone just favorited a paper!
Comments (0)