This paper introduces Encodable, a configurable grammar for visualization components that aims to standardize APIs and functionalities across different libraries. It decouples visualization grammar from rendering engines and demonstrates how to build components using this grammar.
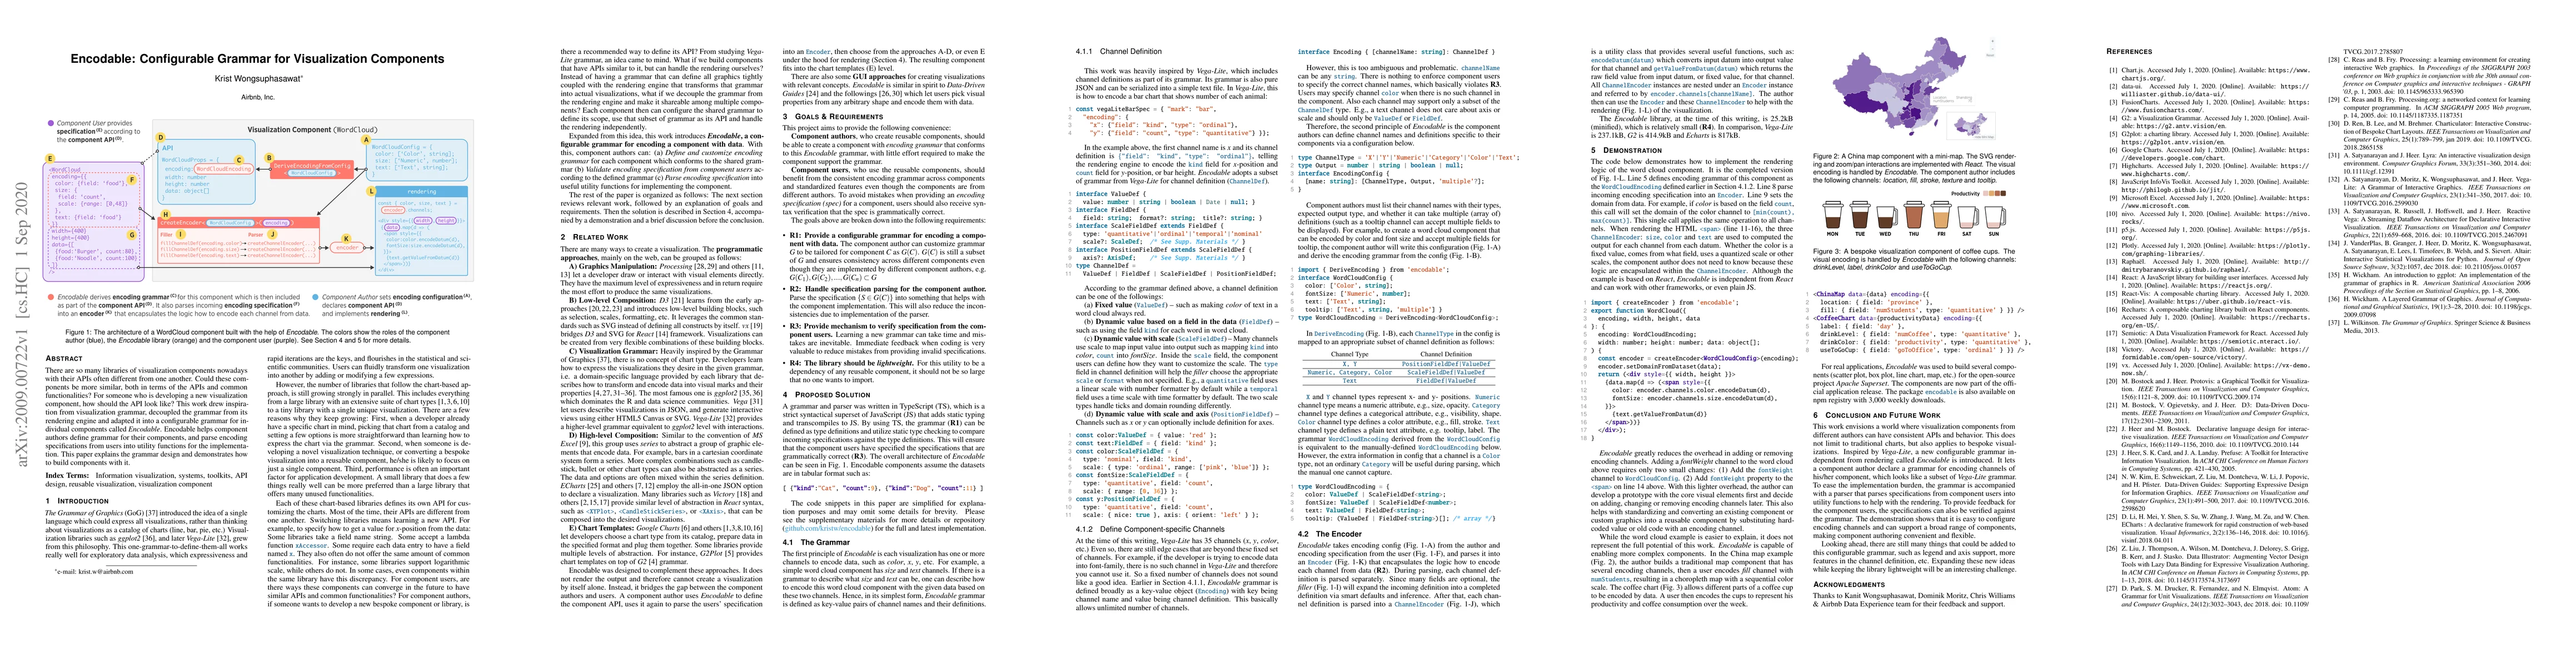
There are so many libraries of visualization components nowadays with their APIs often different from one another. Could these components be more similar, both in terms of the APIs and common functionalities? For someone who is developing a new visualization component, how should the API look like? This work drew inspiration from visualization grammar, decoupled the grammar from its rendering engine and adapted it into a configurable grammar for individual components called Encodable. Encodable helps component authors define grammar for their components, and parse encoding specifications from users into utility functions for the implementation. This paper explains the grammar design and demonstrates how to build components with it.
Get AI-generated insights about this paper's methodology, results, and significance.
Current paper (gray), citations (green), references (blue)
Remco Chang, Ashley Suh, Eugene Wu et al.
Shunan Guo, Ryan Rossi, Jessica Hullman et al.
Benjamin Bach, James Scott-Brown
Leilani Battle, Shayan Monadjemi, Alvitta Ottley et al.
Title | Authors | Year | Actions |
---|---|---|---|
Towards Reusable and Reactive Widgets for Information Visualization Research and Dissemination
|
John Alexis Guerra-Gomez
|
2024
|
View Paper |
D-Tour: Semi-Automatic Generation of Interactive Guided Tours for Visualization Dashboard Onboarding
|
Vaishali Dhanoa, A. Hinterreiter, Vanessa Fediuk, Niklas Elmqvist, Eduard Gröller, Marc Streit
|
2024
|
View Paper |
Bringing Data into the Conversation: Adapting Content from Business Intelligence Dashboards for Threaded Collaboration Platforms
|
Hyeok Kim, Arjun Srinivasan, Matthew Brehmer
|
2024
|
View Paper |
Fostering Enterprise Conversations Around Data on Collaboration Platforms
|
Hyeok Kim, Arjun Srinivasan, Matthew Brehmer
|
2023
|
View Paper |
VisAhoi: Towards a Library to Generate and Integrate Visualization Onboarding Using High-level Visualization Grammars
|
Christina Stoiber, Daniela Moitzi, Holger Stitz, Florian Grassinger, Anto Silviya Geo Prakash, Dominic Girardi, M. Streit, W. Aigner
|
2023
|
View Paper |
Metrics-Based Evaluation and Comparison of Visualization Notations
|
Nicolas Kruchten, A. Mcnutt, Michael J. McGuffin
|
2023
|
View Paper |
How Data Analysts Use a Visualization Grammar in Practice
|
Xiaoying Pu, M. Kay
|
2023
|
View Paper |
ParaDime: A Framework for Parametric Dimensionality Reduction
|
A. Hinterreiter, Christina Humer, Bernhard Kainz, M. Streit
|
2022
|
View Paper |
Lotse: A Practical Framework for Guidance in Visual Analytics
|
F. Sperrle, D. Ceneda, Mennatallah El-Assady
|
2022
|
View Paper |
No Grammar to Rule Them All: A Survey of JSON-style DSLs for Visualization
|
A. Mcnutt
|
2022
|
View Paper |
A Process Model for Dashboard Onboarding
|
Vaishali Dhanoa, C. Walchshofer, A. Hinterreiter, Holger Stitz, E. Groeller, M. Streit
|
2022
|
View Paper |
A Grammar of Hypotheses for Visualization, Data, and Analysis
|
Ashley Suh, Abigail Mosca, Eugene Wu, Remco Chang
|
2022
|
View Paper |
Gosling: A Grammar-based Toolkit for Scalable and Interactive Genomics Data Visualization
|
S. L’Yi, Qianwen Wang, Fritz Lekschas, Nils Gehlenborg
|
2021
|
View Paper |
Special Interest Group on Visualization Grammars
|
Xiaoying Pu, M. Kay, S. Drucker, Jeffrey Heer, Dominik Moritz, Arvind Satyanarayan
|
2021
|
View Paper |
Integrated Visualization Editing via Parameterized Declarative Templates
|
A. Mcnutt, Ravi Chugh
|
2021
|
View Paper |
Bluefish: A Relational Framework for Graphic Representations
|
Josh Pollock, Catherine Mei, Daniel Jackson, Arvind Satyanarayan
|
View Paper |
Comments (0)