Academic Profile
Statistics
Similar Authors
Papers on arXiv
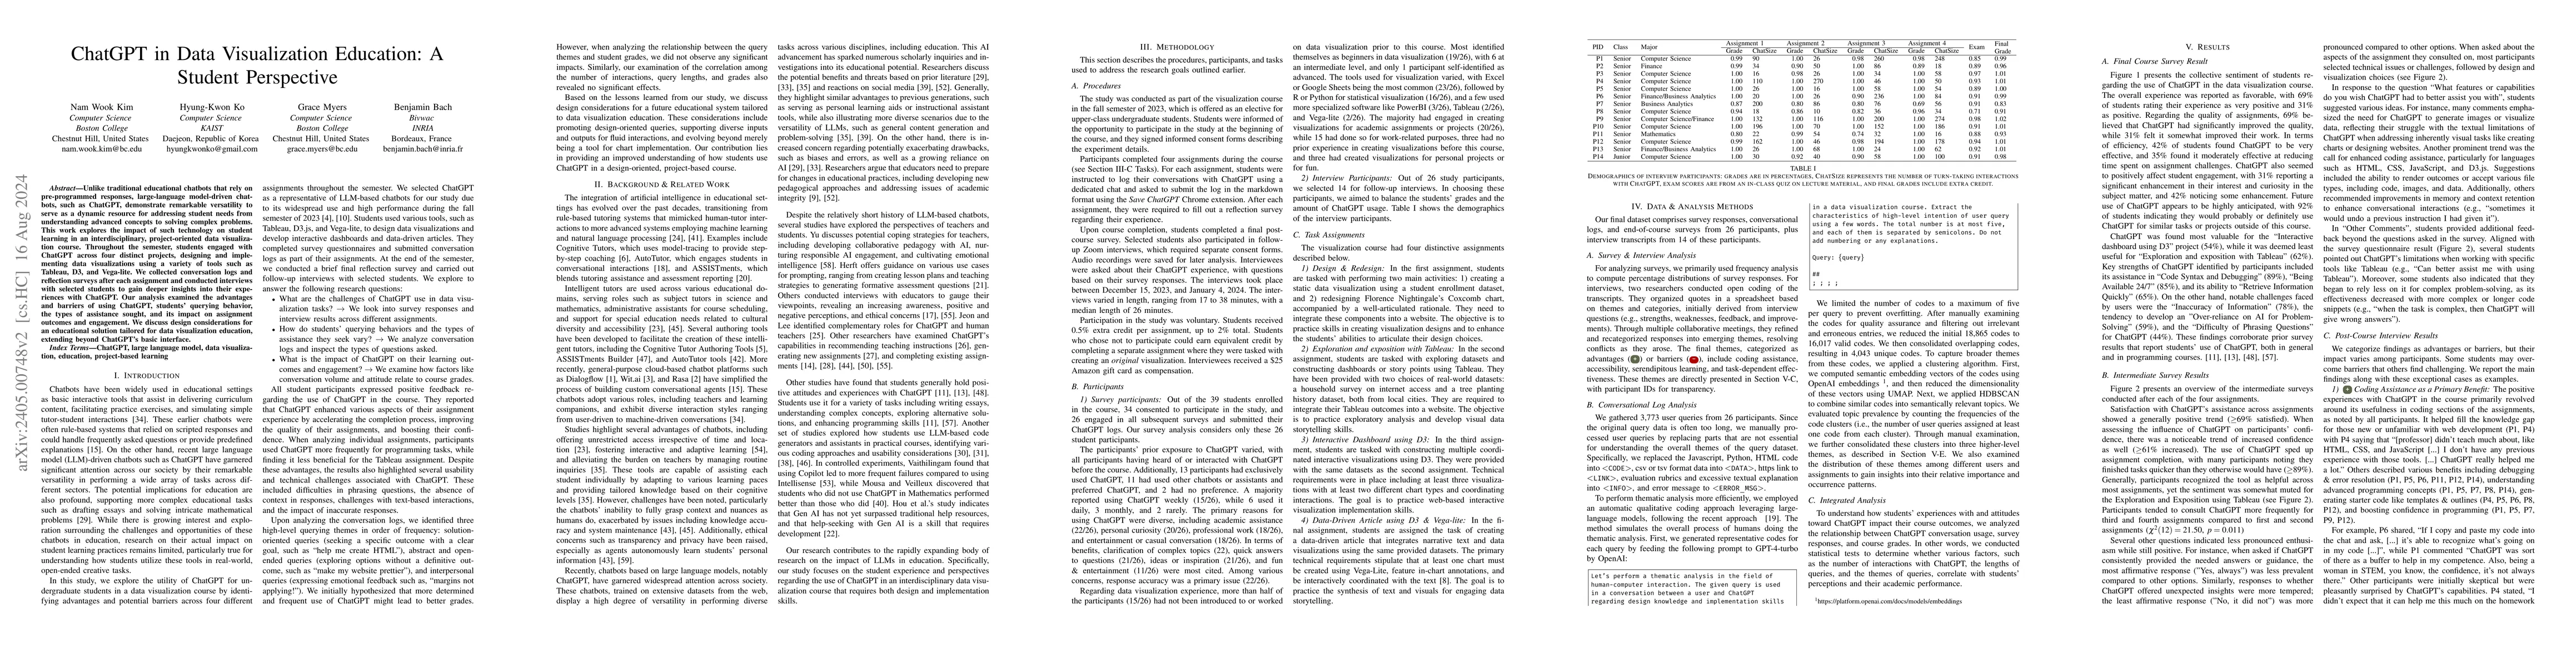
Unlike traditional educational chatbots that rely on pre-programmed responses, large-language model-driven chatbots, such as ChatGPT, demonstrate remarkable versatility and have the potential to ser...

This first workshop on visualization for climate action and sustainability aims to explore and consolidate the role of data visualization in accelerating action towards addressing the current enviro...
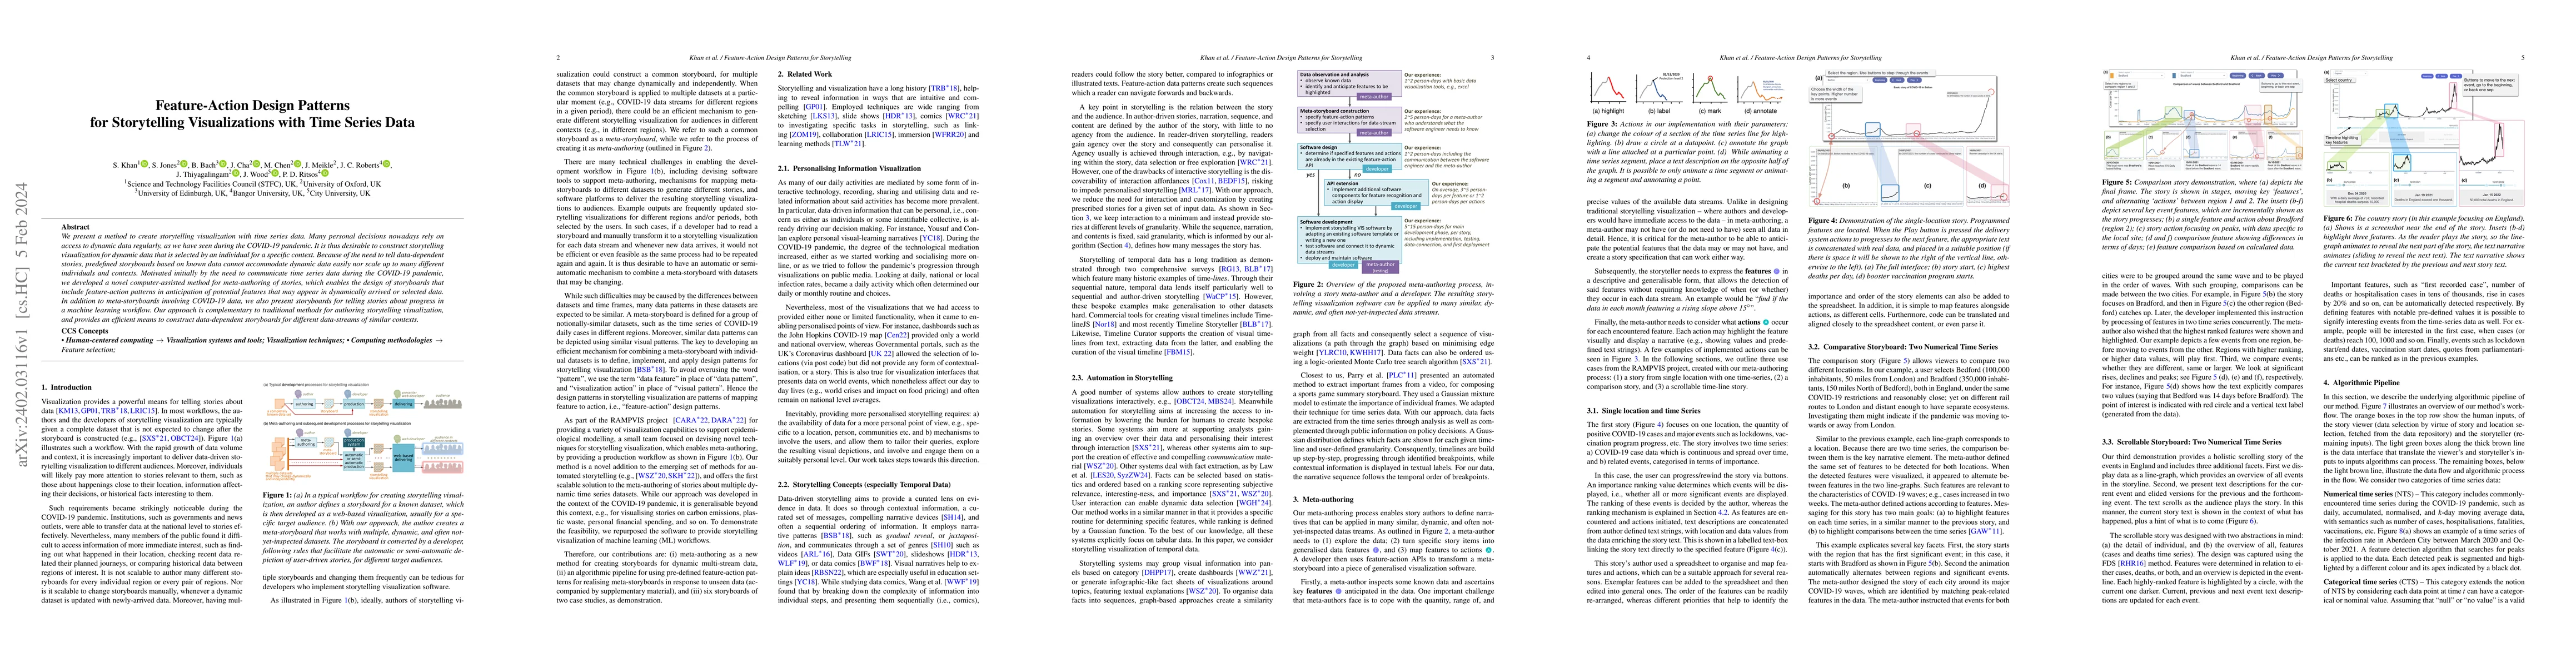
We present a method to create storytelling visualization with time series data. Many personal decisions nowadays rely on access to dynamic data regularly, as we have seen during the COVID-19 pandemi...
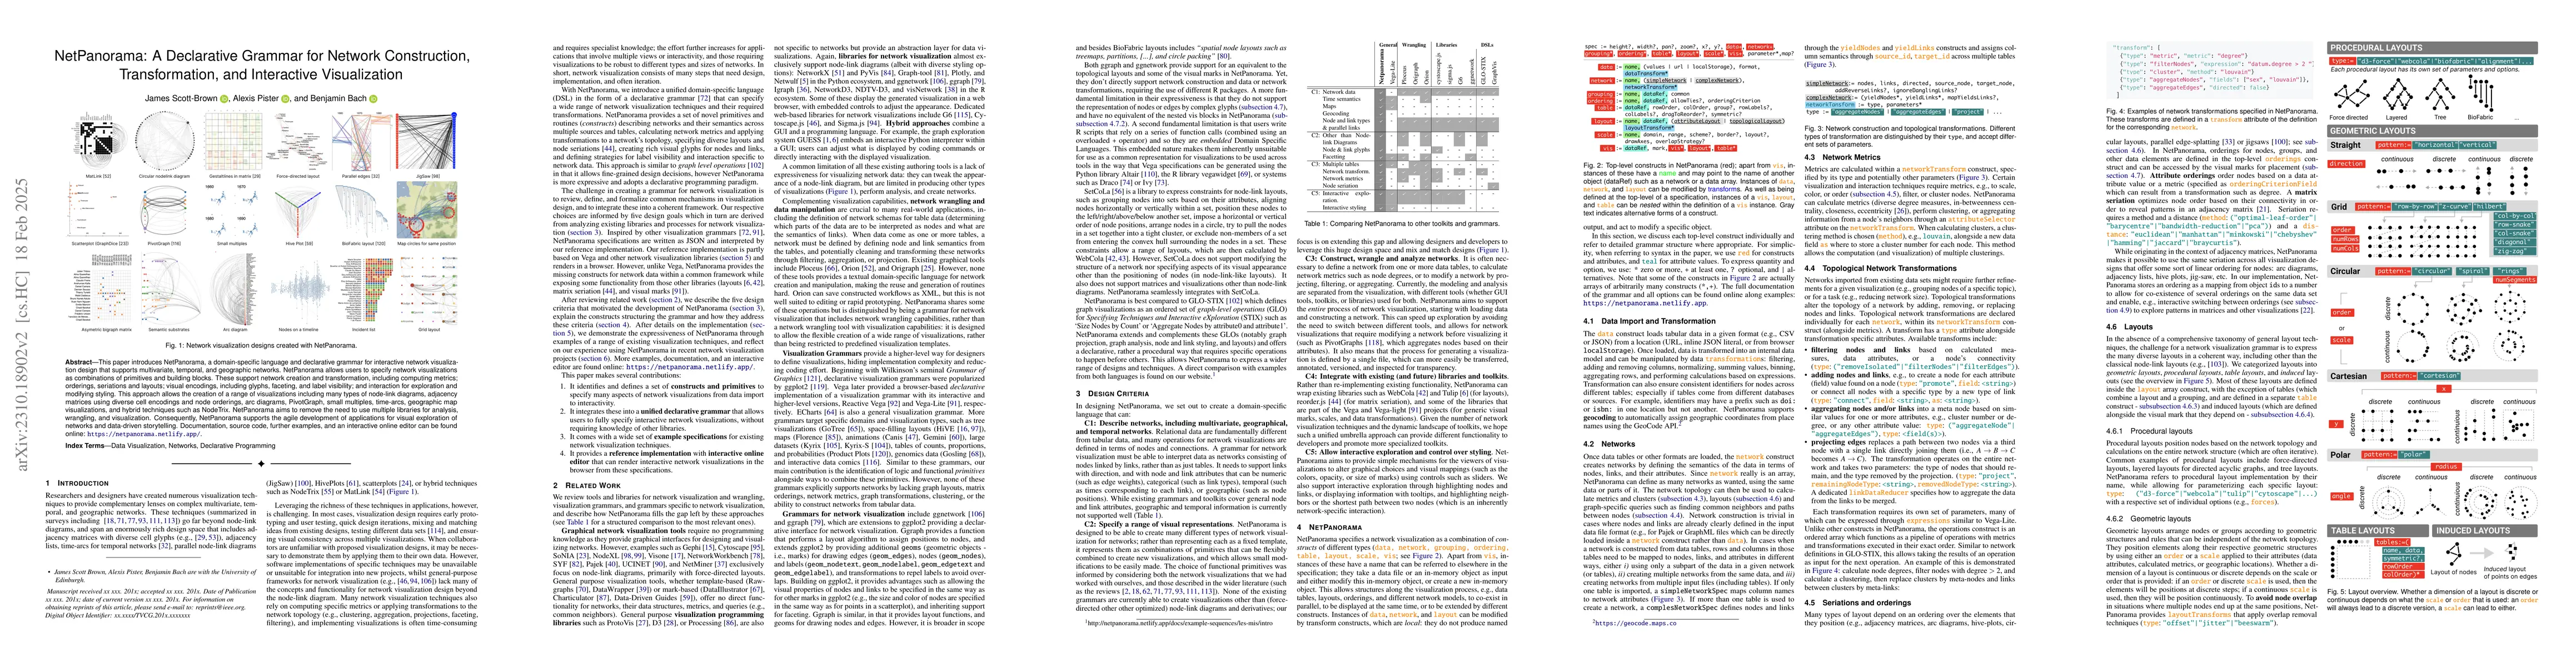
This paper introduces NetPanorama, a domain-specific language and declarative grammar for interactive network visualizations. Exploring complex networks with multivariate, geographical, or temporal ...
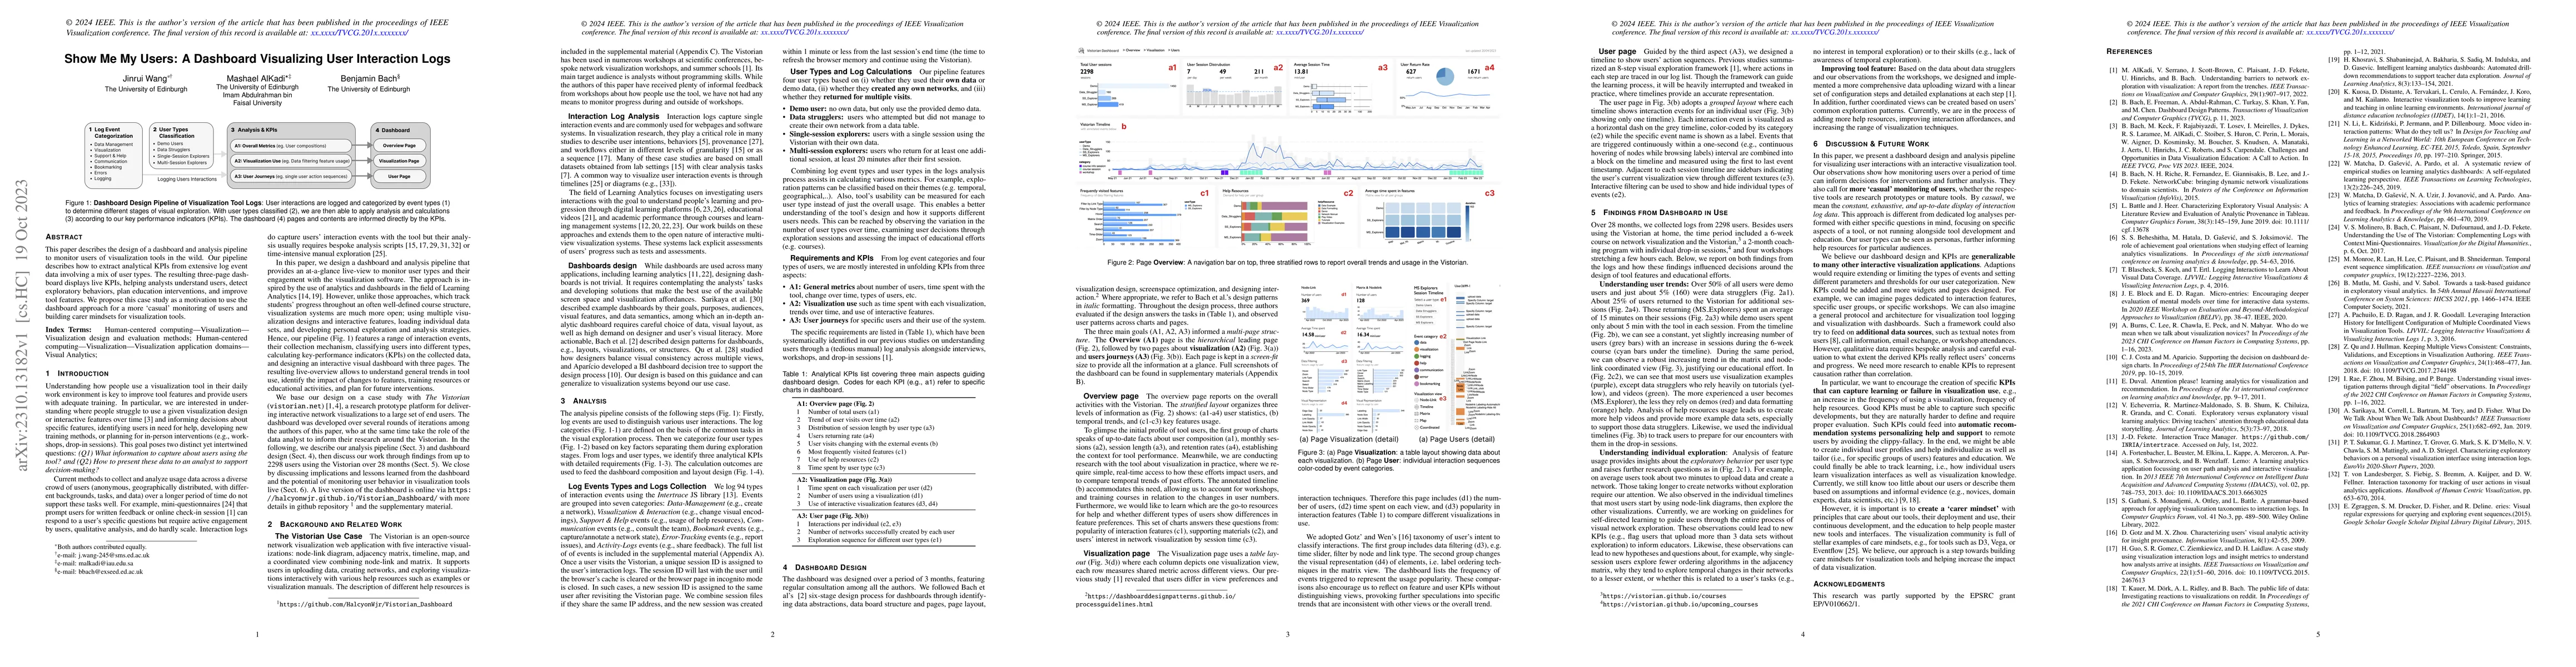
This paper describes the design of a dashboard and analysis pipeline to monitor users of visualization tools in the wild. Our pipeline describes how to extract analytical KPIs from extensive log eve...
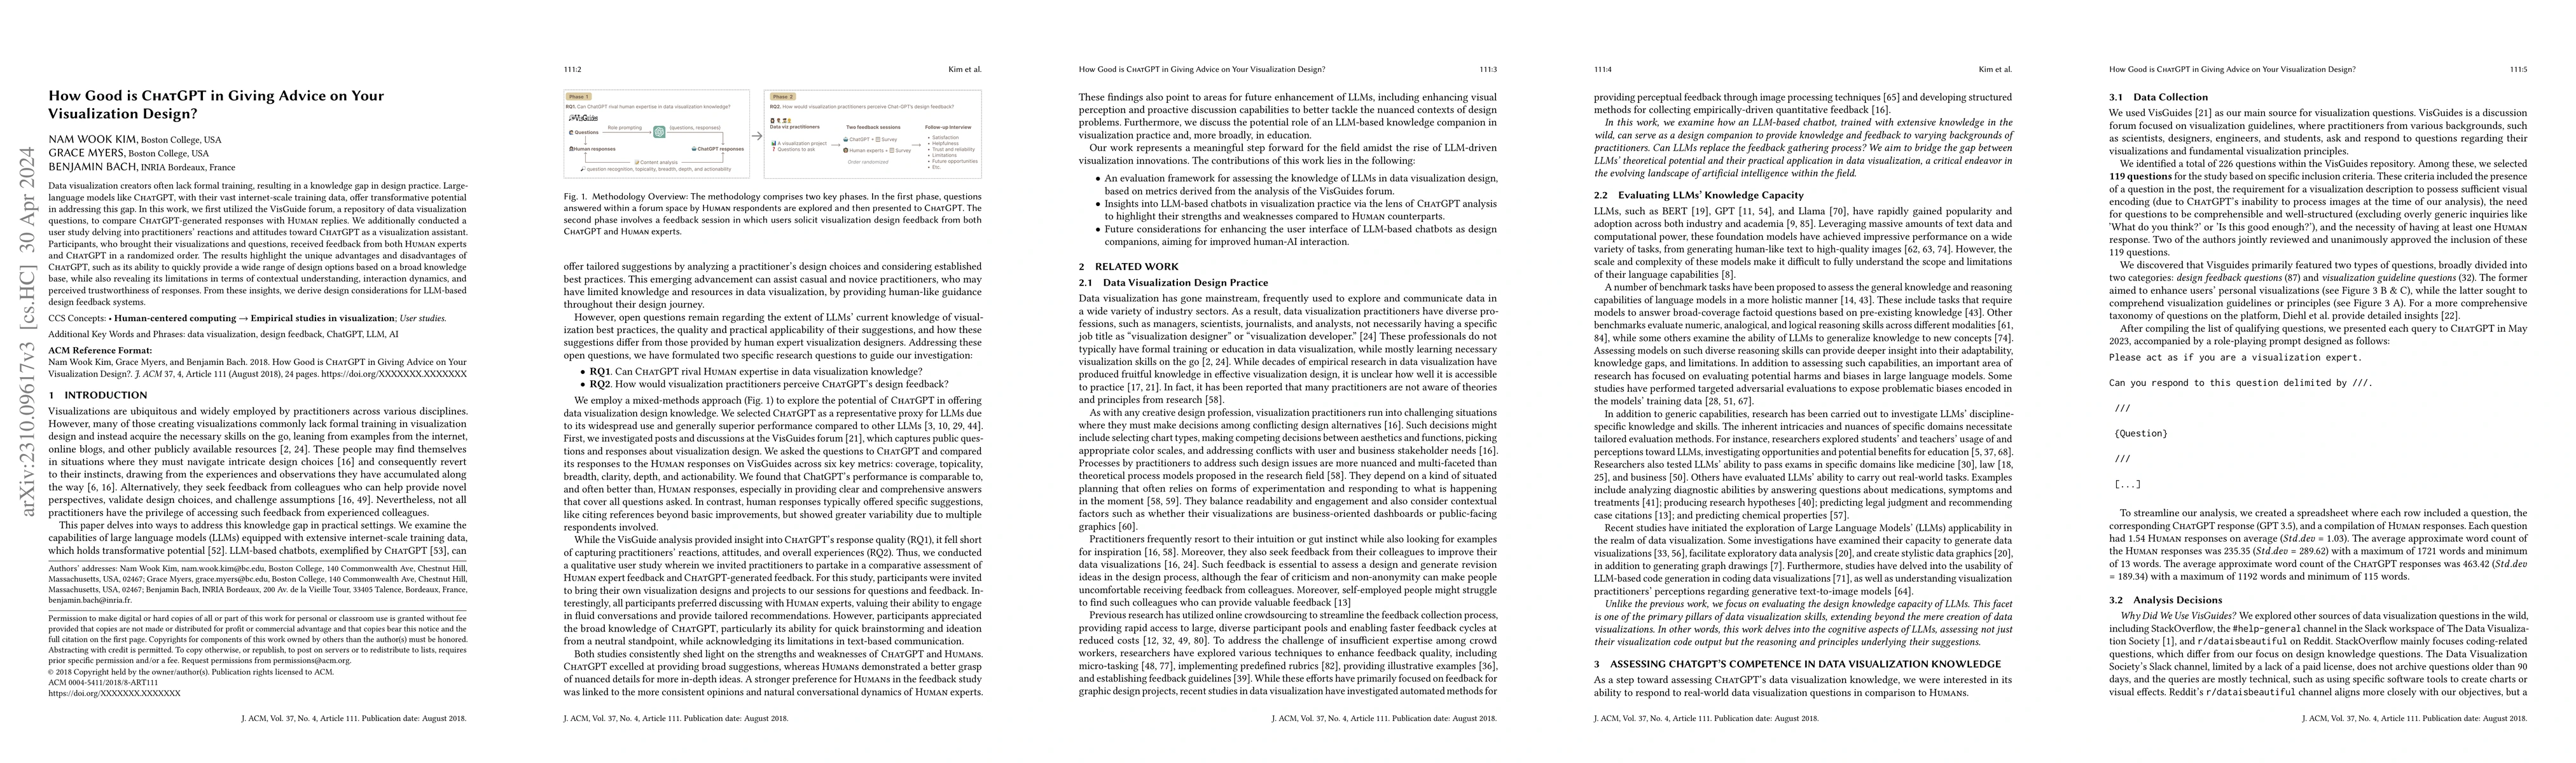
Data visualization practitioners often lack formal training, resulting in a knowledge gap in visualization design best practices. Large-language models like ChatGPT, with their vast internet-scale t...
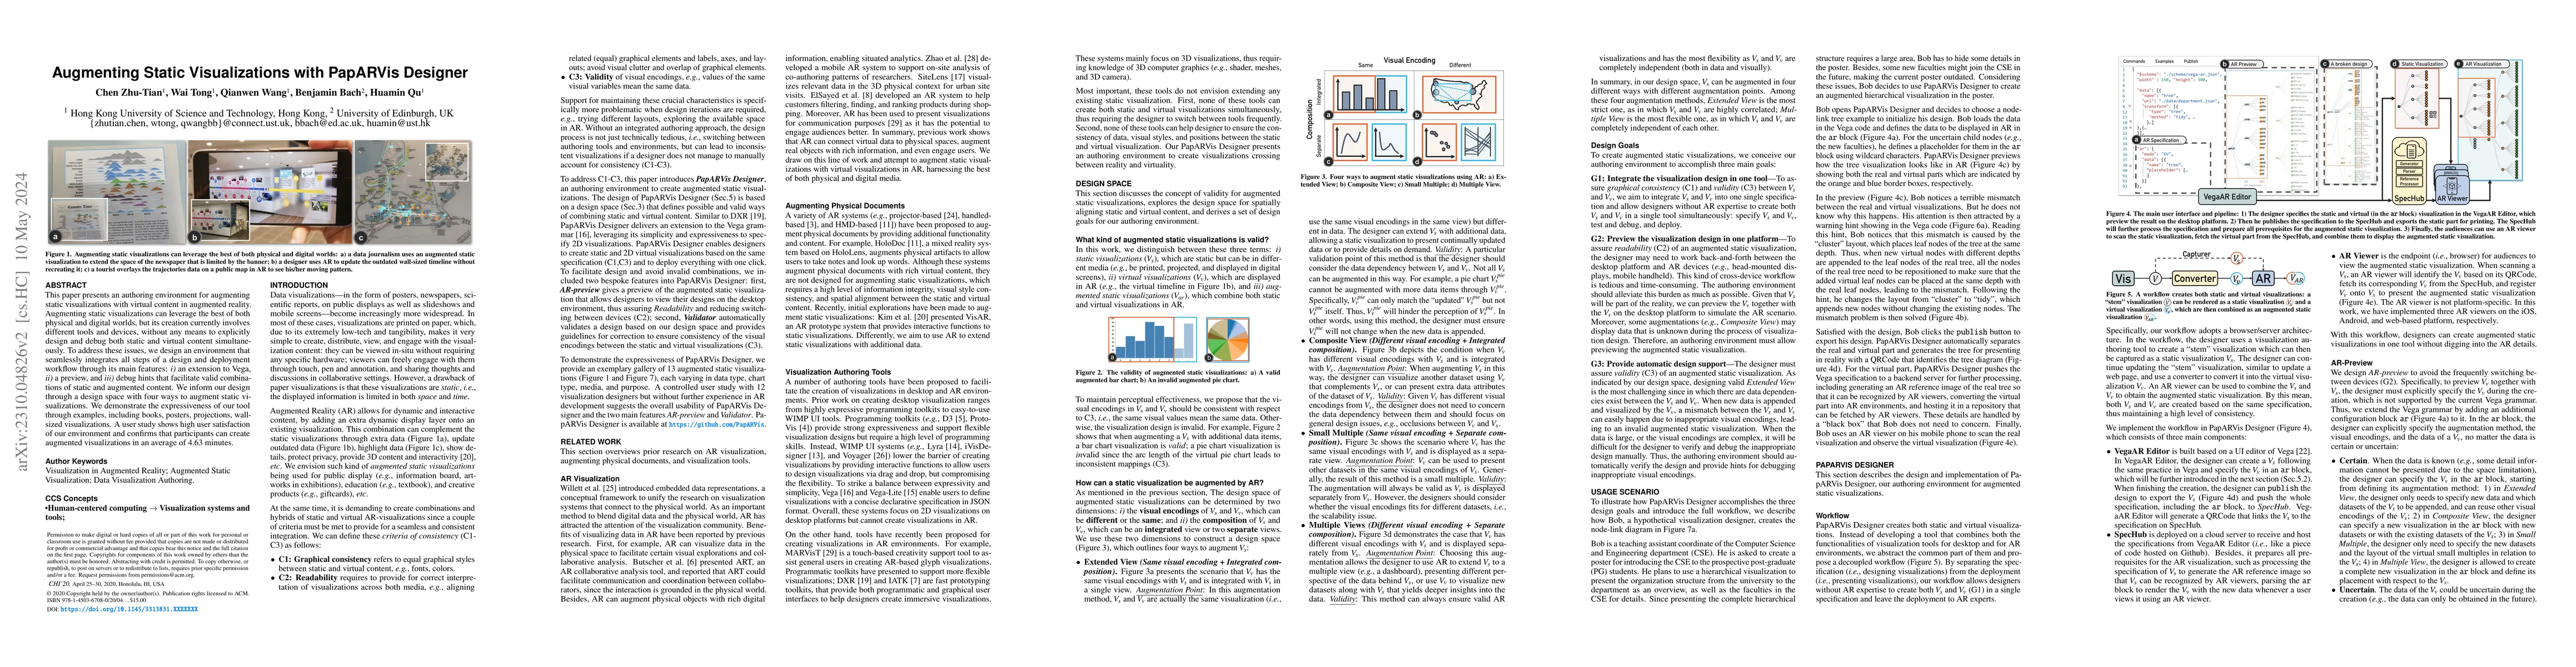
This paper presents an authoring environment for augmenting static visualizations with virtual content in augmented reality. Augmenting static visualizations can leverage the best of both physical a...
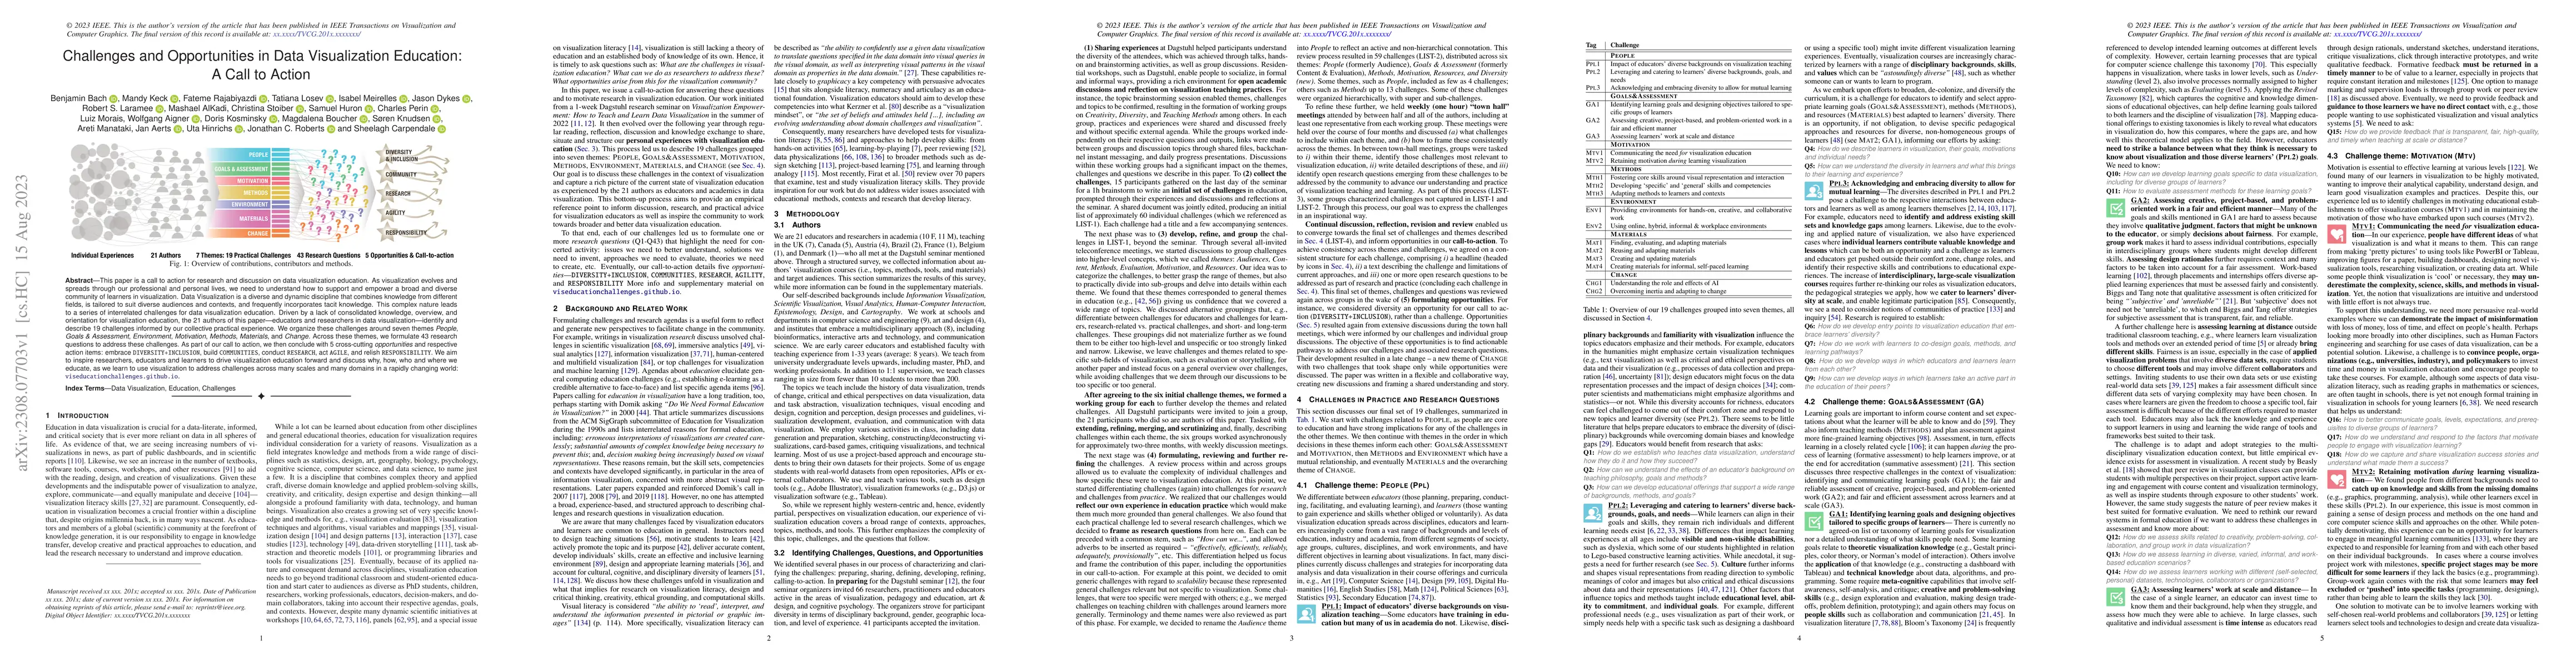
This paper is a call to action for research and discussion on data visualization education. As visualization evolves and spreads through our professional and personal lives, we need to understand ho...
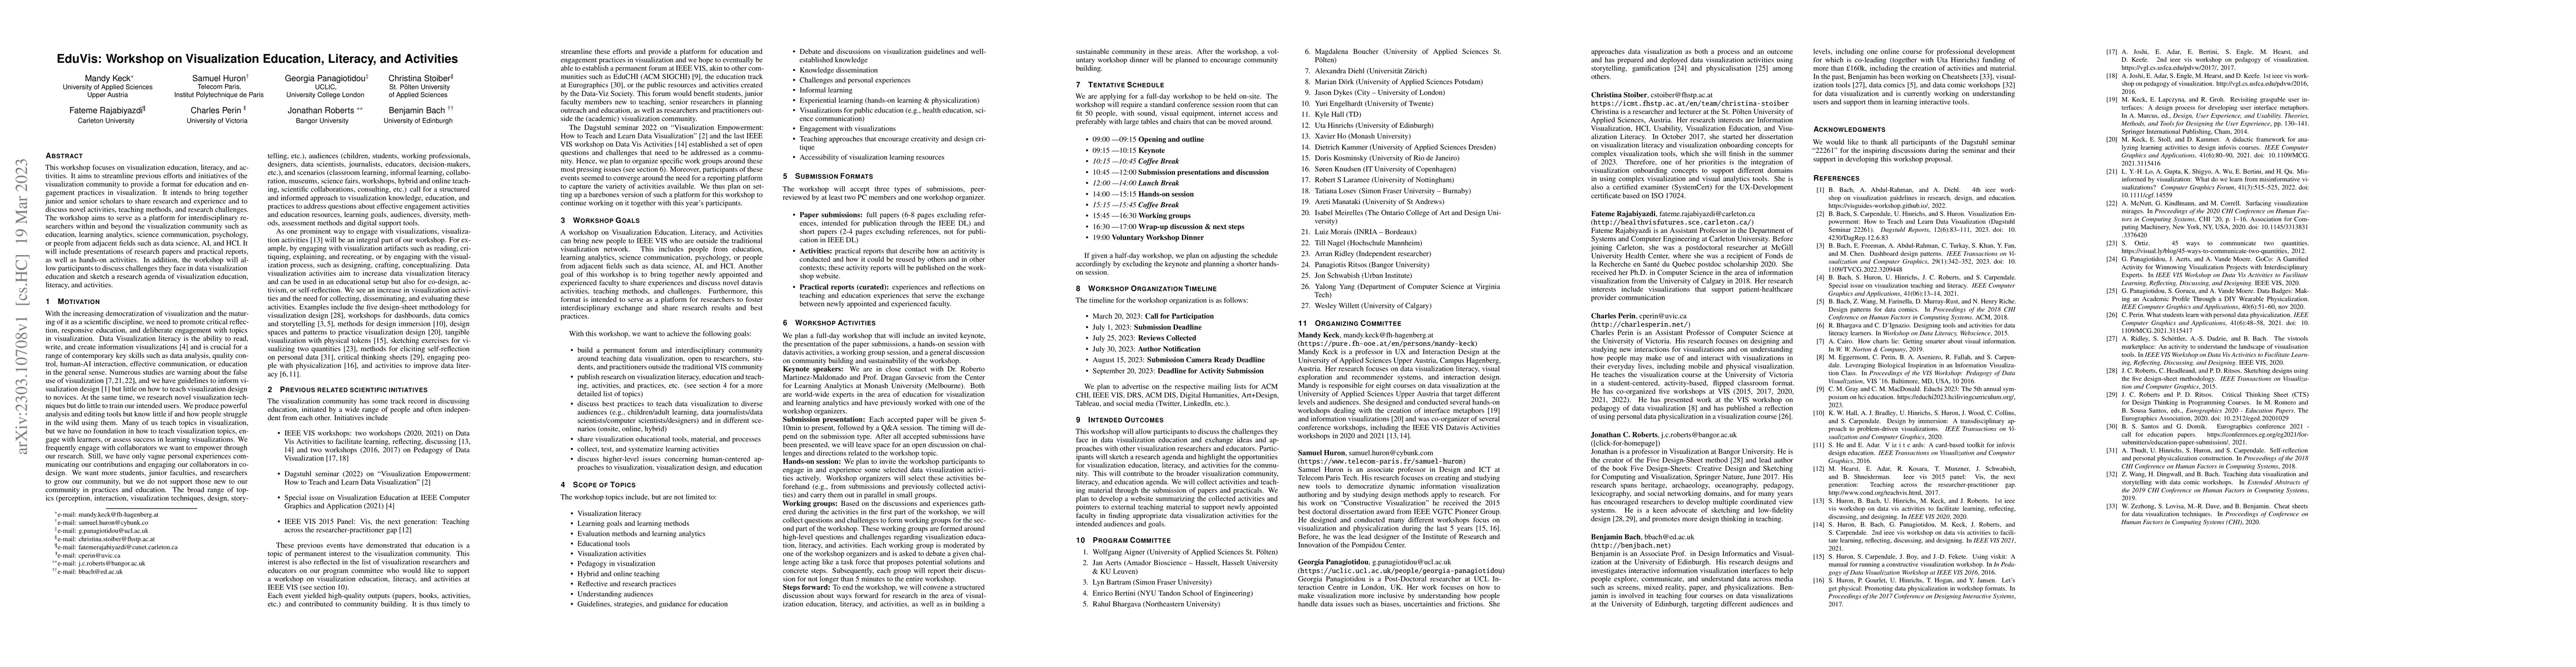
This workshop focuses on visualization education, literacy, and activities. It aims to streamline previous efforts and initiatives of the visualization community to provide a format for education an...
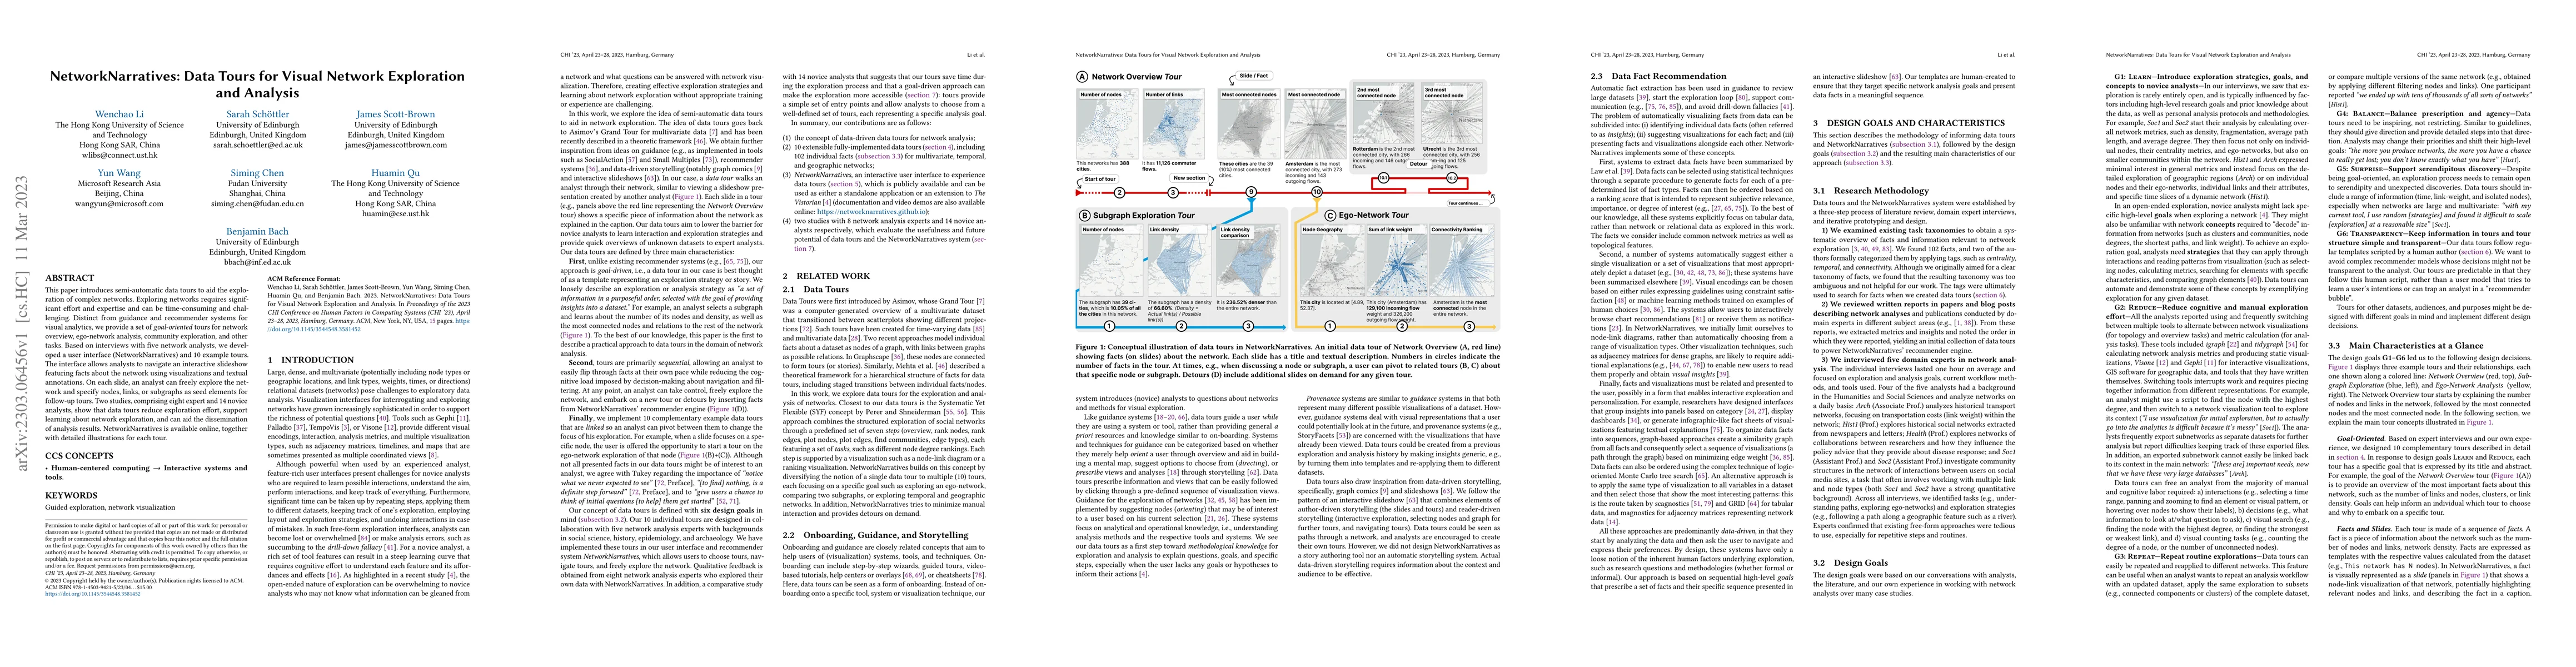
This paper introduces semi-automatic data tours to aid the exploration of complex networks. Exploring networks requires significant effort and expertise and can be time-consuming and challenging. Di...
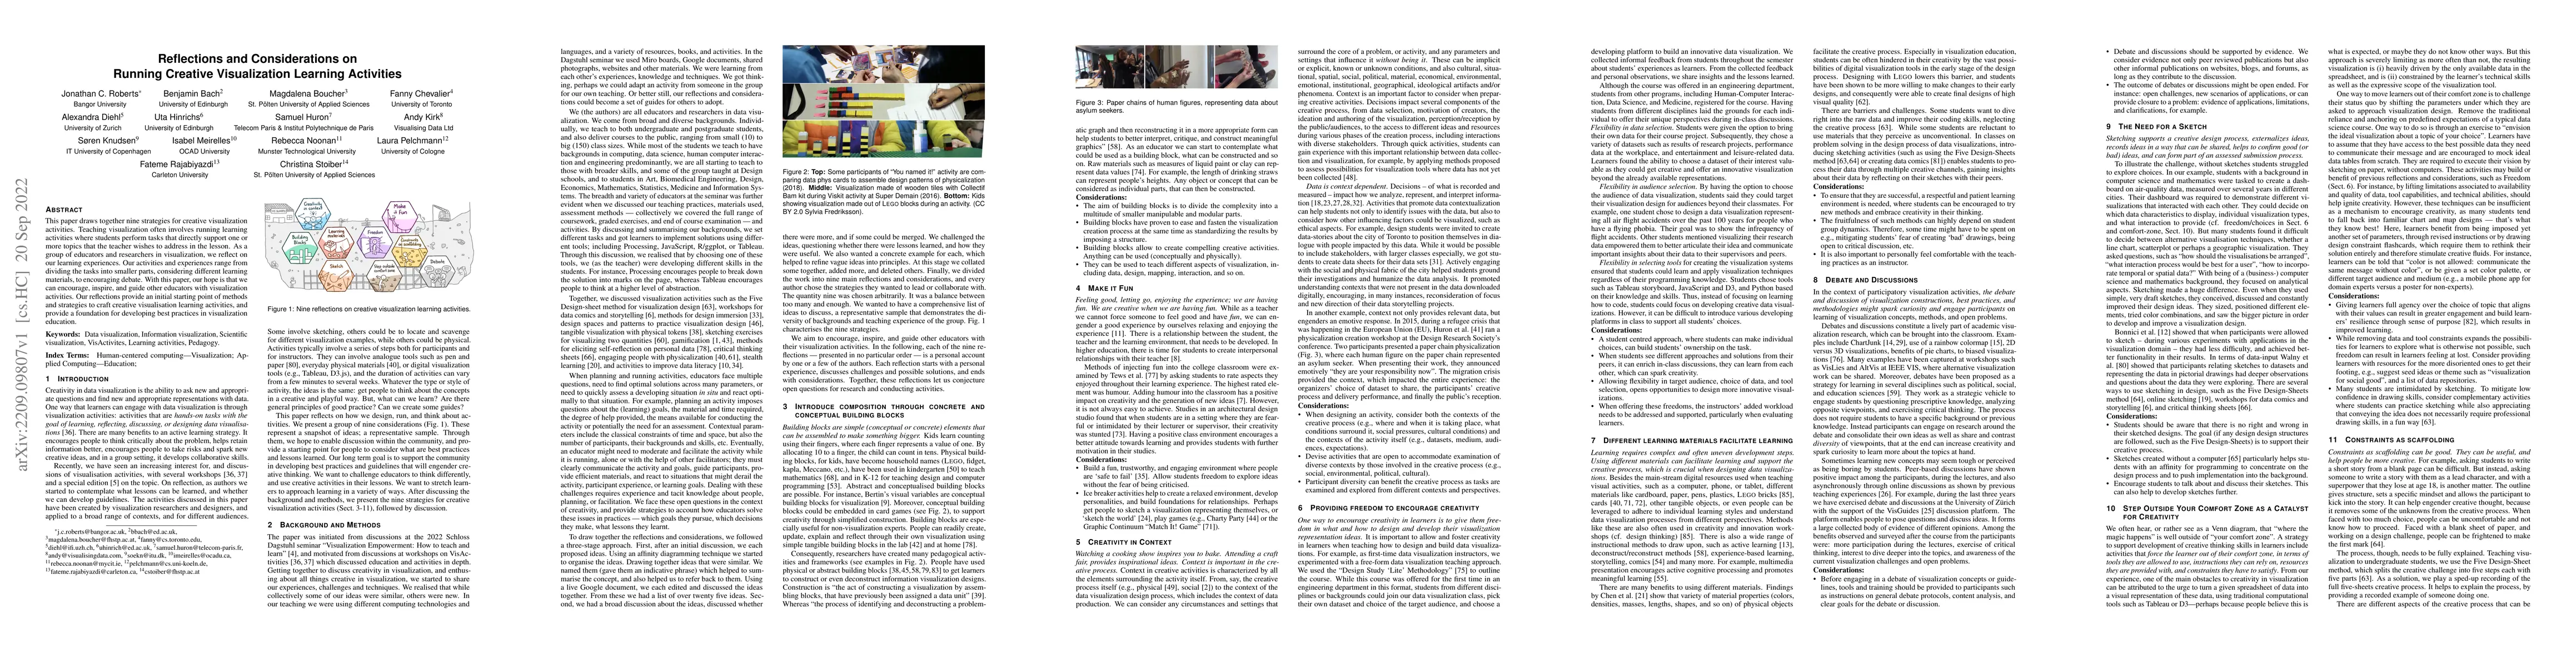
This paper draws together nine strategies for creative visualization activities. Teaching visualization often involves running learning activities where students perform tasks that directly support ...
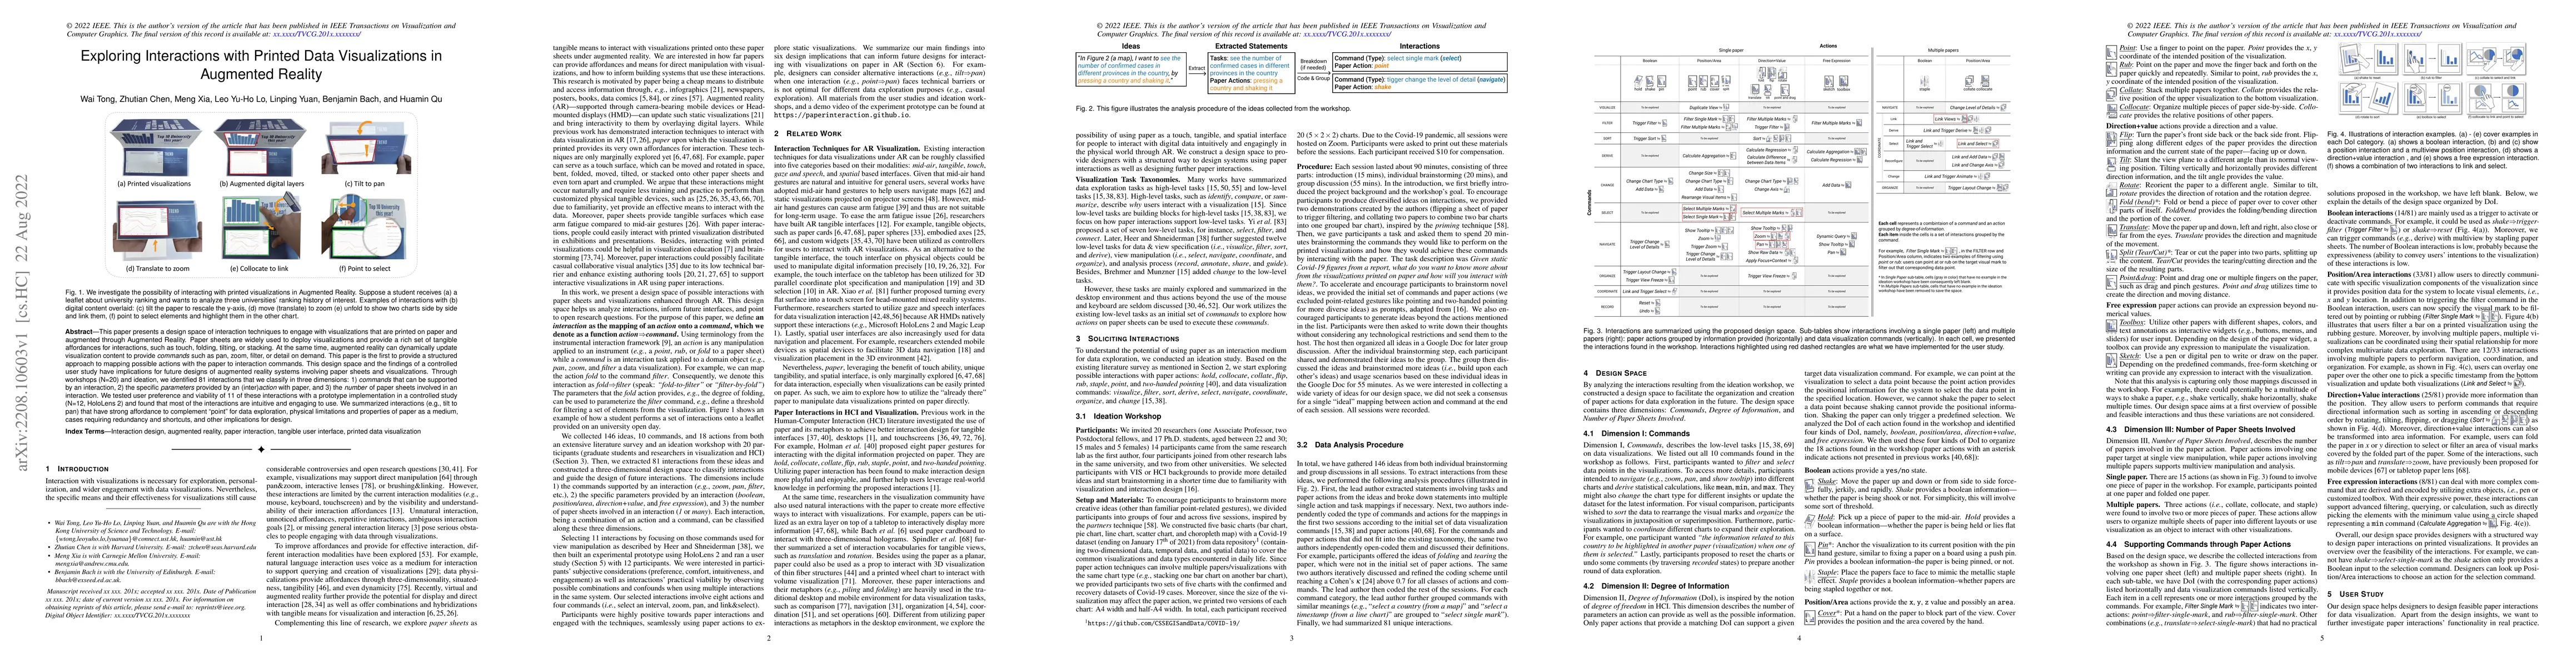
This paper presents a design space of interaction techniques to engage with visualizations that are printed on paper and augmented through Augmented Reality. Paper sheets are widely used to deploy v...
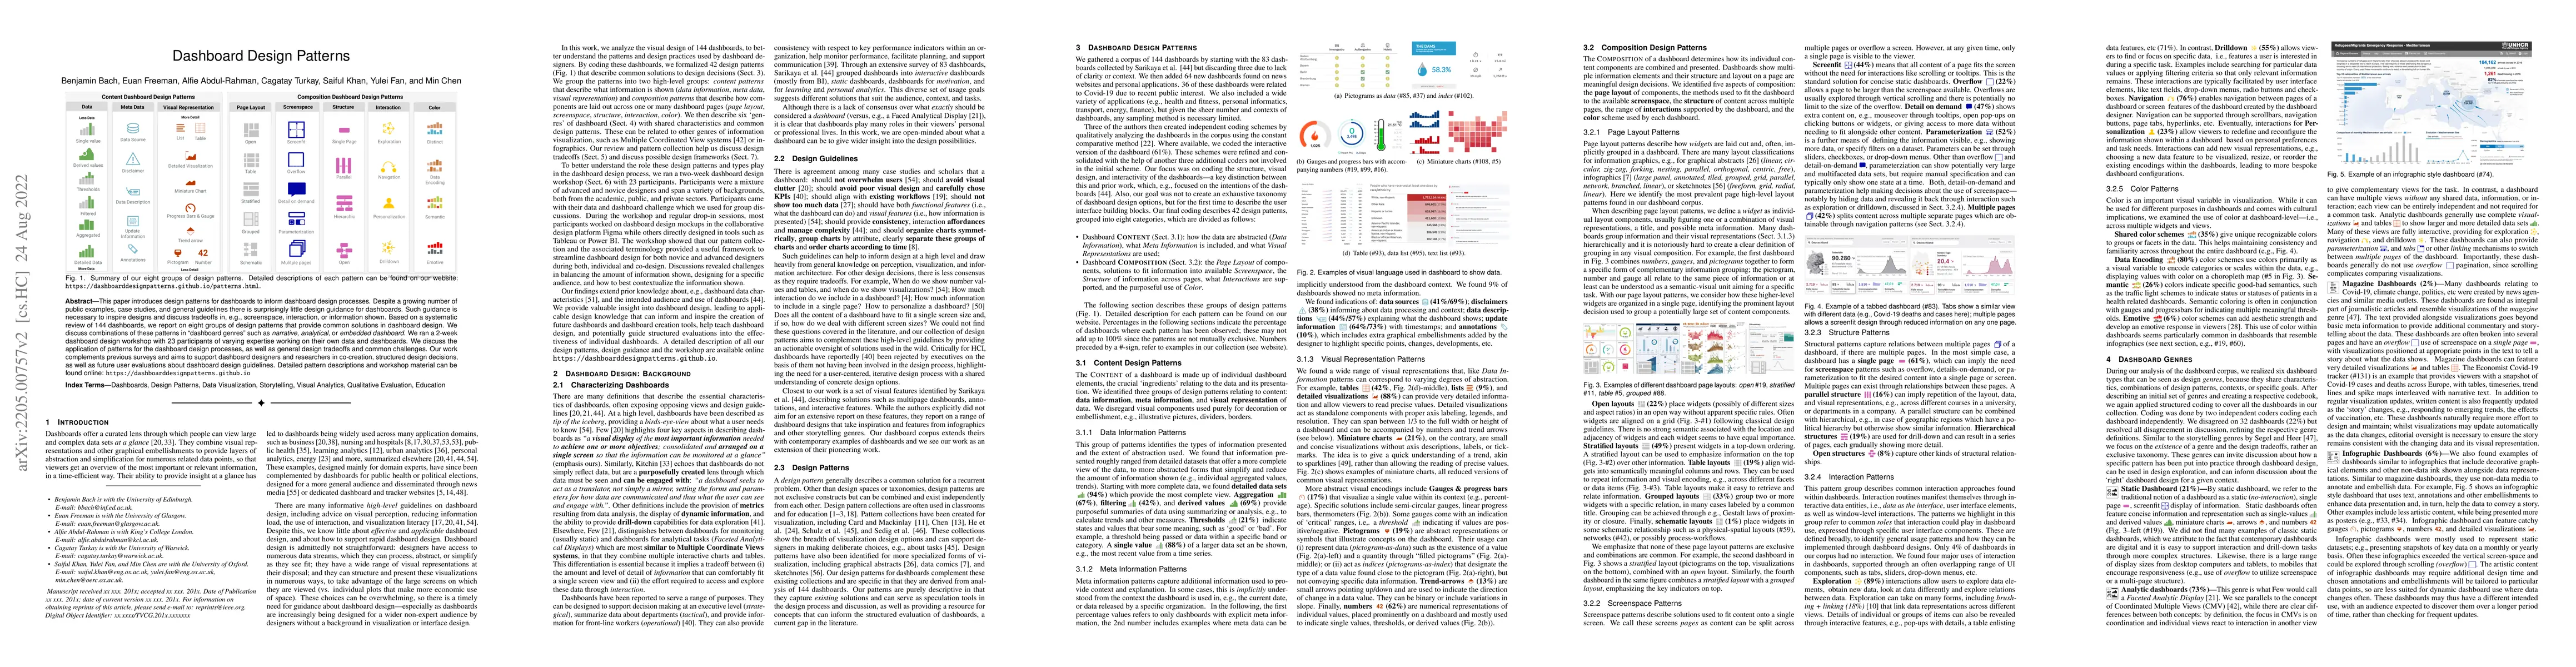
This paper introduces design patterns for dashboards to inform dashboard design processes. Despite a growing number of public examples, case studies, and general guidelines there is surprisingly lit...
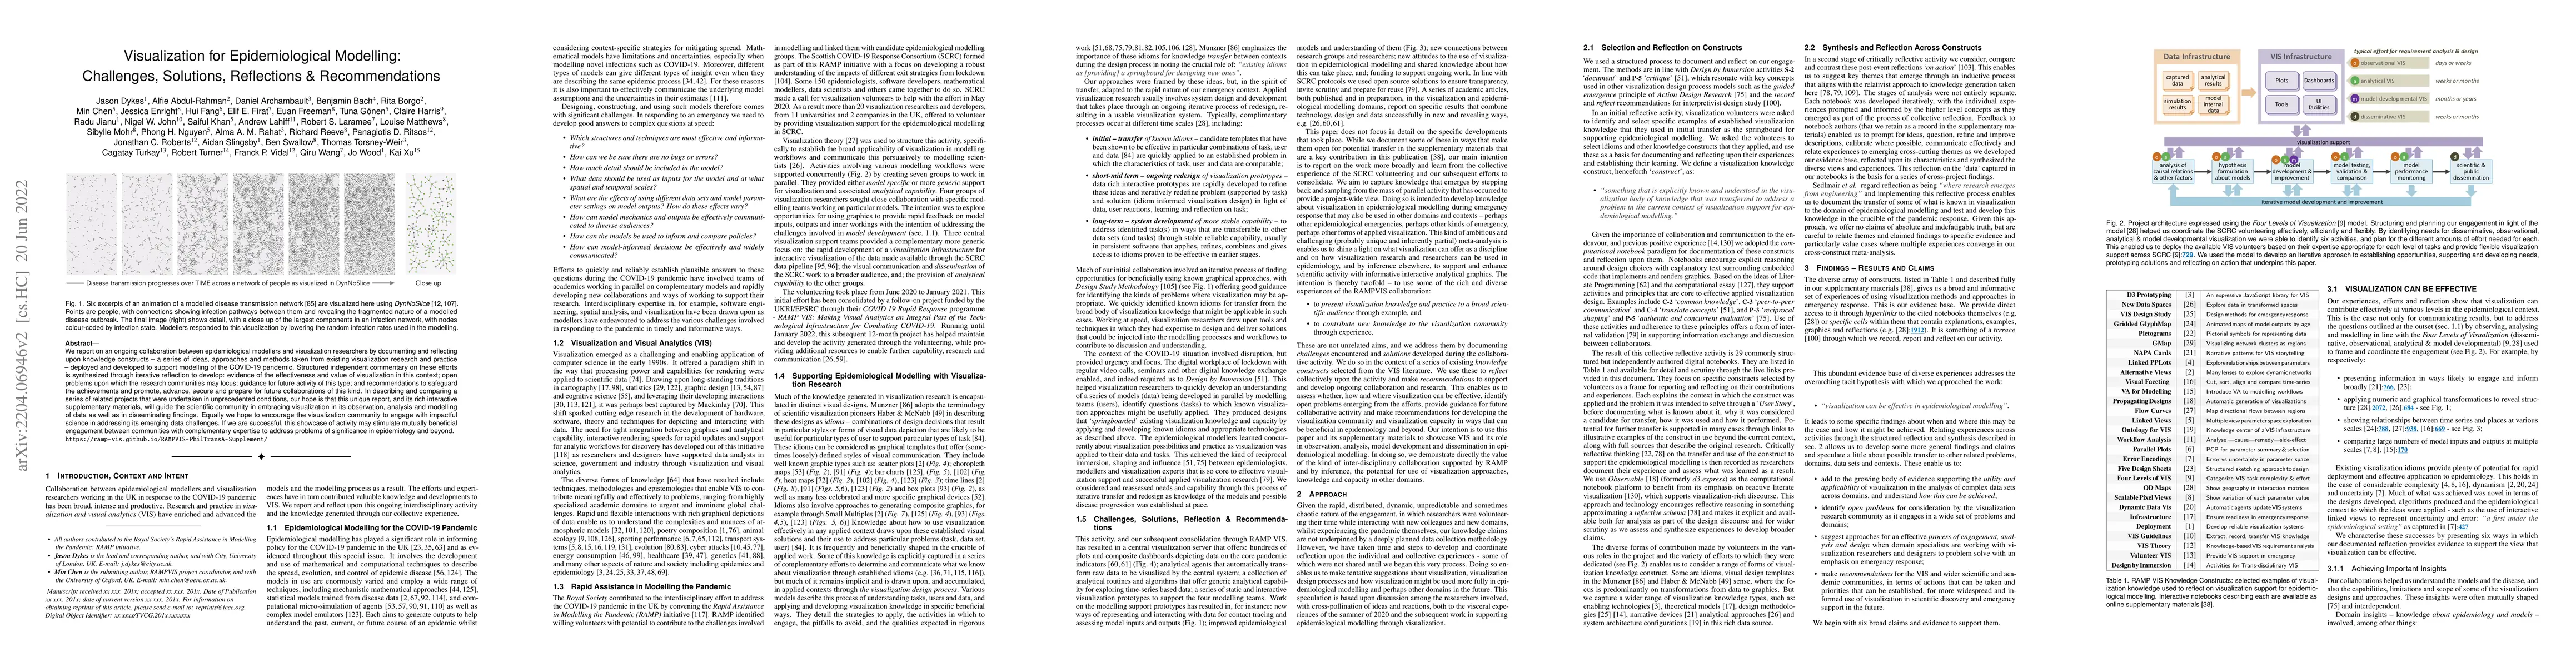
We report on an ongoing collaboration between epidemiological modellers and visualization researchers by documenting and reflecting upon knowledge constructs -- a series of ideas, approaches and met...
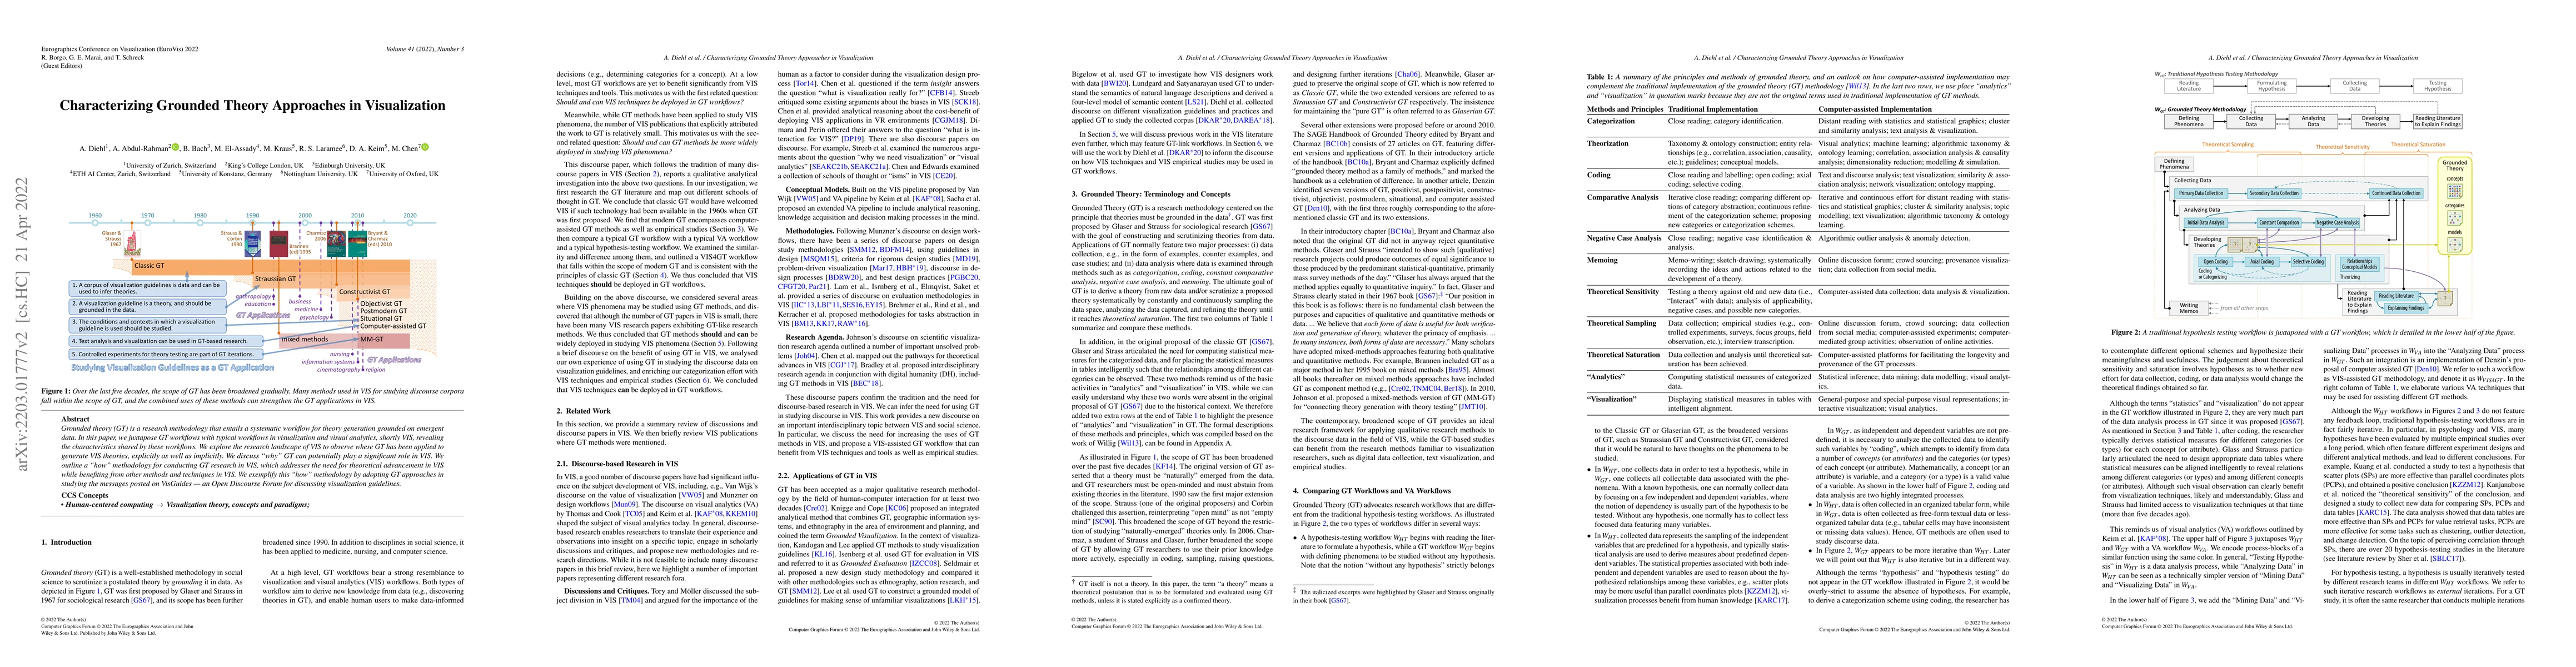
Grounded theory (GT) is a research methodology that entails a systematic workflow for theory generation grounded on emergent data. In this paper, we juxtapose GT workflows with typical workflows in ...
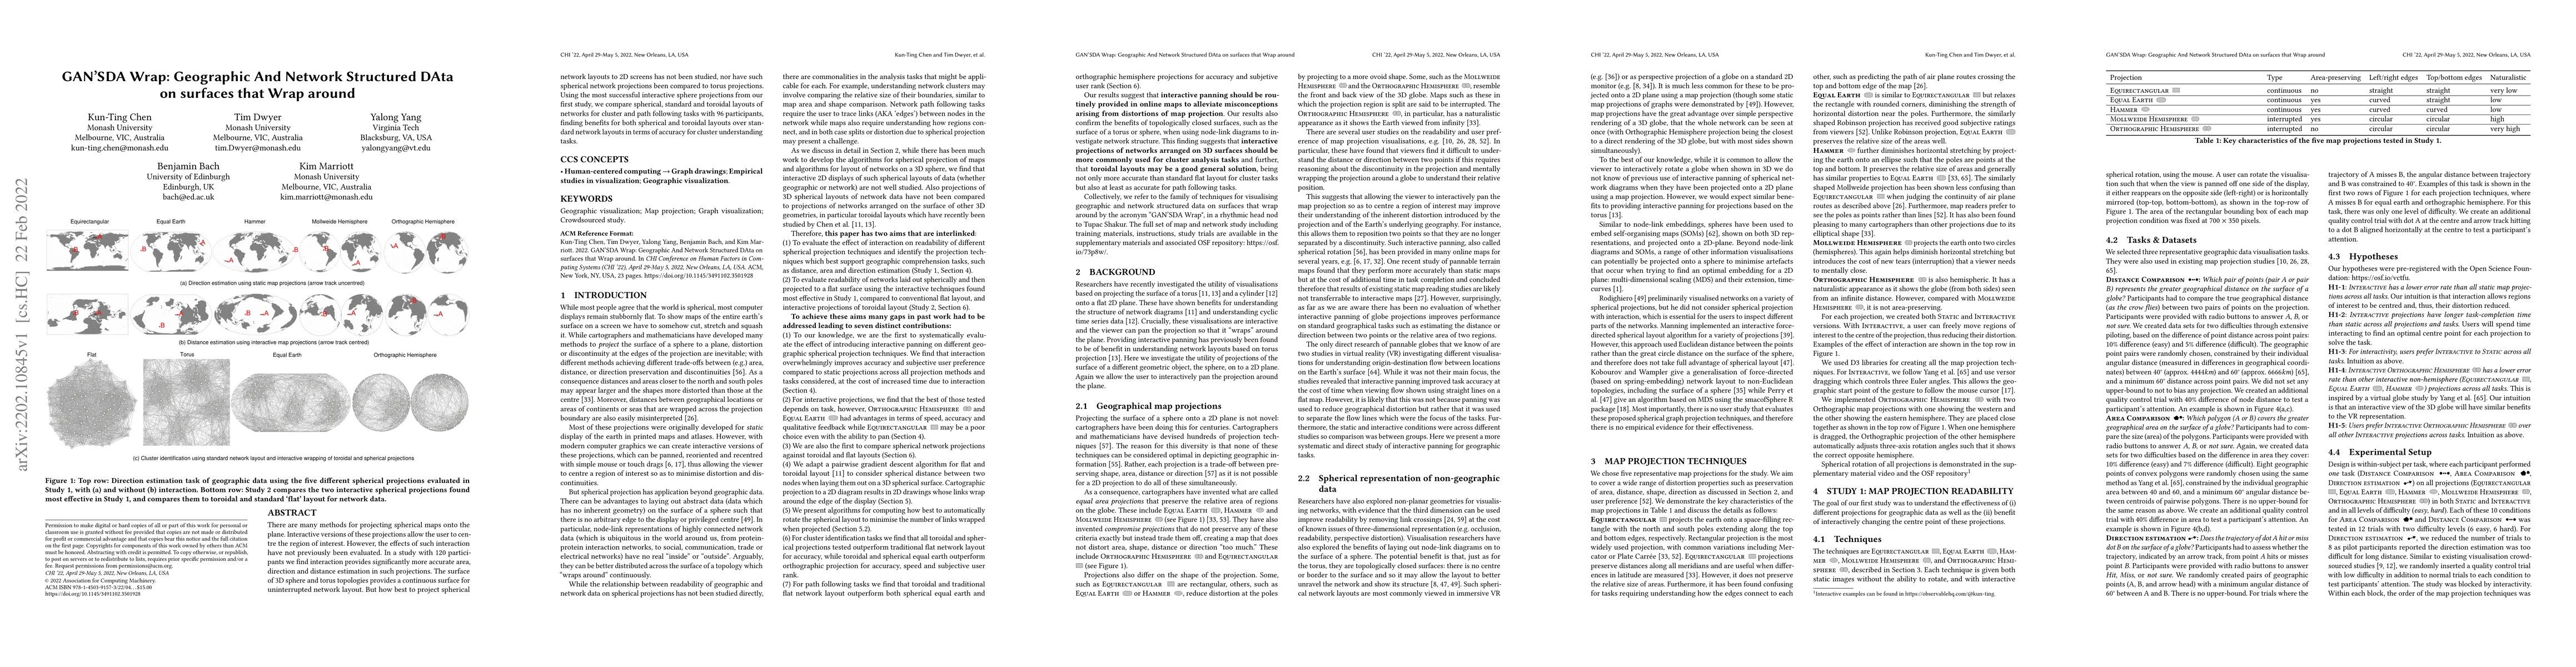
There are many methods for projecting spherical maps onto the plane. Interactive versions of these projections allow the user to centre the region of interest. However, the effects of such interacti...
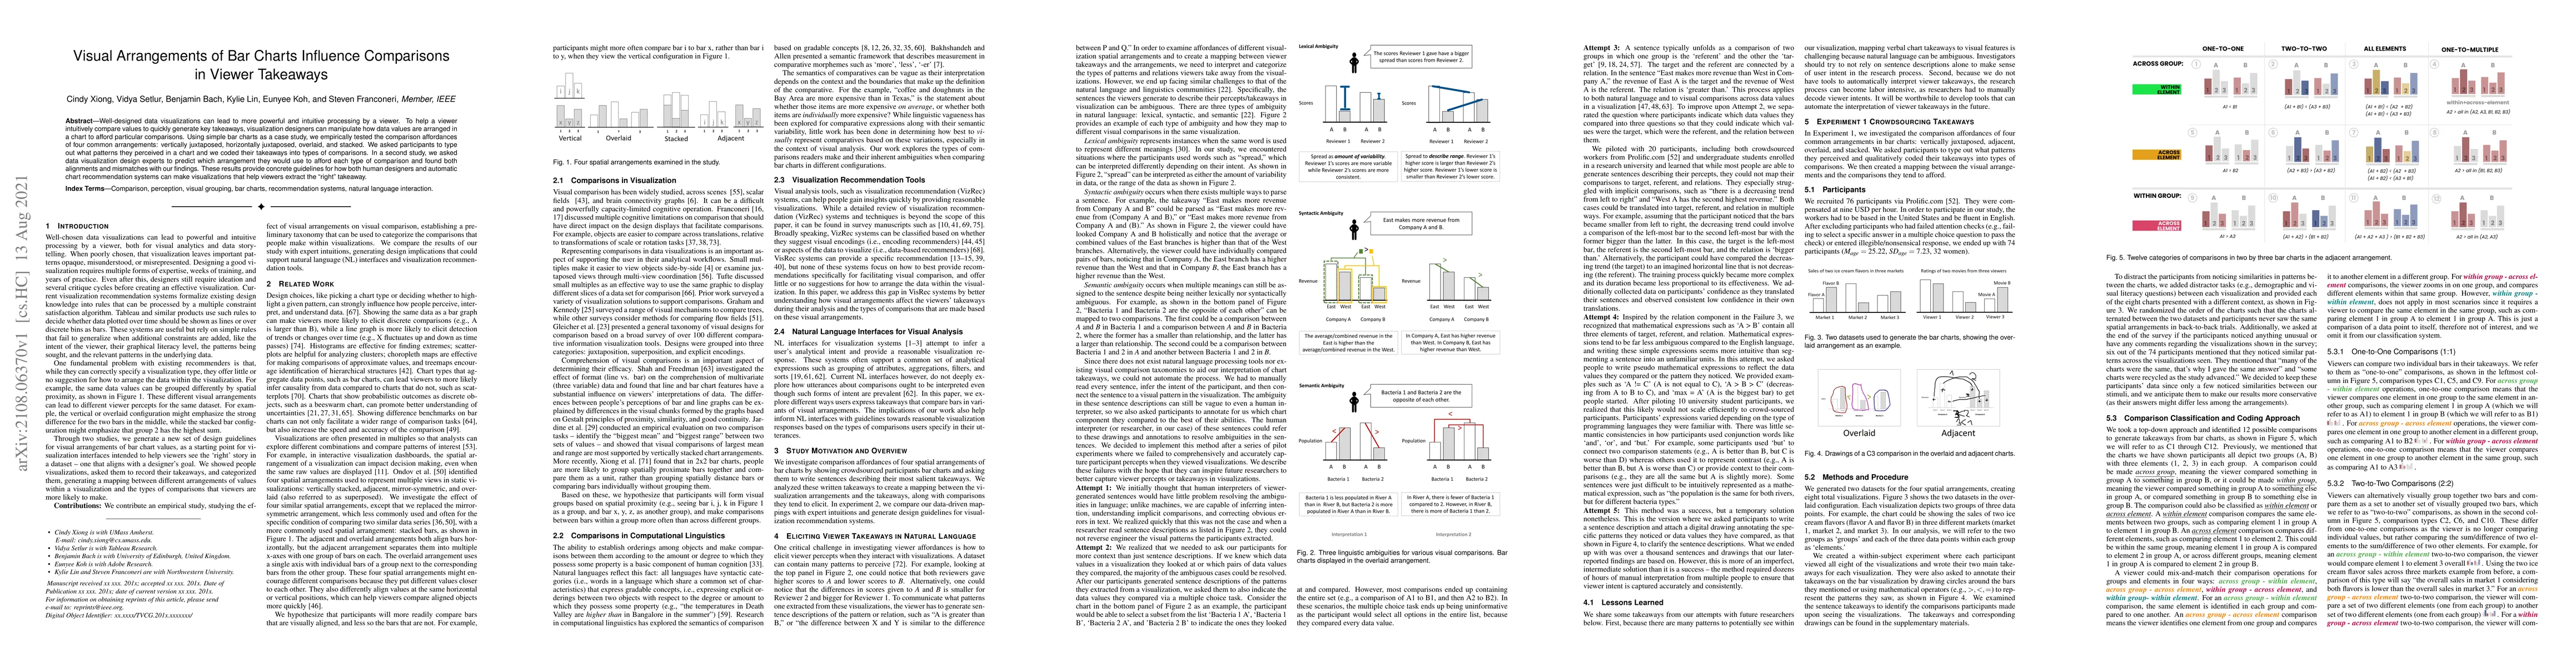
Well-designed data visualizations can lead to more powerful and intuitive processing by a viewer. To help a viewer intuitively compare values to quickly generate key takeaways, visualization designe...
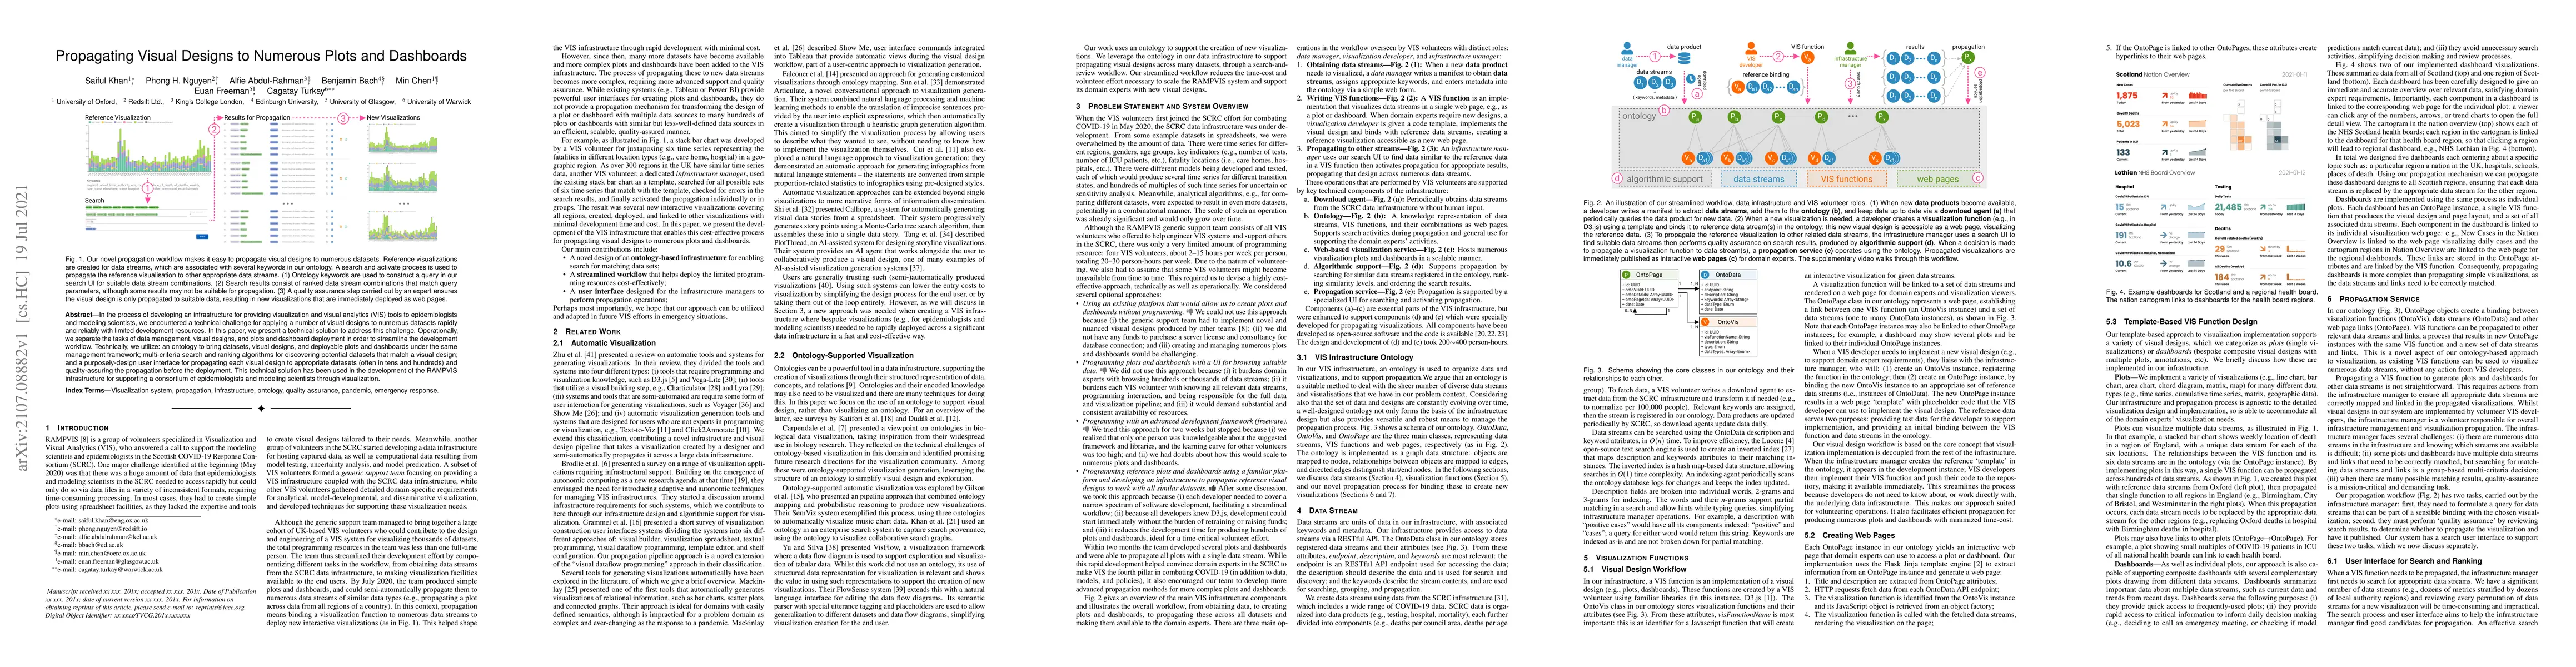
In the process of developing an infrastructure for providing visualization and visual analytics (VIS) tools to epidemiologists and modeling scientists, we encountered a technical challenge for apply...
We propose a bias-aware methodology to engage with power relations in natural language processing (NLP) research. NLP research rarely engages with bias in social contexts, limiting its ability to mi...
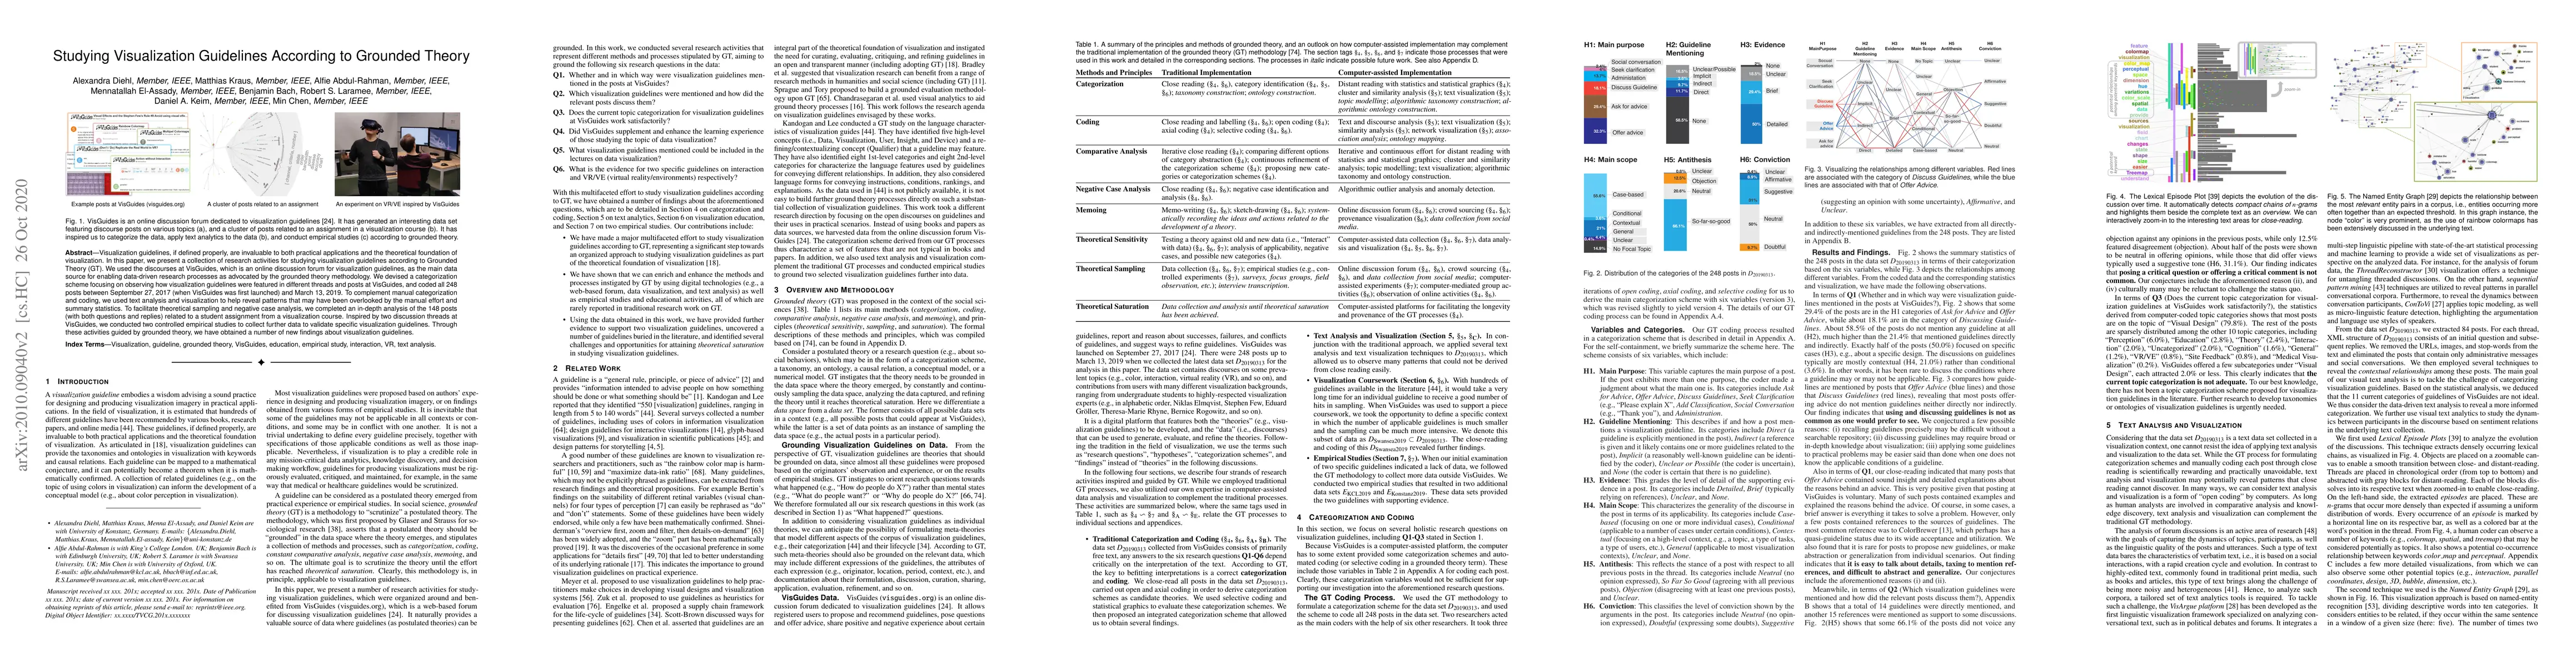
Visualization guidelines, if defined properly, are invaluable to both practical applications and the theoretical foundation of visualization. In this paper, we present a collection of research activ...
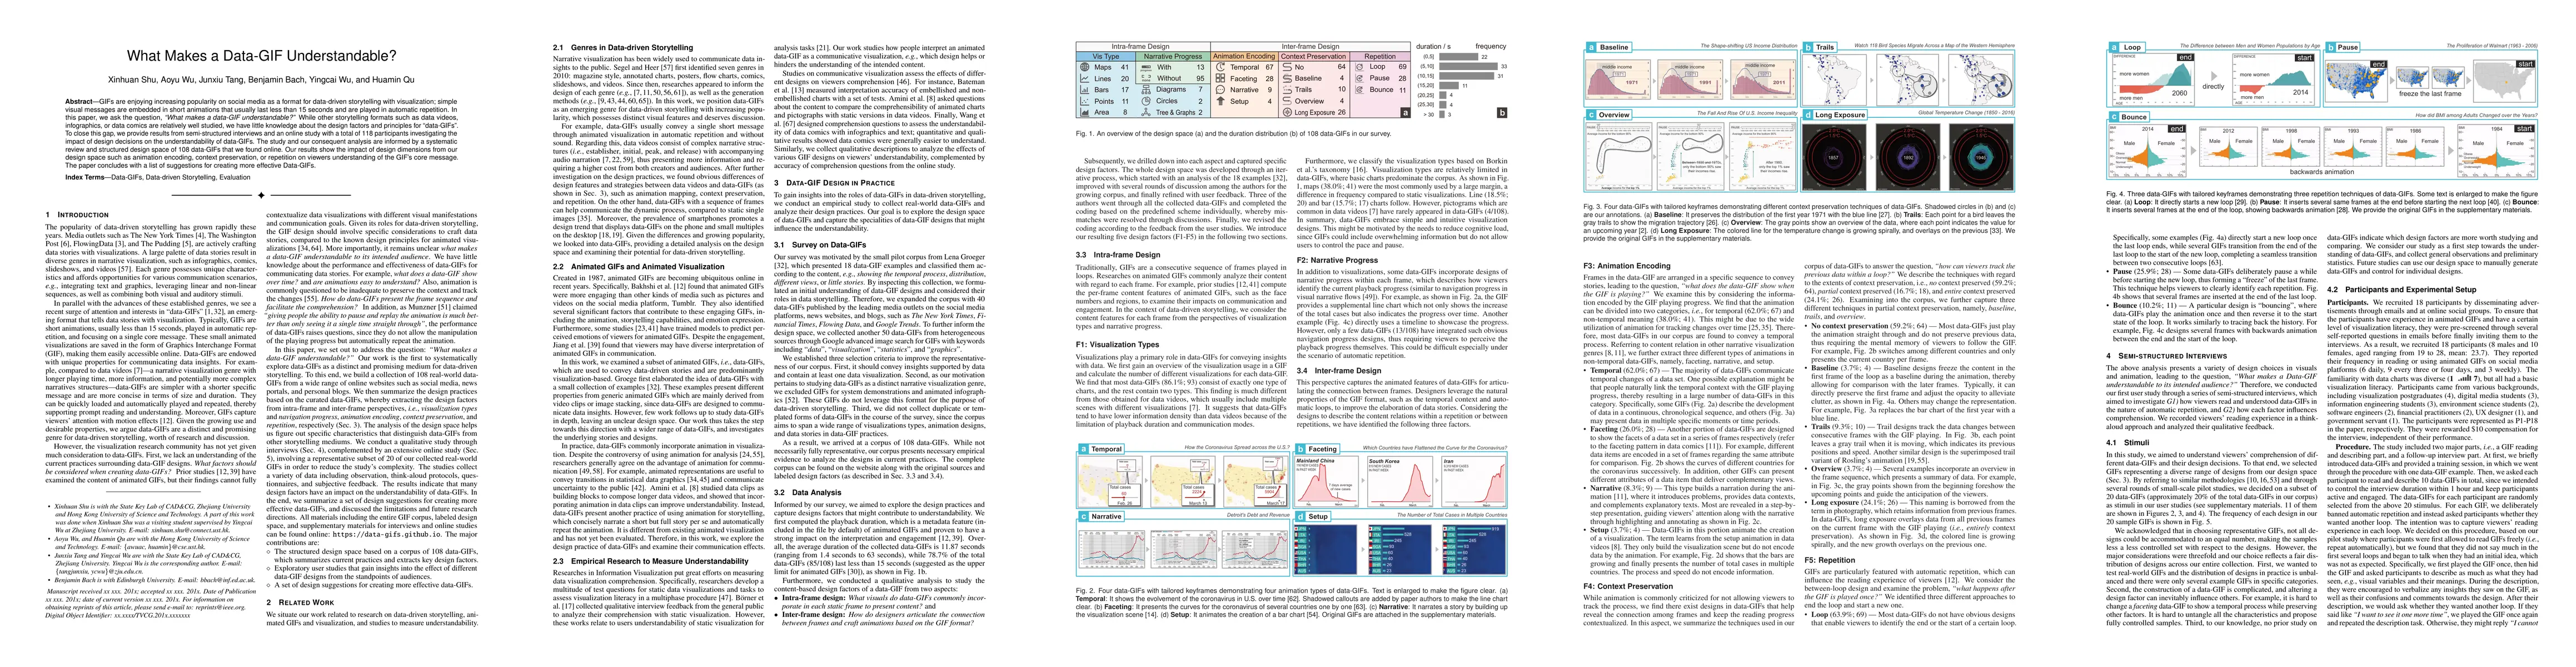
GIFs are enjoying increasing popularity on social media as a format for data-driven storytelling with visualization; simple visual messages are embedded in short animations that usually last less th...
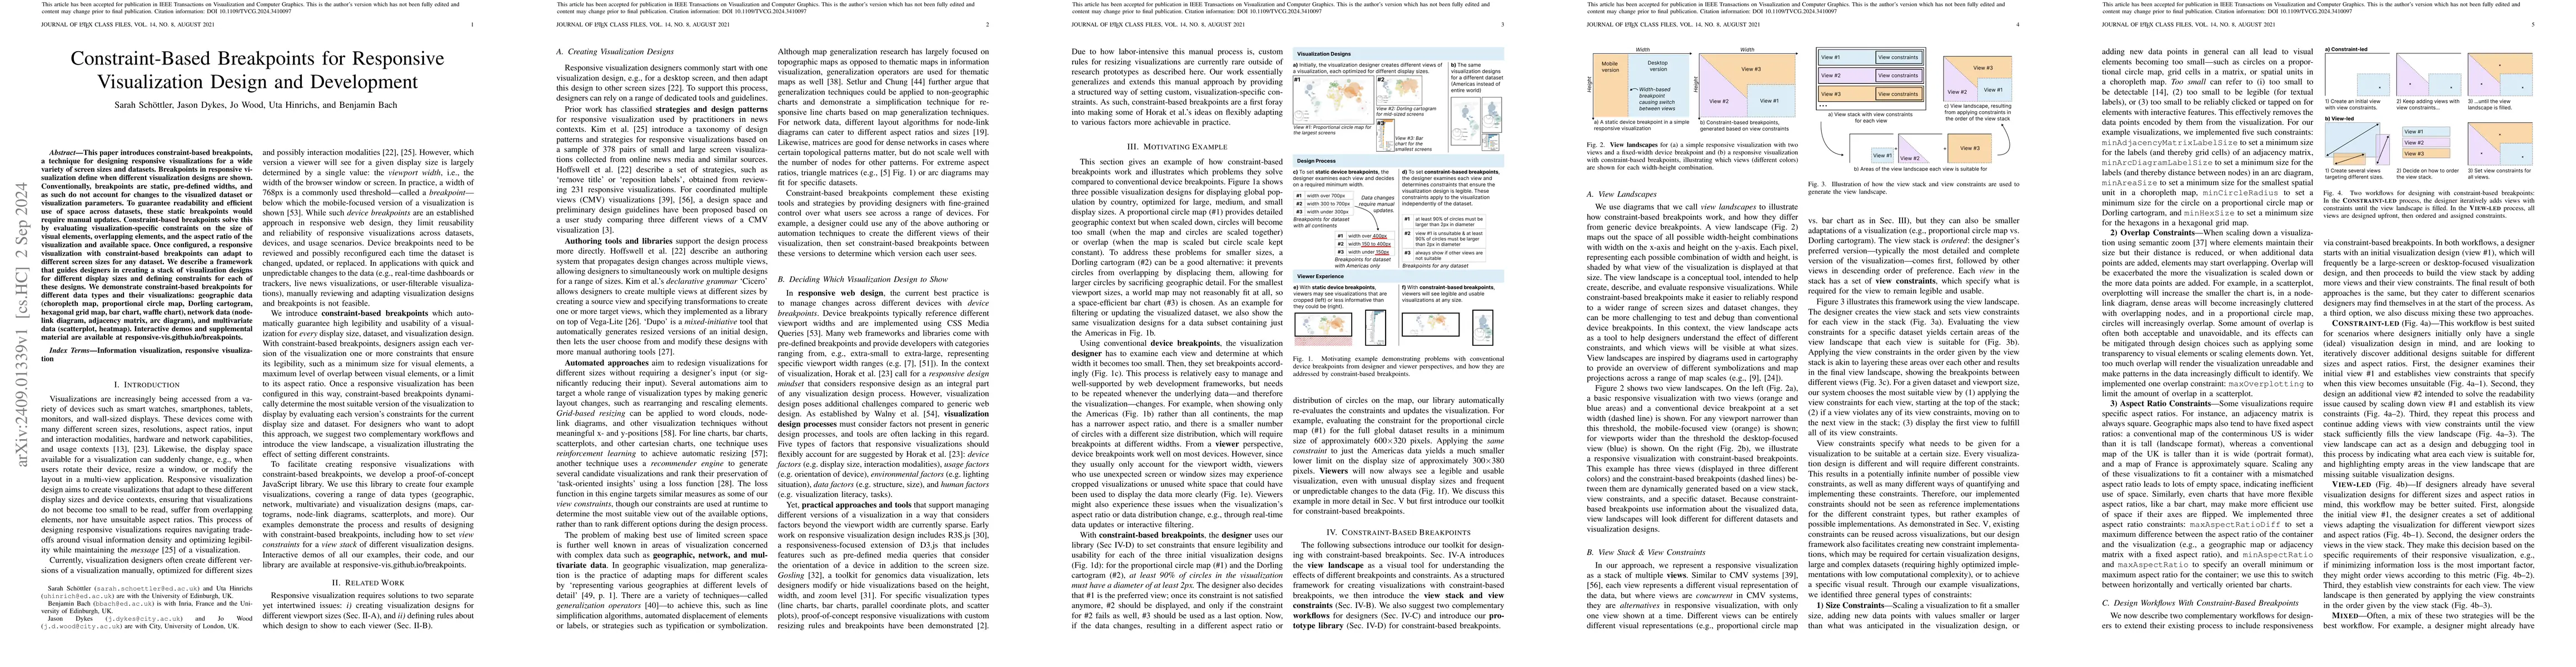
This paper introduces constraint-based breakpoints, a technique for designing responsive visualizations for a wide variety of screen sizes and datasets. Breakpoints in responsive visualization define ...
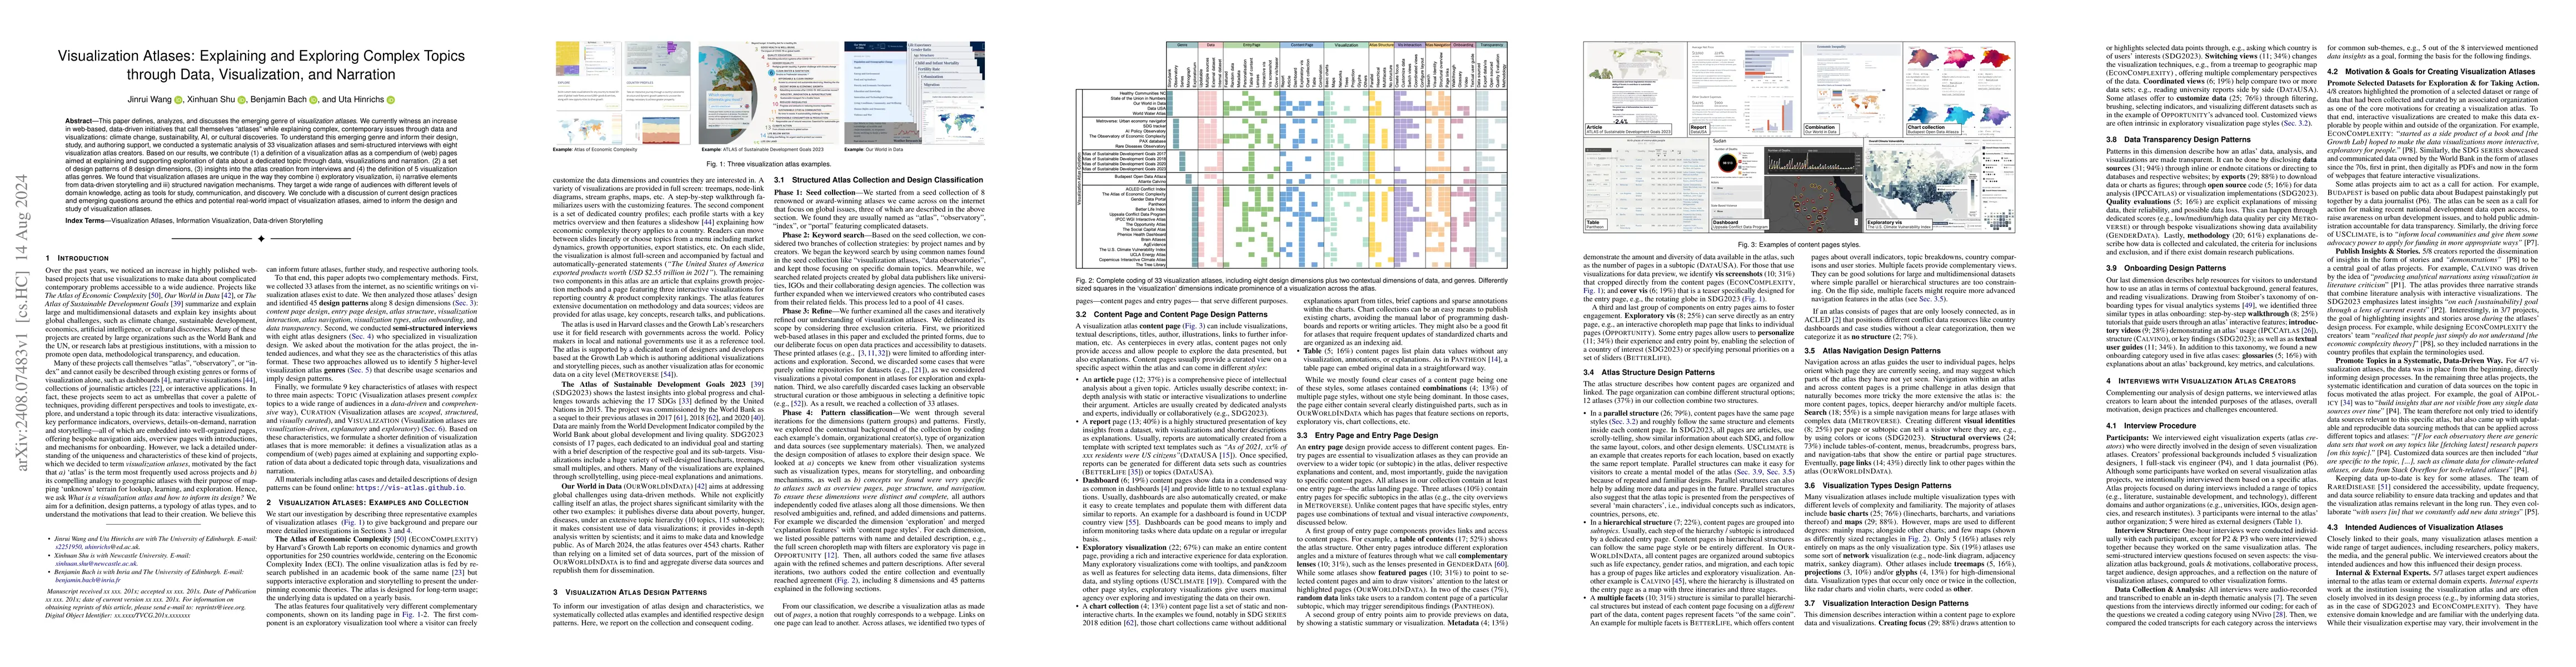
This paper defines, analyzes, and discusses the emerging genre of visualization atlases. We currently witness an increase in web-based, data-driven initiatives that call themselves "atlases" while exp...
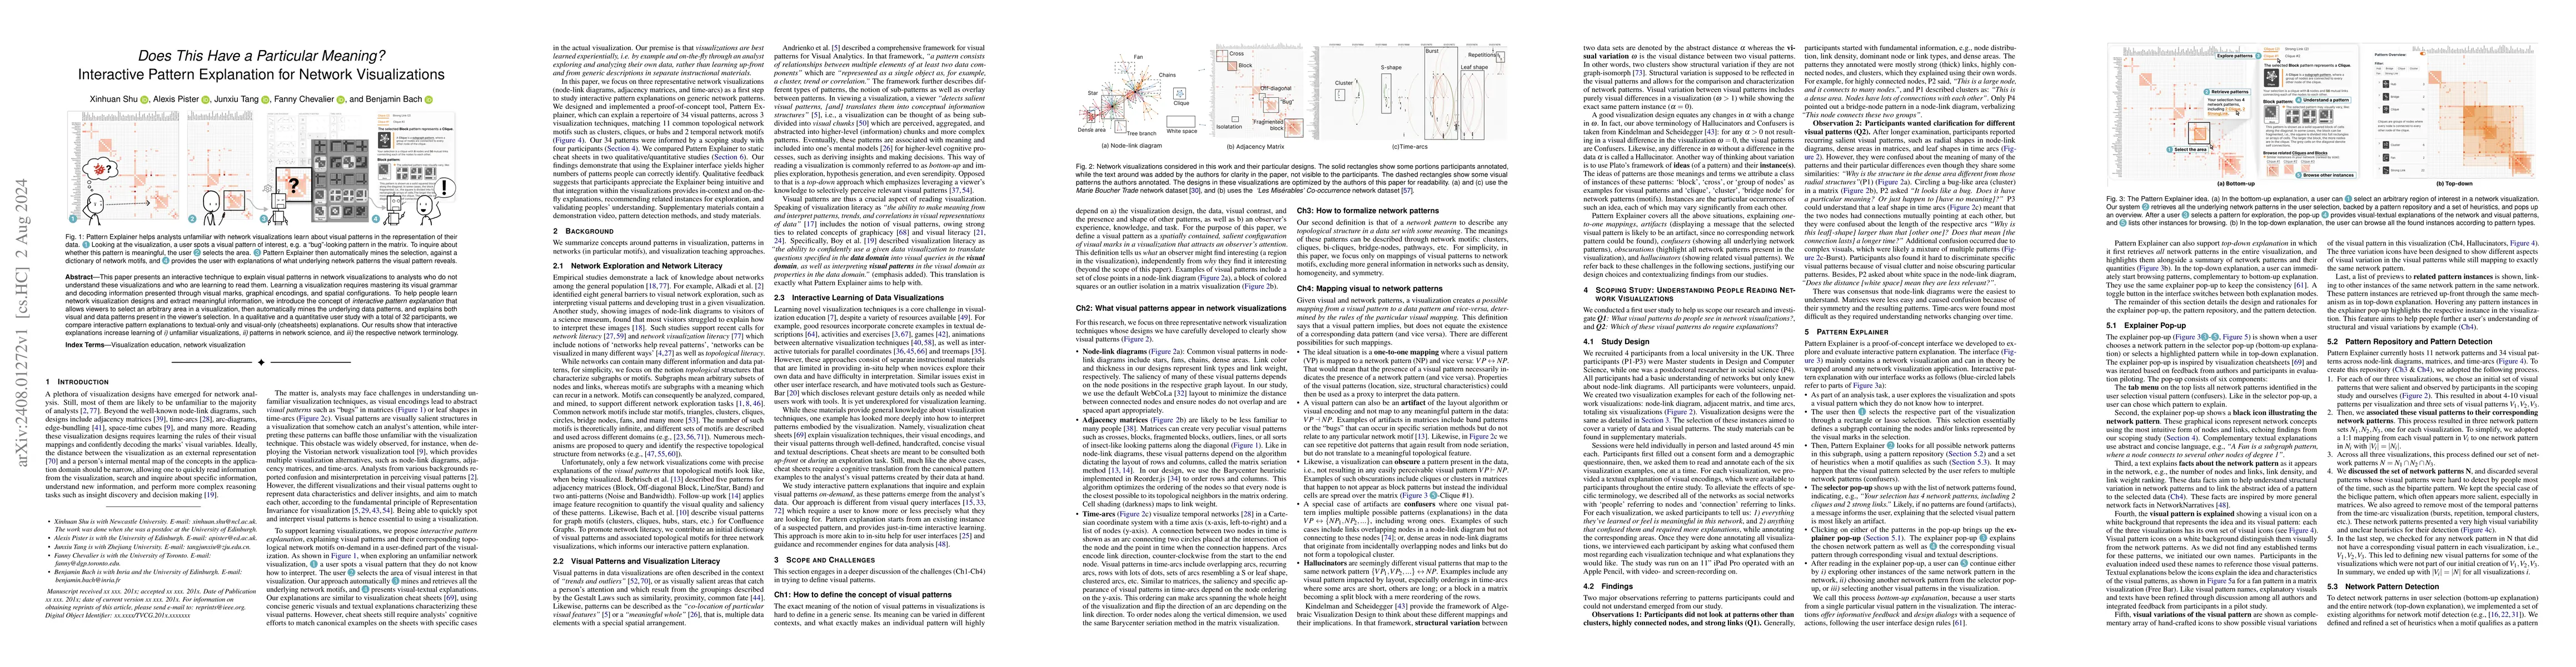
This paper presents an interactive technique to explain visual patterns in network visualizations to analysts who do not understand these visualizations and who are learning to read them. Learning a v...
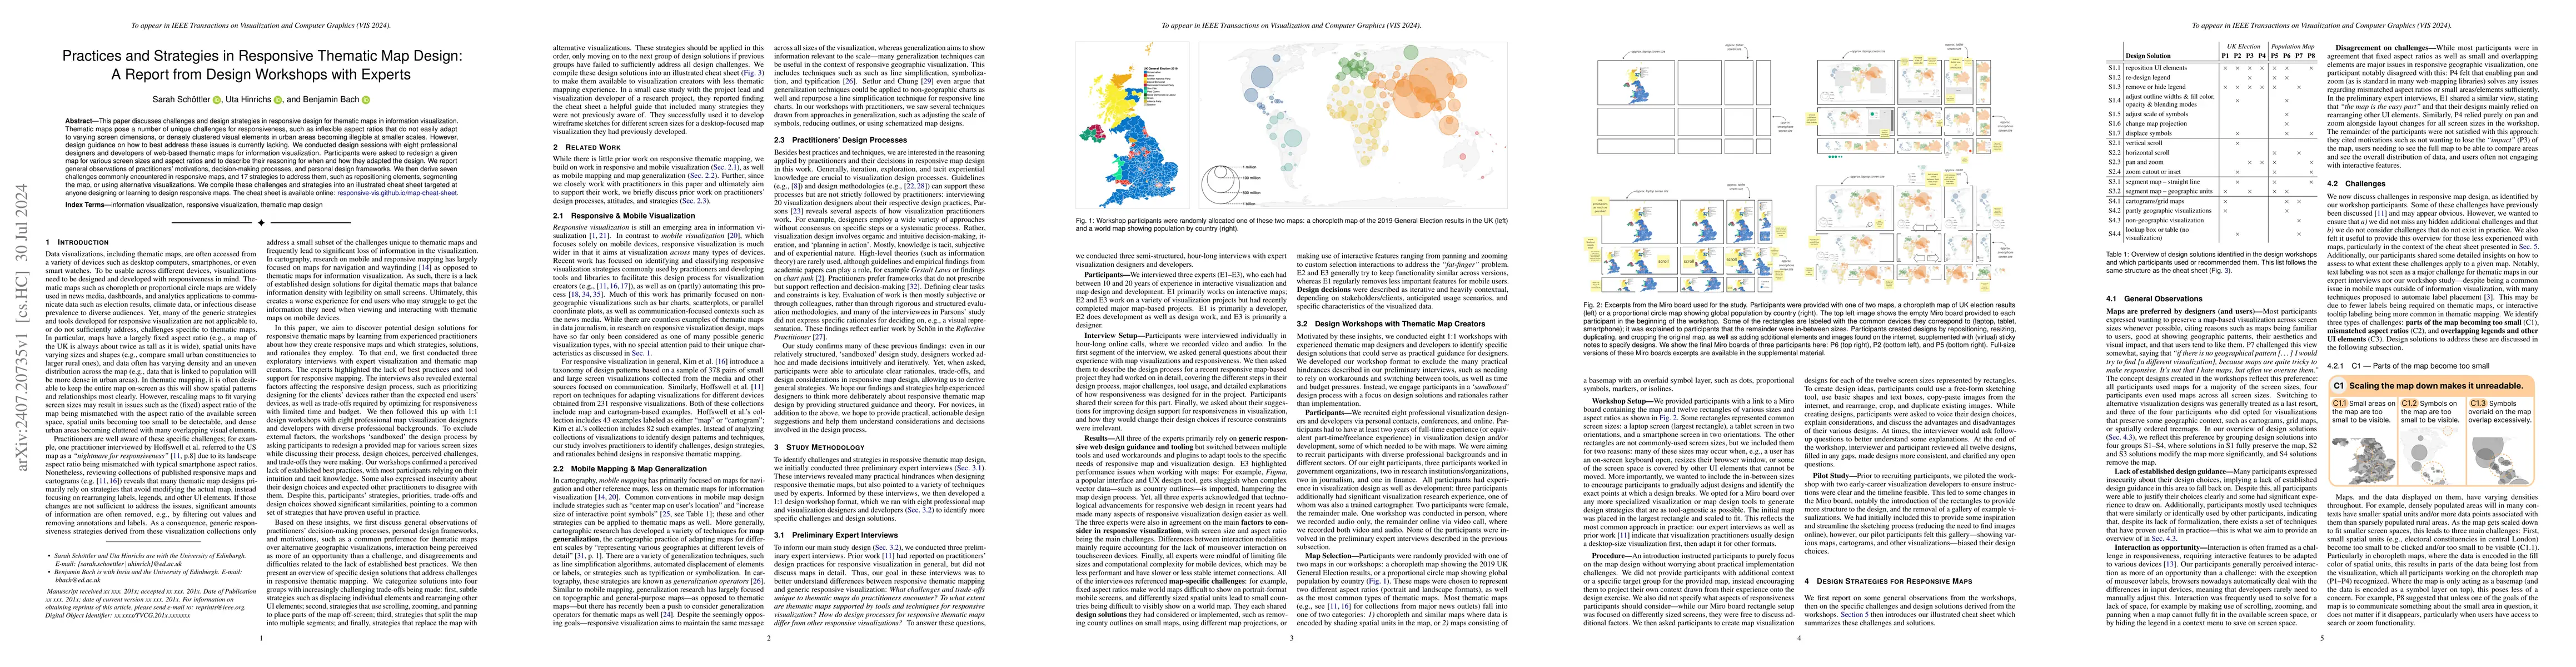
This paper discusses challenges and design strategies in responsive design for thematic maps in information visualization. Thematic maps pose a number of unique challenges for responsiveness, such as ...
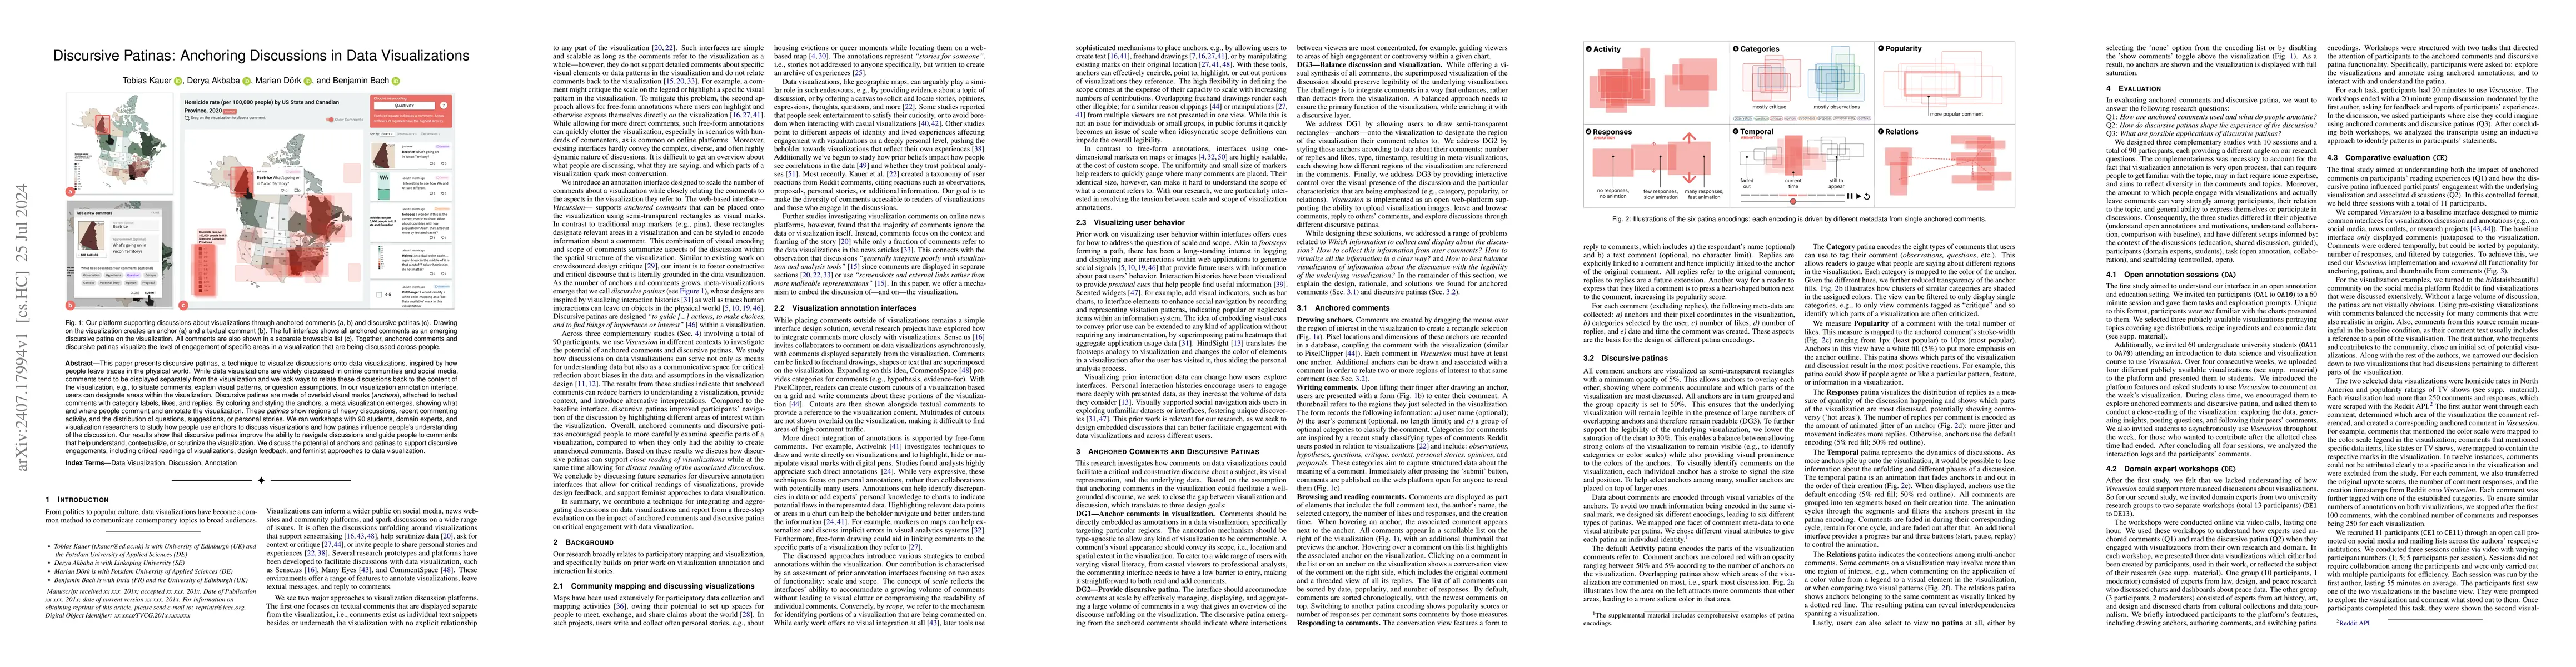
This paper presents discursive patinas, a technique to visualize discussions onto data visualizations, inspired by how people leave traces in the physical world. While data visualizations are widely d...
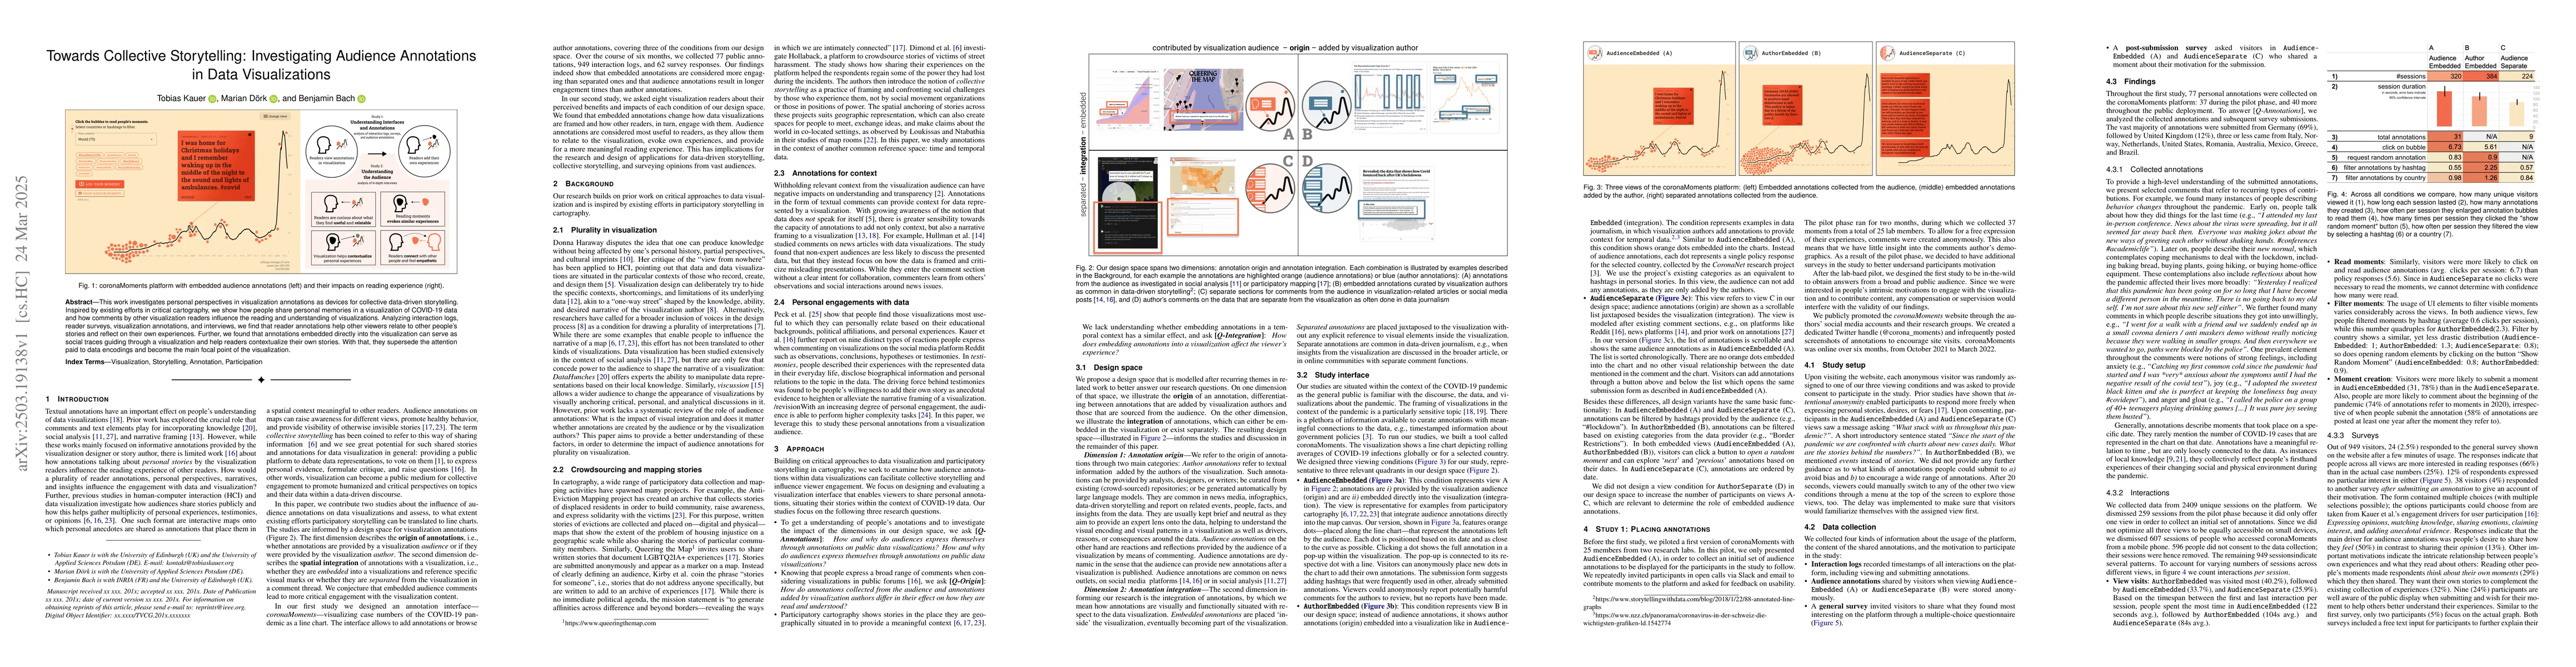
This work investigates personal perspectives in visualization annotations as devices for collective data-driven storytelling. Inspired by existing efforts in critical cartography, we show how people s...
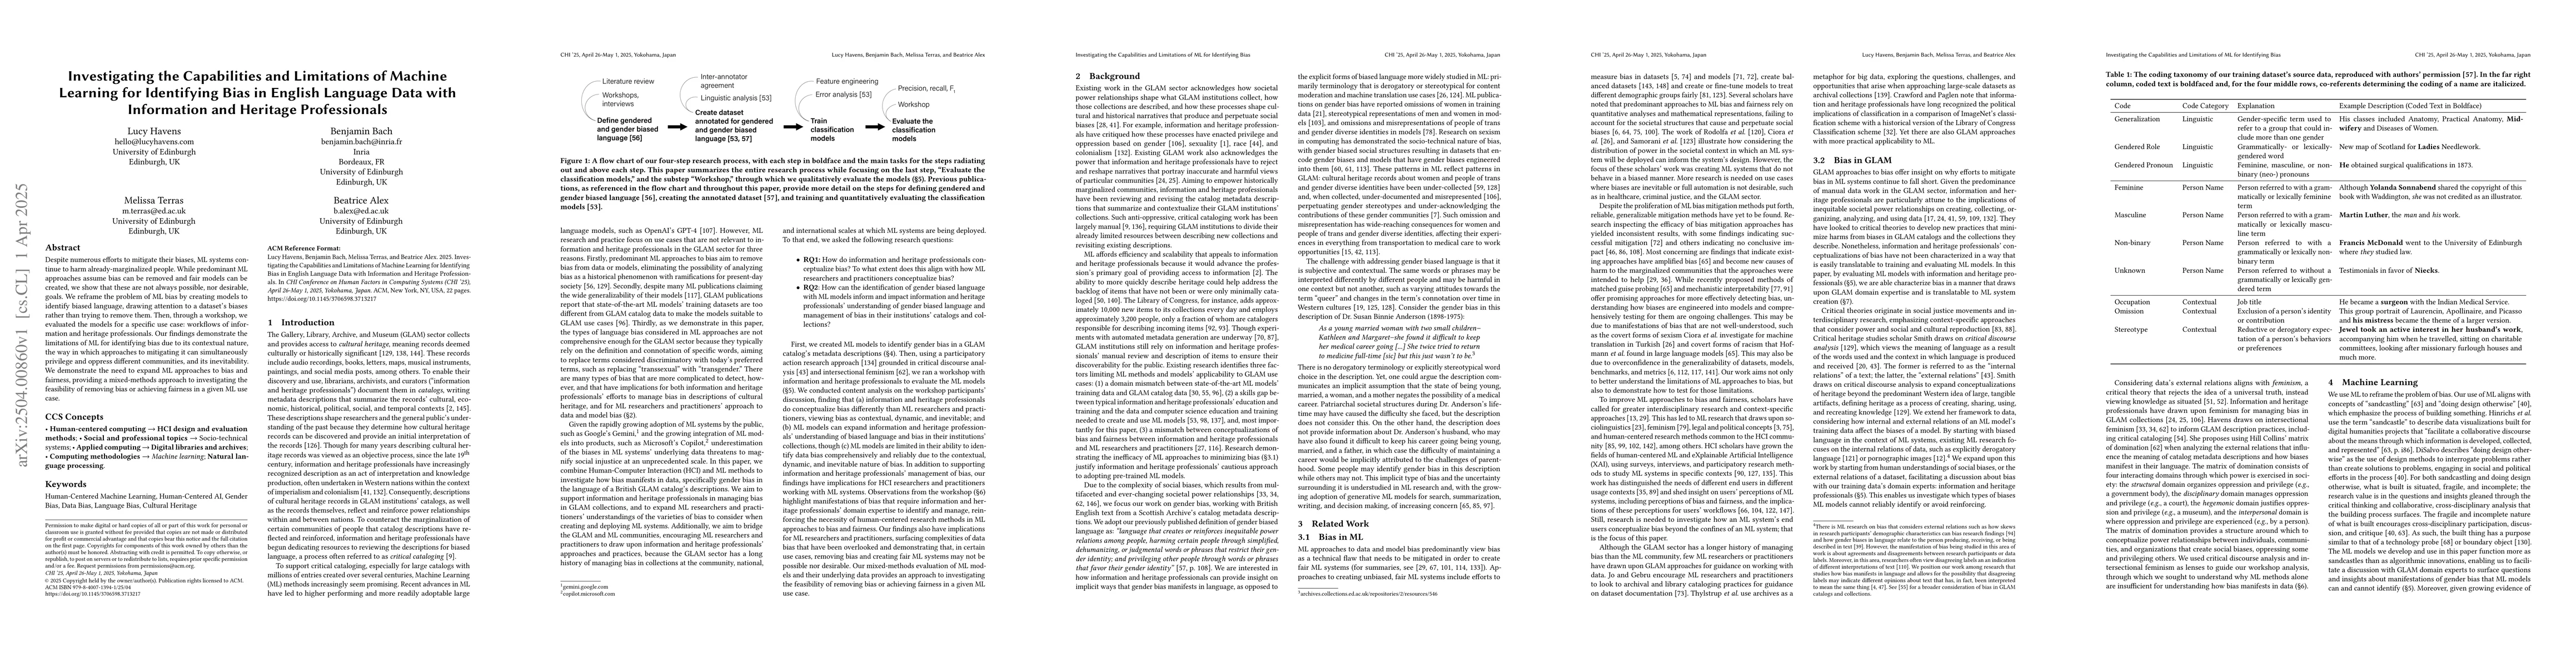
Despite numerous efforts to mitigate their biases, ML systems continue to harm already-marginalized people. While predominant ML approaches assume bias can be removed and fair models can be created, w...
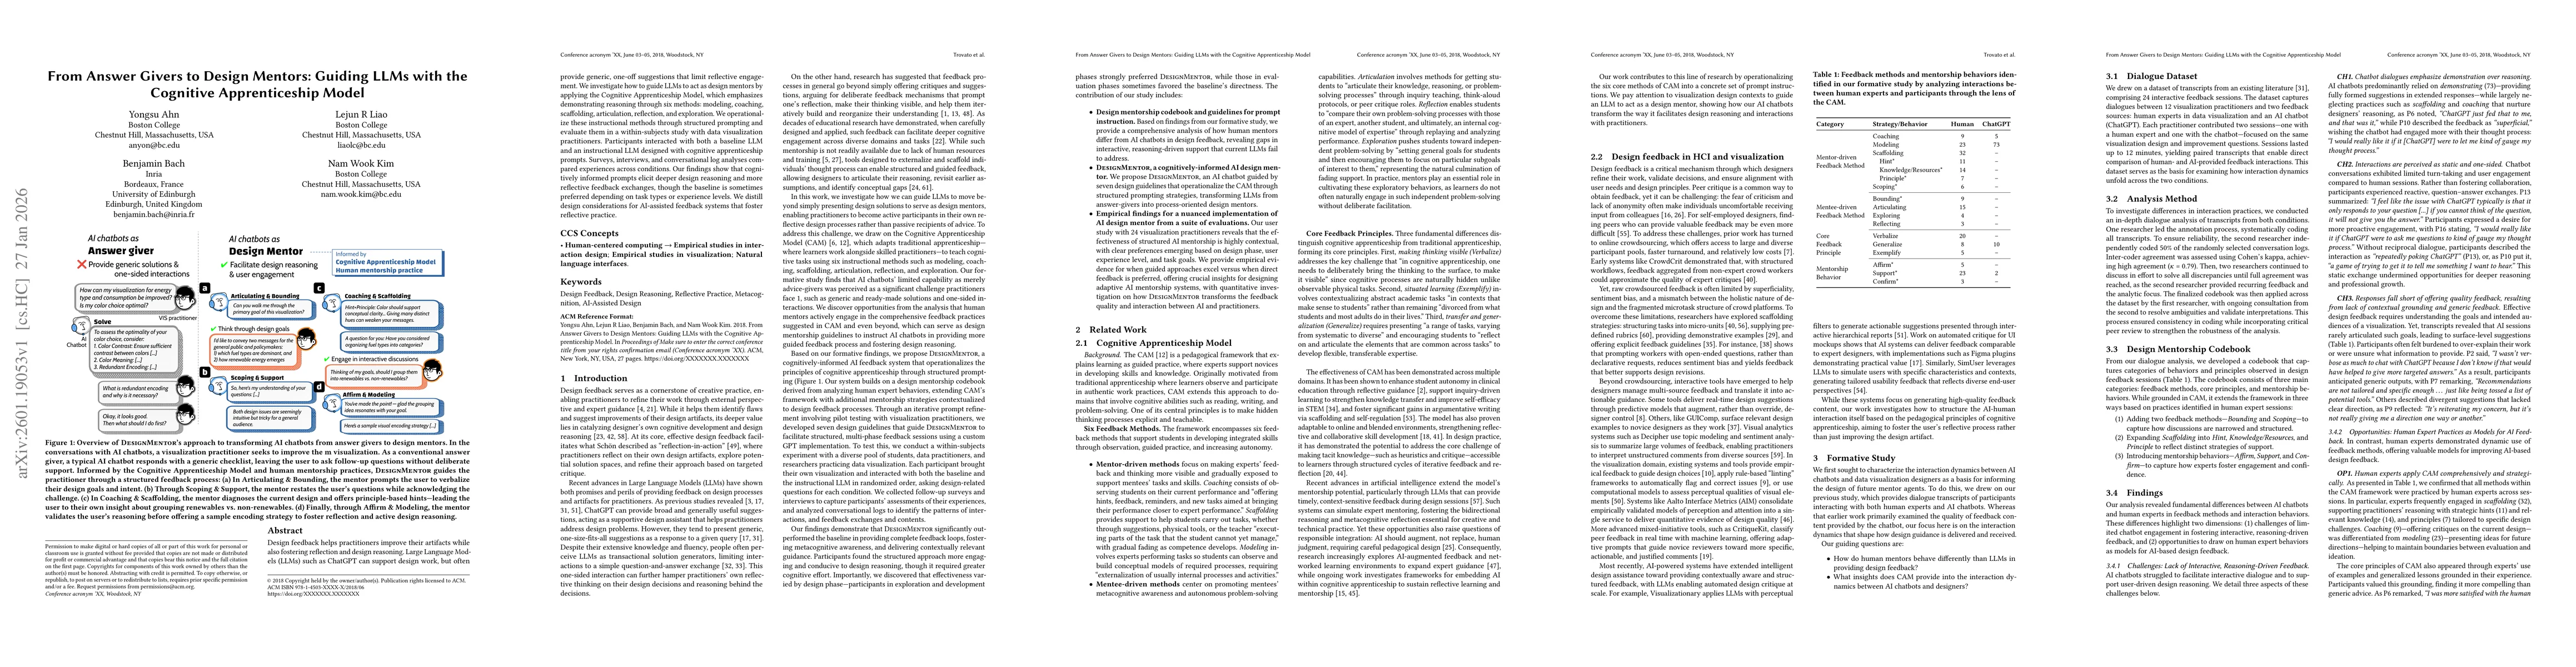
Design feedback helps practitioners improve their artifacts while also fostering reflection and design reasoning. Large Language Models (LLMs) such as ChatGPT can support design work, but often provid...
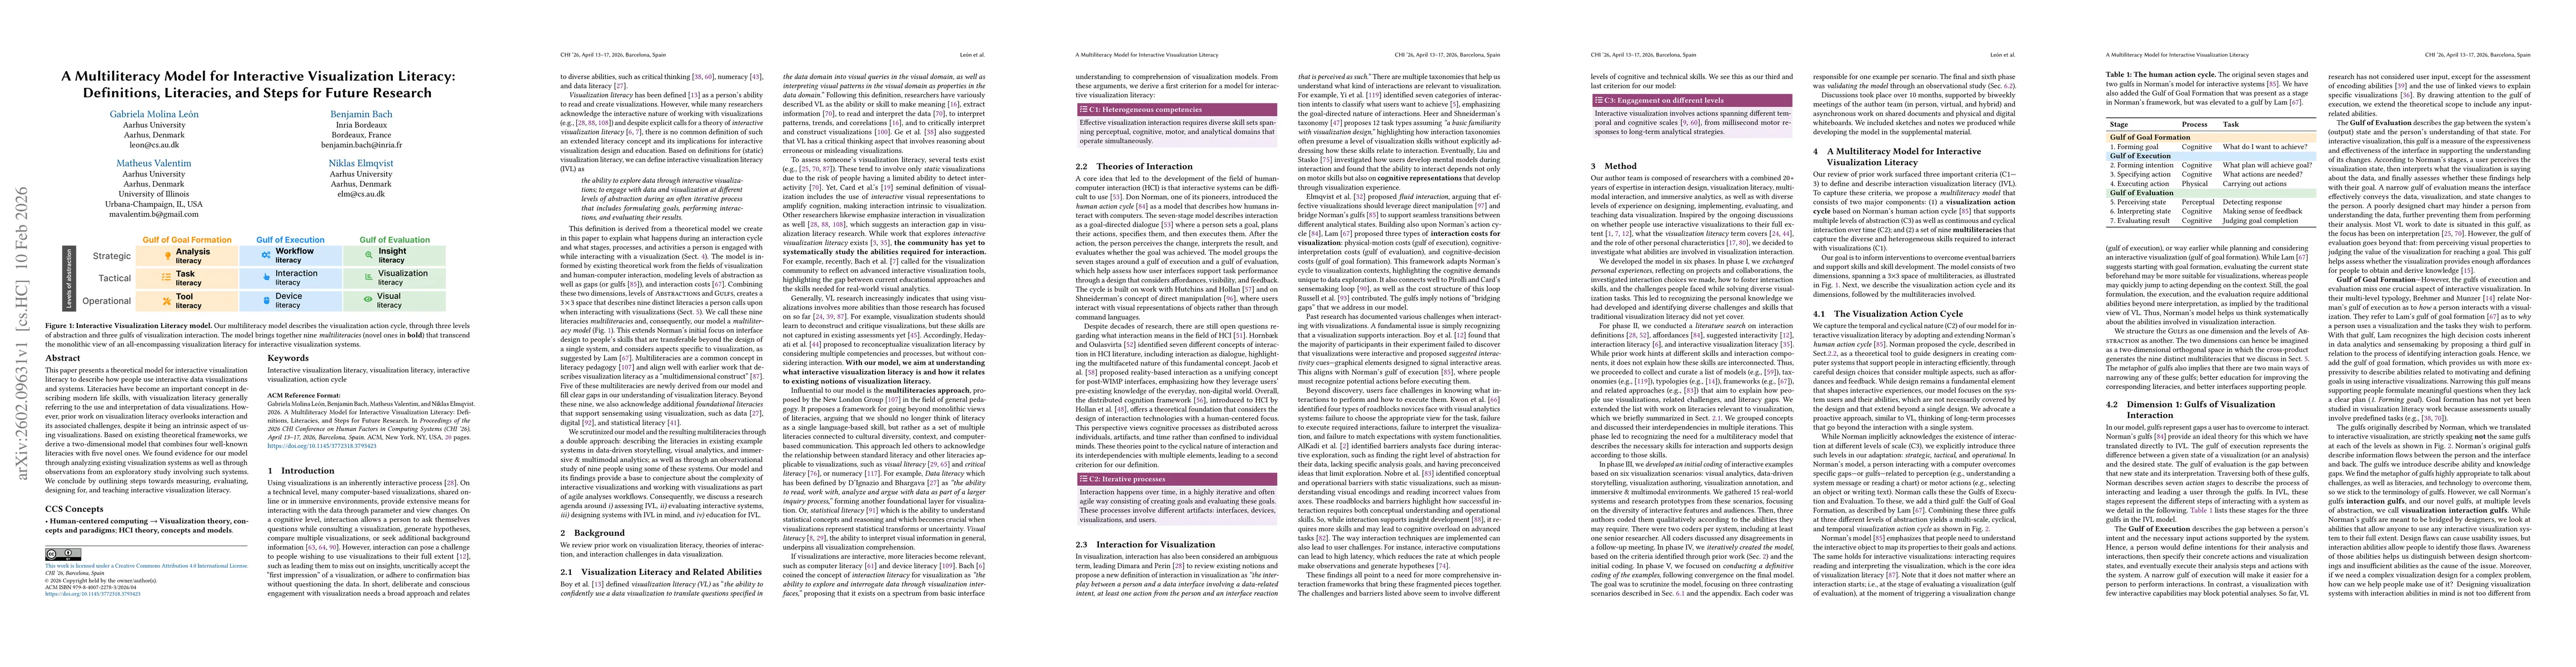
This paper presents a theoretical model for interactive visualization literacy to describe how people use interactive data visualizations and systems. Literacies have become an important concept in de...
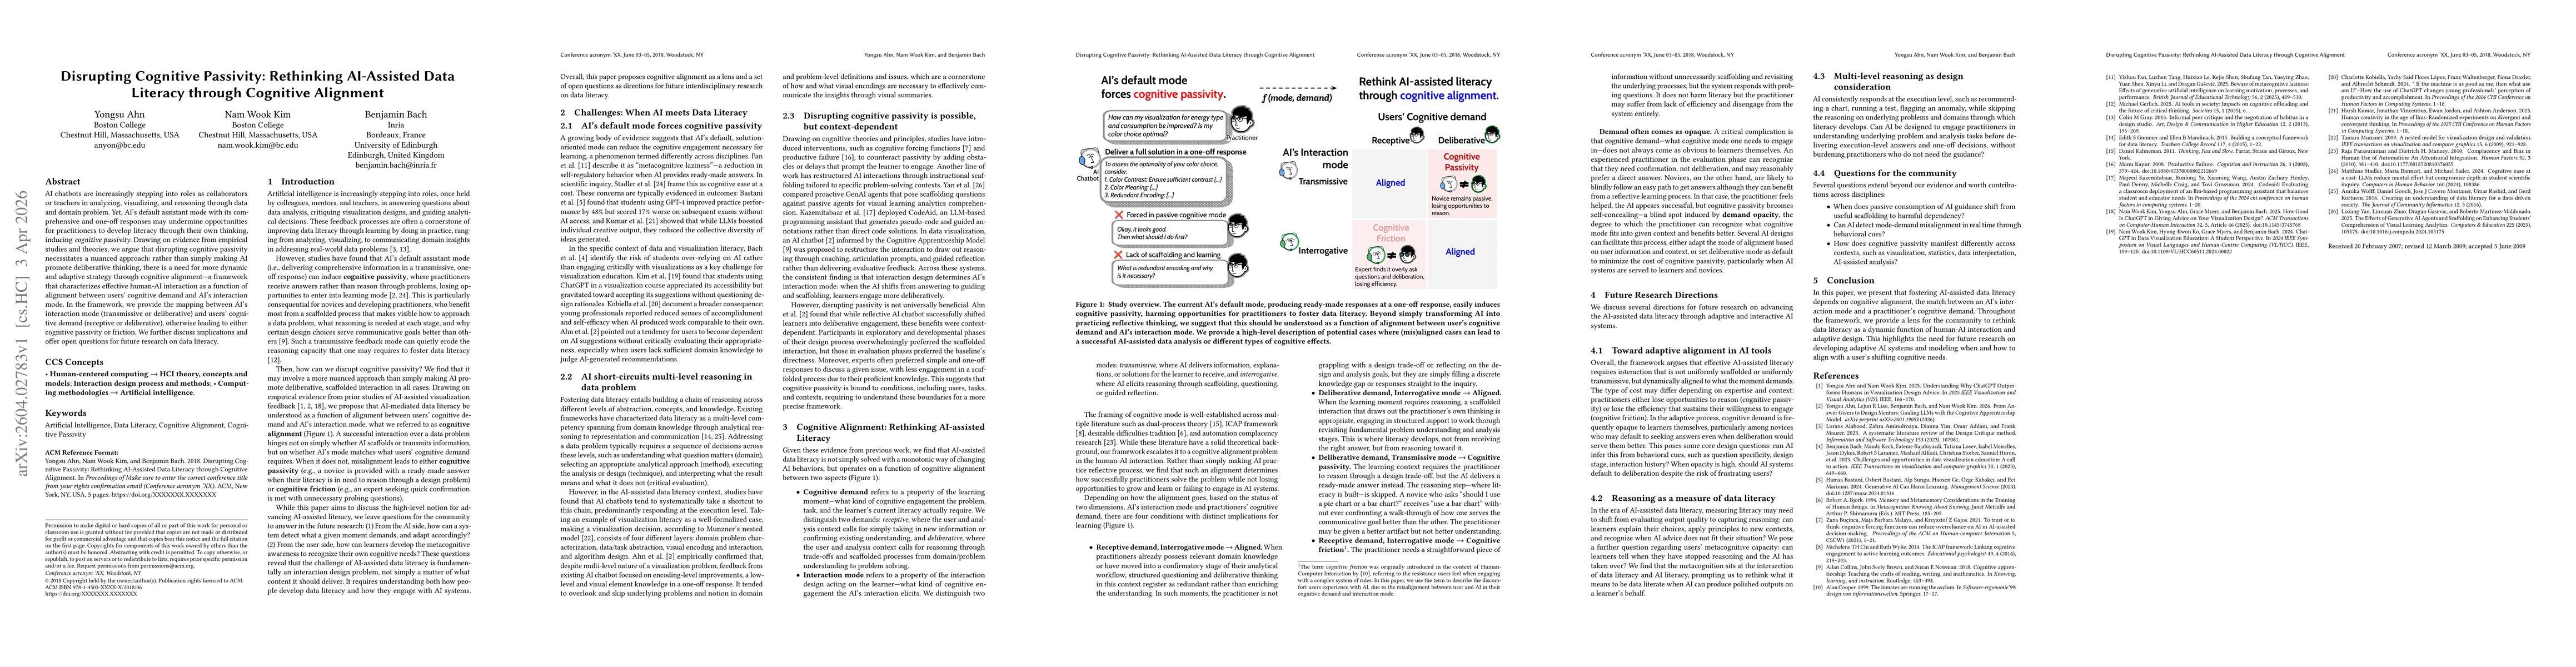
AI chatbots are increasingly stepping into roles as collaborators or teachers in analyzing, visualizing, and reasoning through data and domain problem. Yet, AI's default assistant mode with its compre...
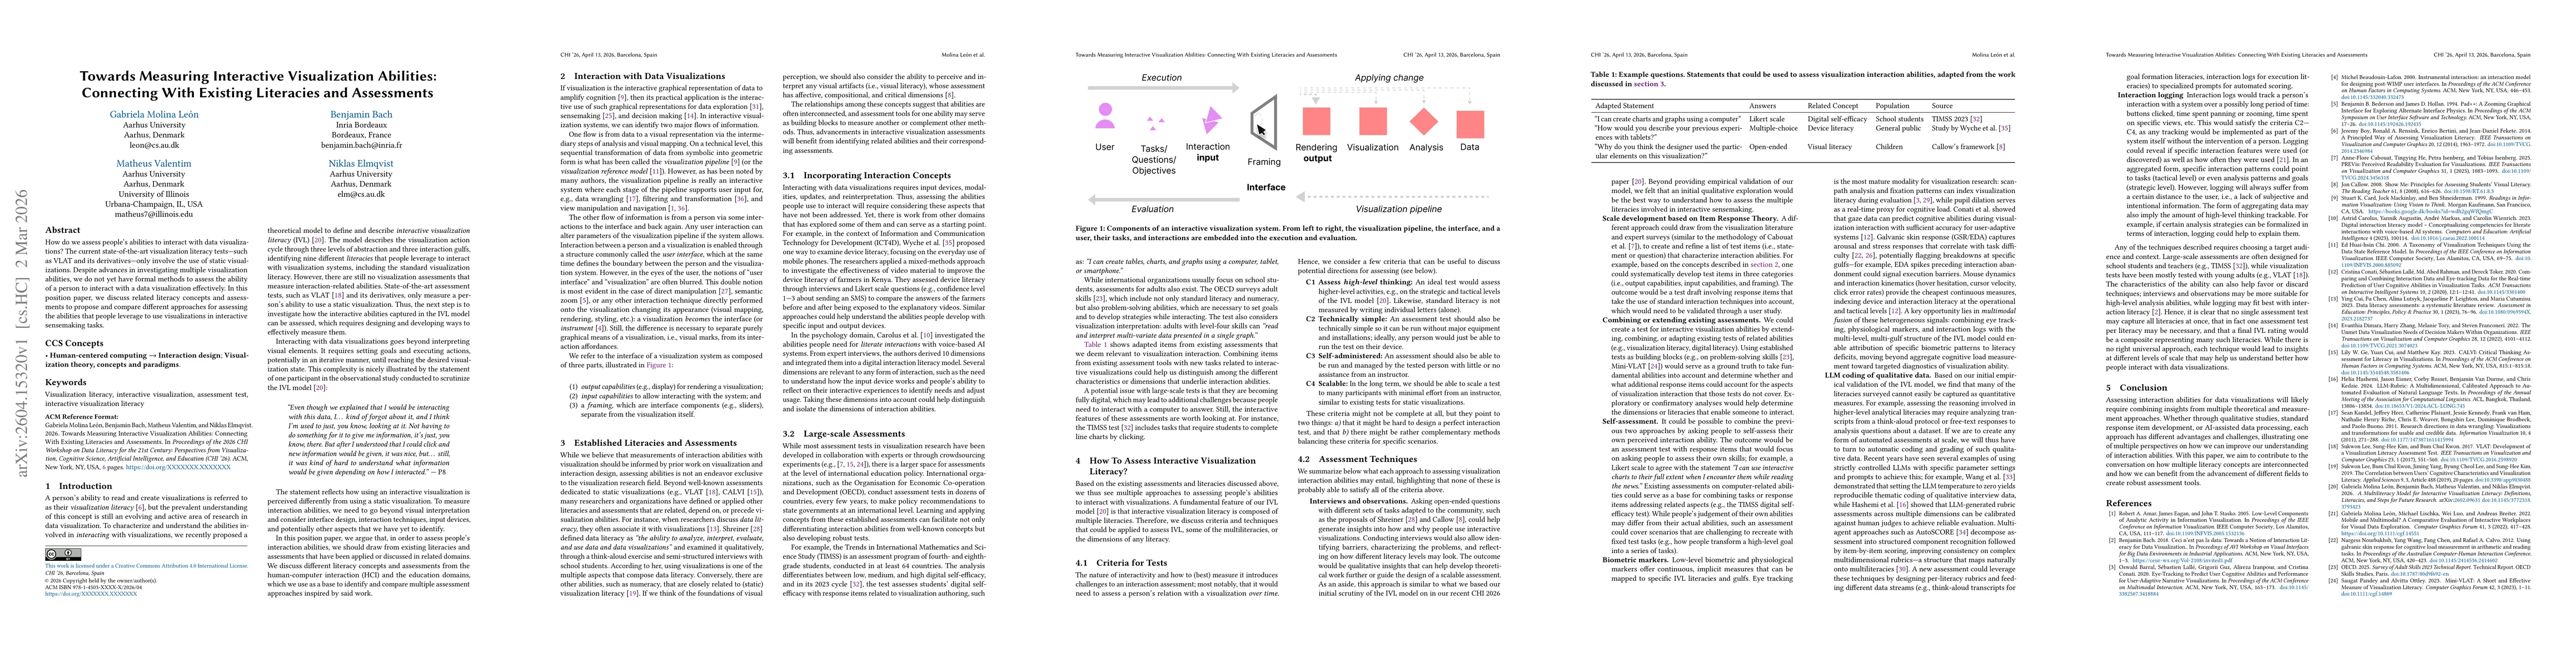
How do we assess people's abilities to interact with data visualizations? The current state-of-the-art visualization literacy tests -- such as VLAT and its derivatives -- only involve the use of stati...
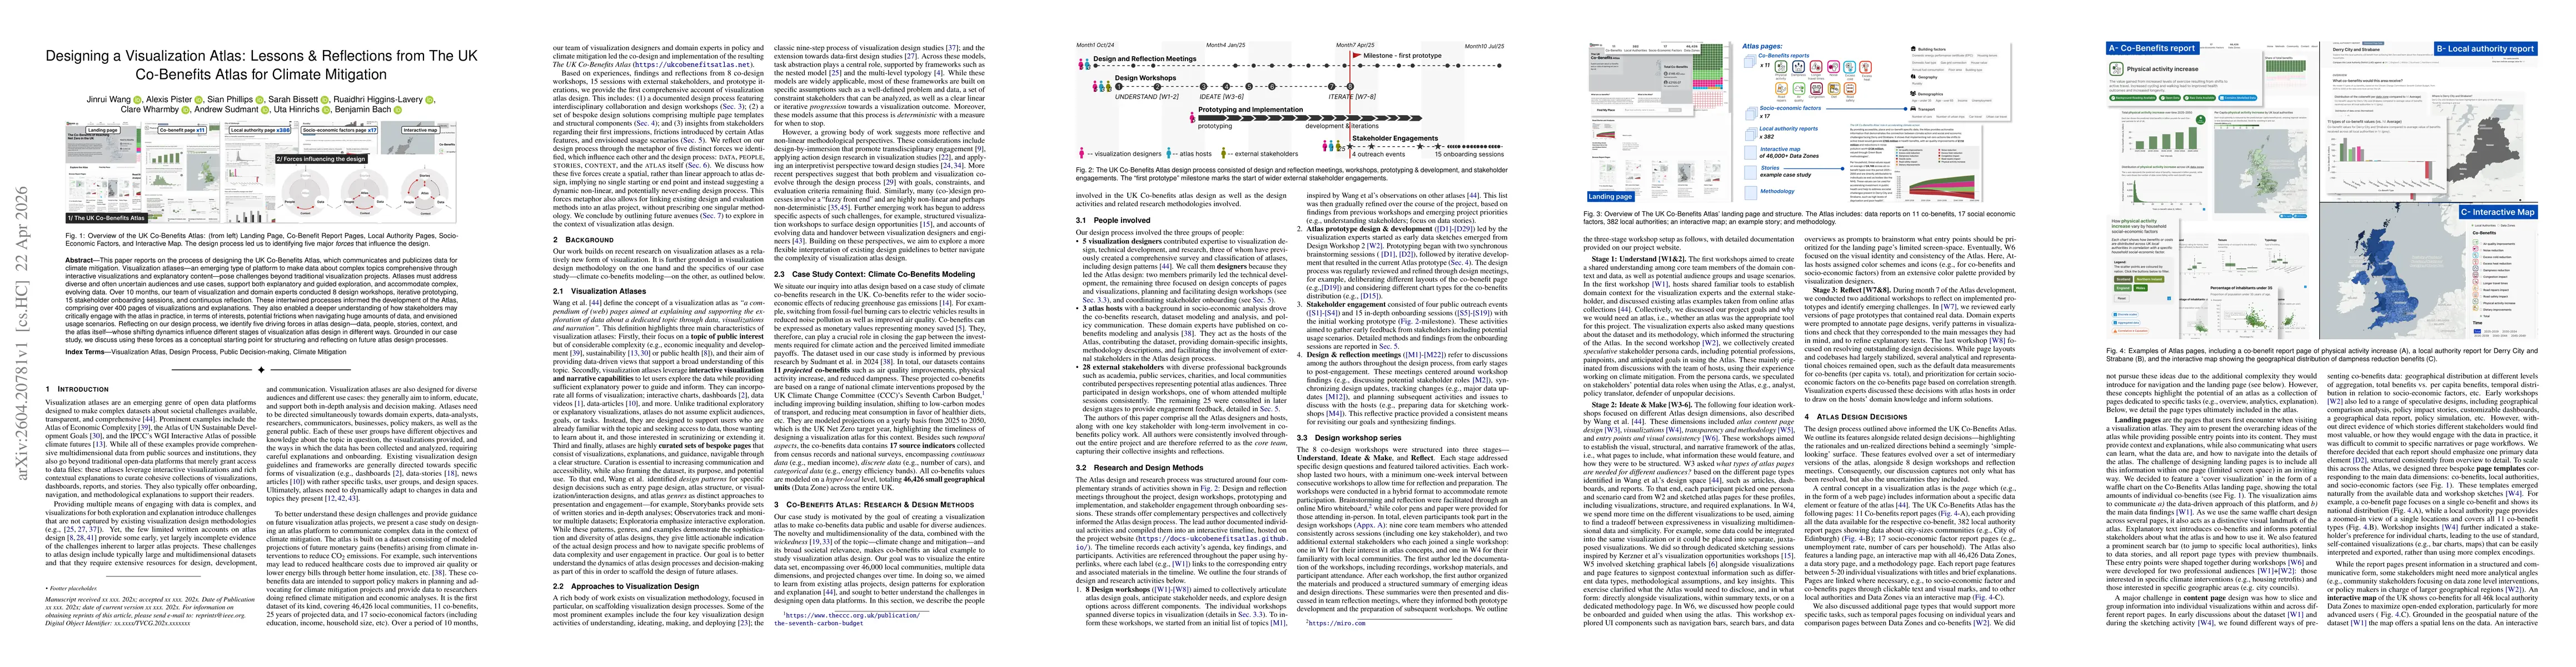
This paper reports on the process of designing the UK Co-Benefits Atlas, which communicates and publicizes data for climate mitigation. Visualization atlases -- an emerging type of platform to make da...