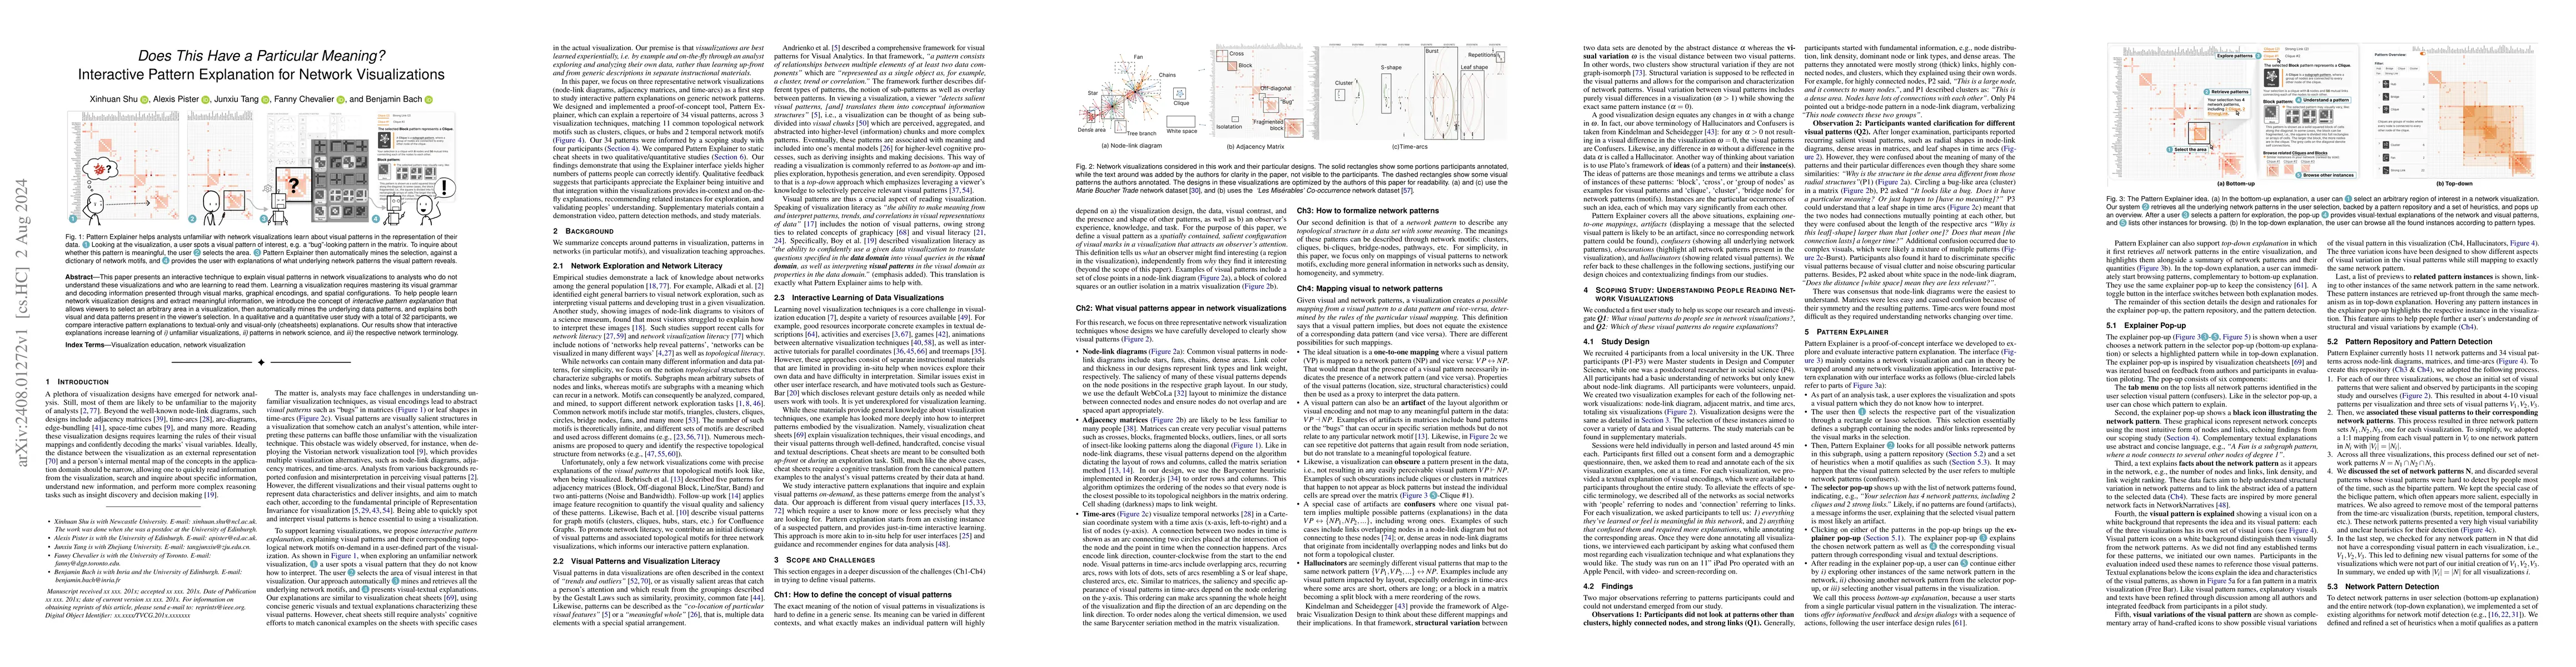
Does This Have a Particular Meaning? Interactive Pattern Explanation for Network Visualizations
Publication
Metrics
AI Quick Summary
This paper introduces an interactive technique to explain visual patterns in network visualizations for analysts. The method allows users to select areas for automatic data pattern mining and explanation, improving learning of visualizations, network science patterns, and terminology, as shown in user studies.
Paper Preview
Abstract
This paper presents an interactive technique to explain visual patterns in network visualizations to analysts who do not understand these visualizations and who are learning to read them. Learning a visualization requires mastering its visual grammar and decoding information presented through visual marks, graphical encodings, and spatial configurations. To help people learn network visualization designs and extract meaningful information, we introduce the concept of interactive pattern explanation that allows viewers to select an arbitrary area in a visualization, then automatically mines the underlying data patterns, and explains both visual and data patterns present in the viewer's selection. In a qualitative and a quantitative user study with a total of 32 participants, we compare interactive pattern explanations to textual-only and visual-only (cheatsheets) explanations. Our results show that interactive explanations increase learning of i) unfamiliar visualizations, ii) patterns in network science, and iii) the respective network terminology.
AI Key Findings
Get AI-generated insights about this paper's methodology, results, significance, and more — seven facets brought into focus.
Impact
Paper Details
Authors
PDF Preview
Citation Network
Current paper (gray), citations (green), references (blue)
Display is limited for performance on very large graphs.
Discussion 0