Academic Profile
Statistics
Similar Authors
Papers on arXiv
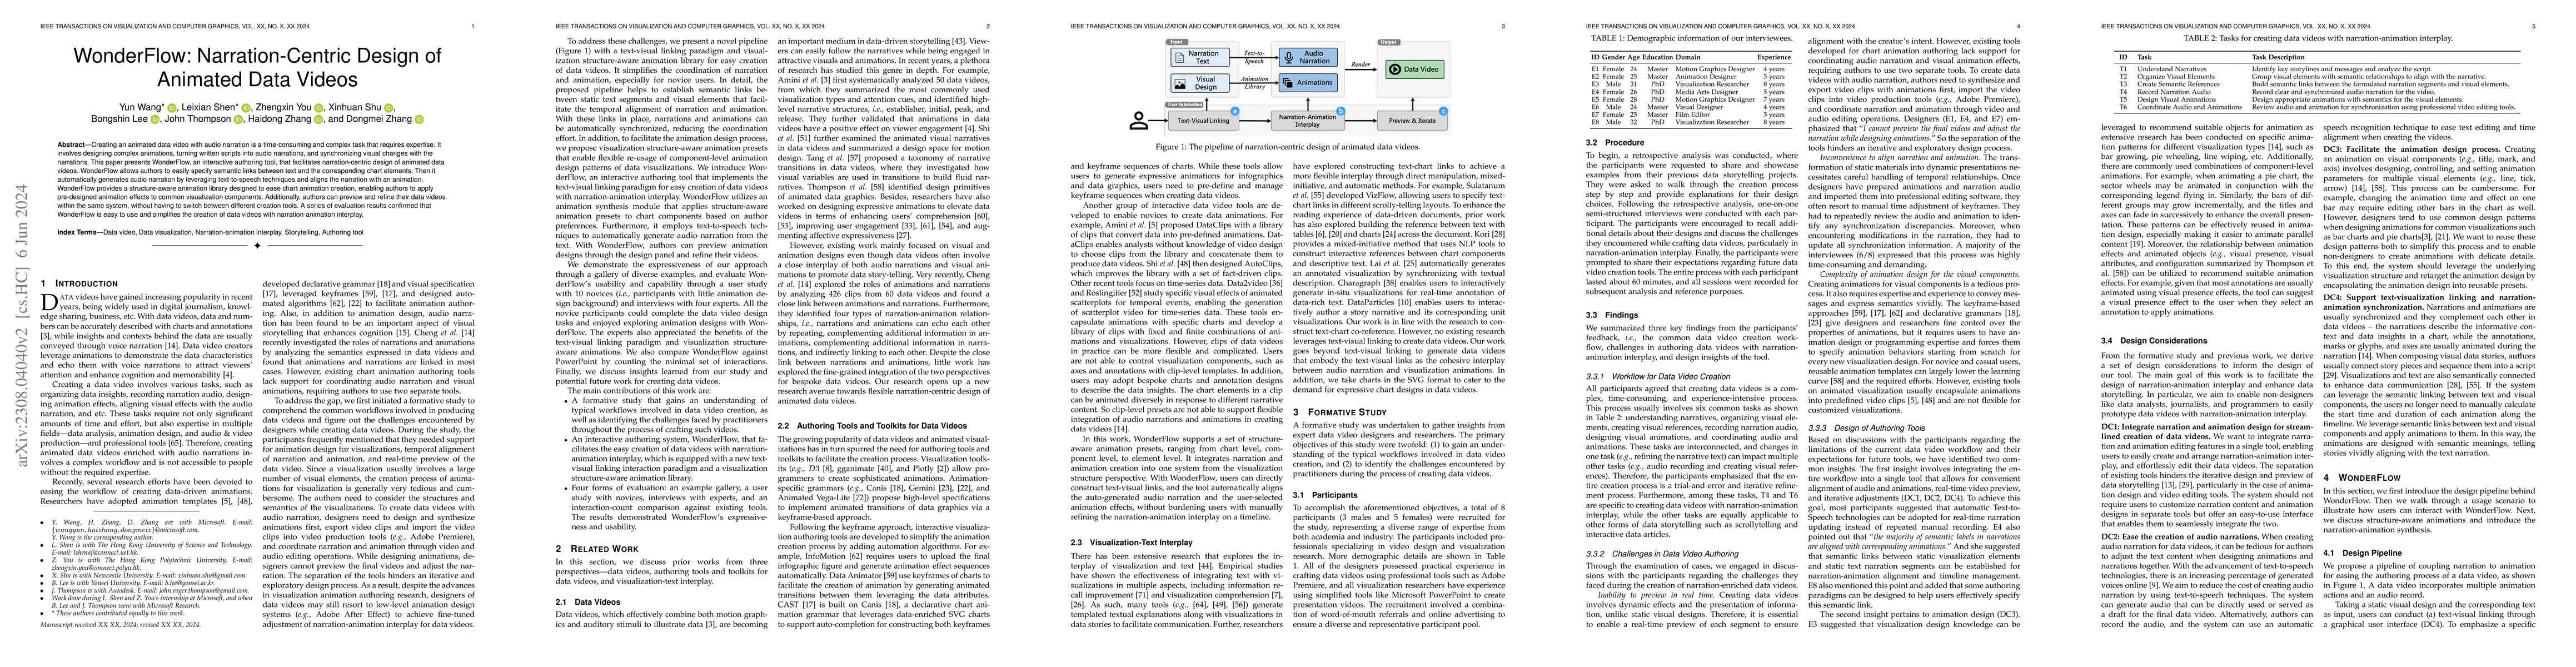
Creating an animated data video enriched with audio narration takes a significant amount of time and effort and requires expertise. Users not only need to design complex animations, but also turn wr...
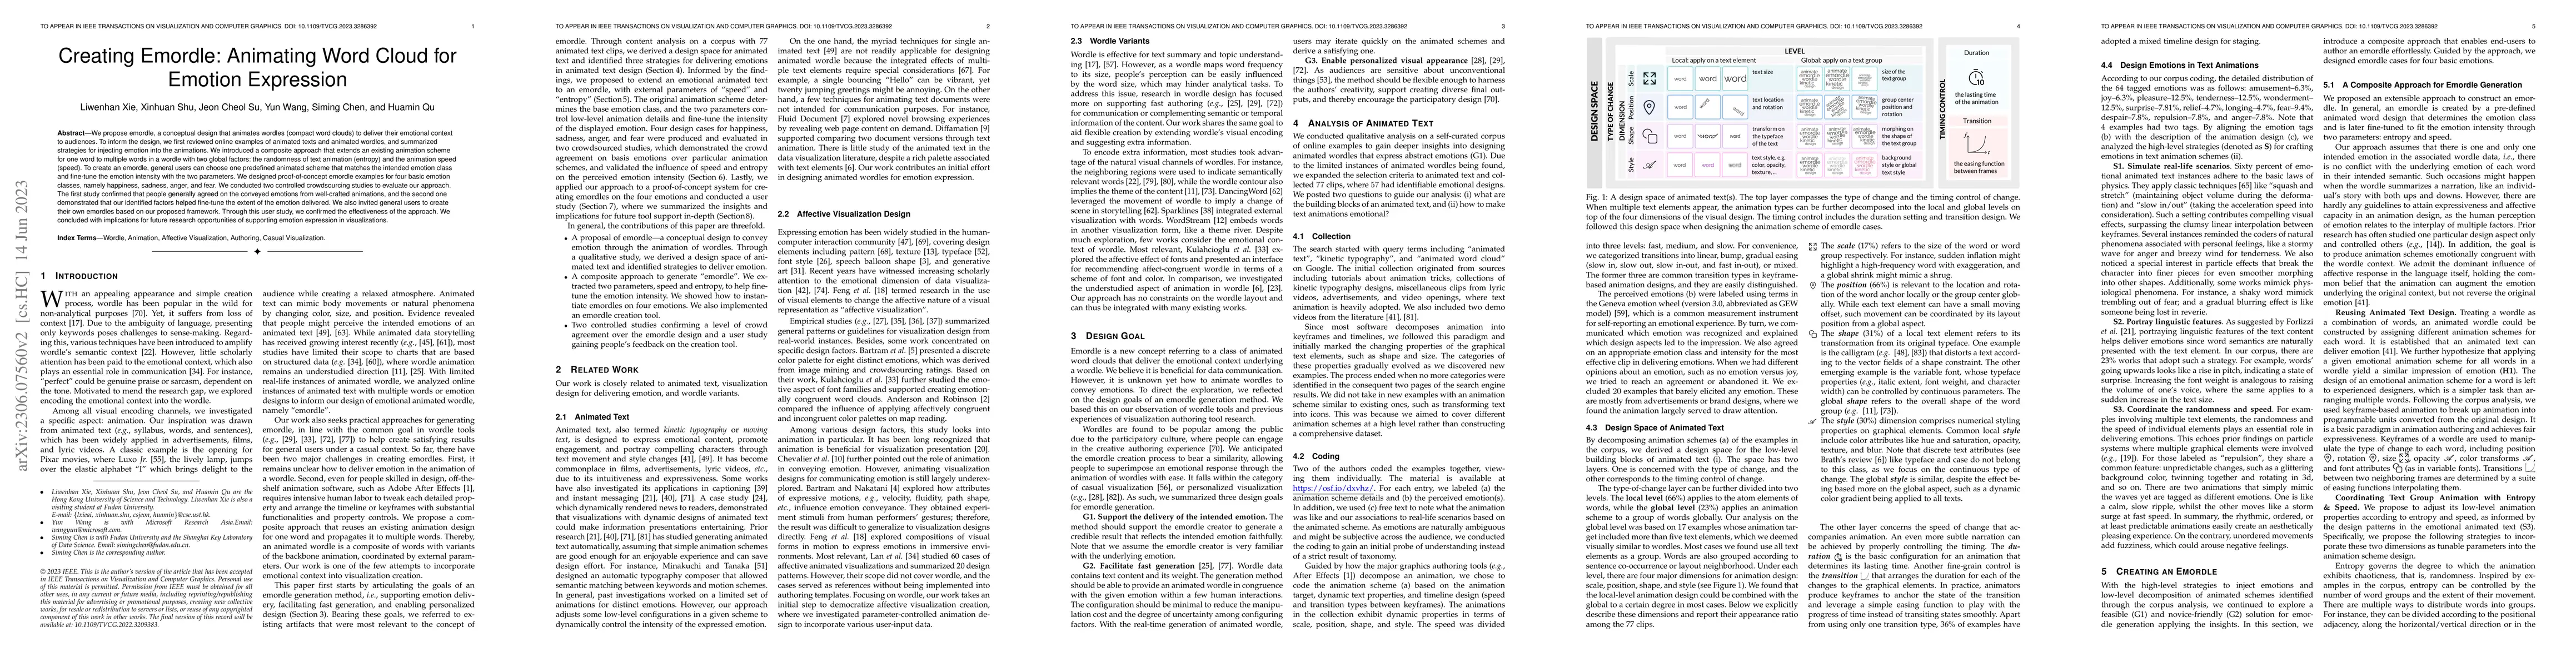
We propose emordle, a conceptual design that animates wordles (compact word clouds) to deliver their emotional context to the audiences. To inform the design, we first reviewed online examples of an...
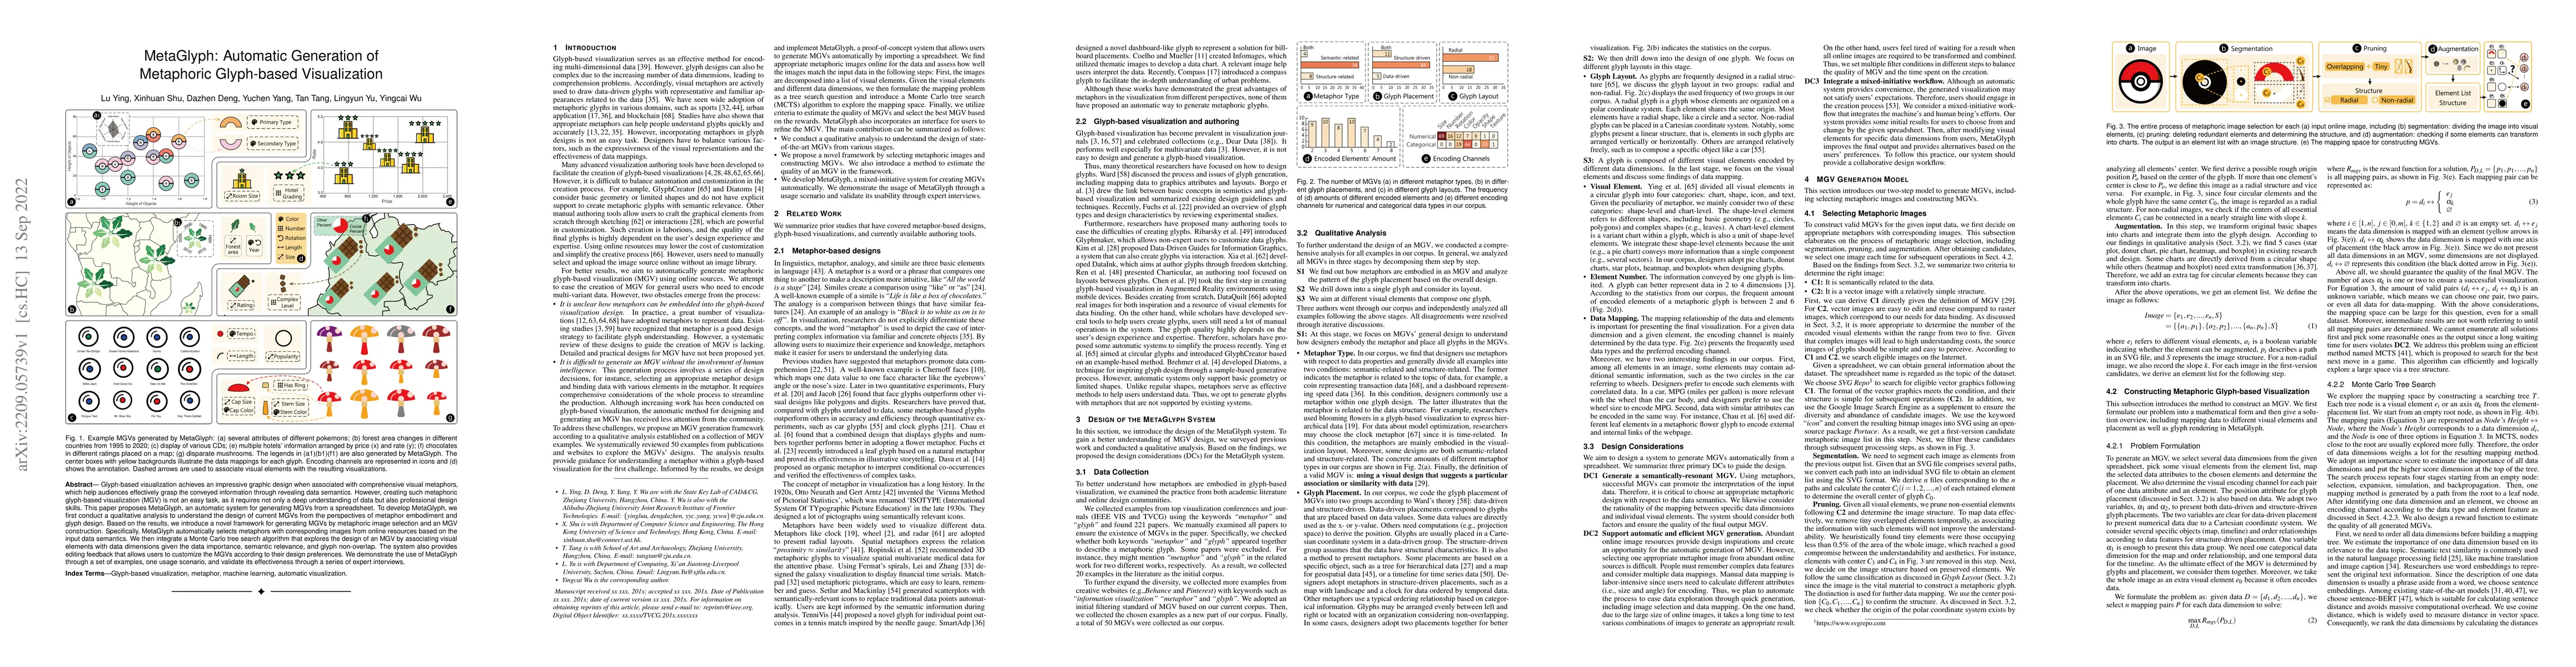
Glyph-based visualization achieves an impressive graphic design when associated with comprehensive visual metaphors, which help audiences effectively grasp the conveyed information through revealing...
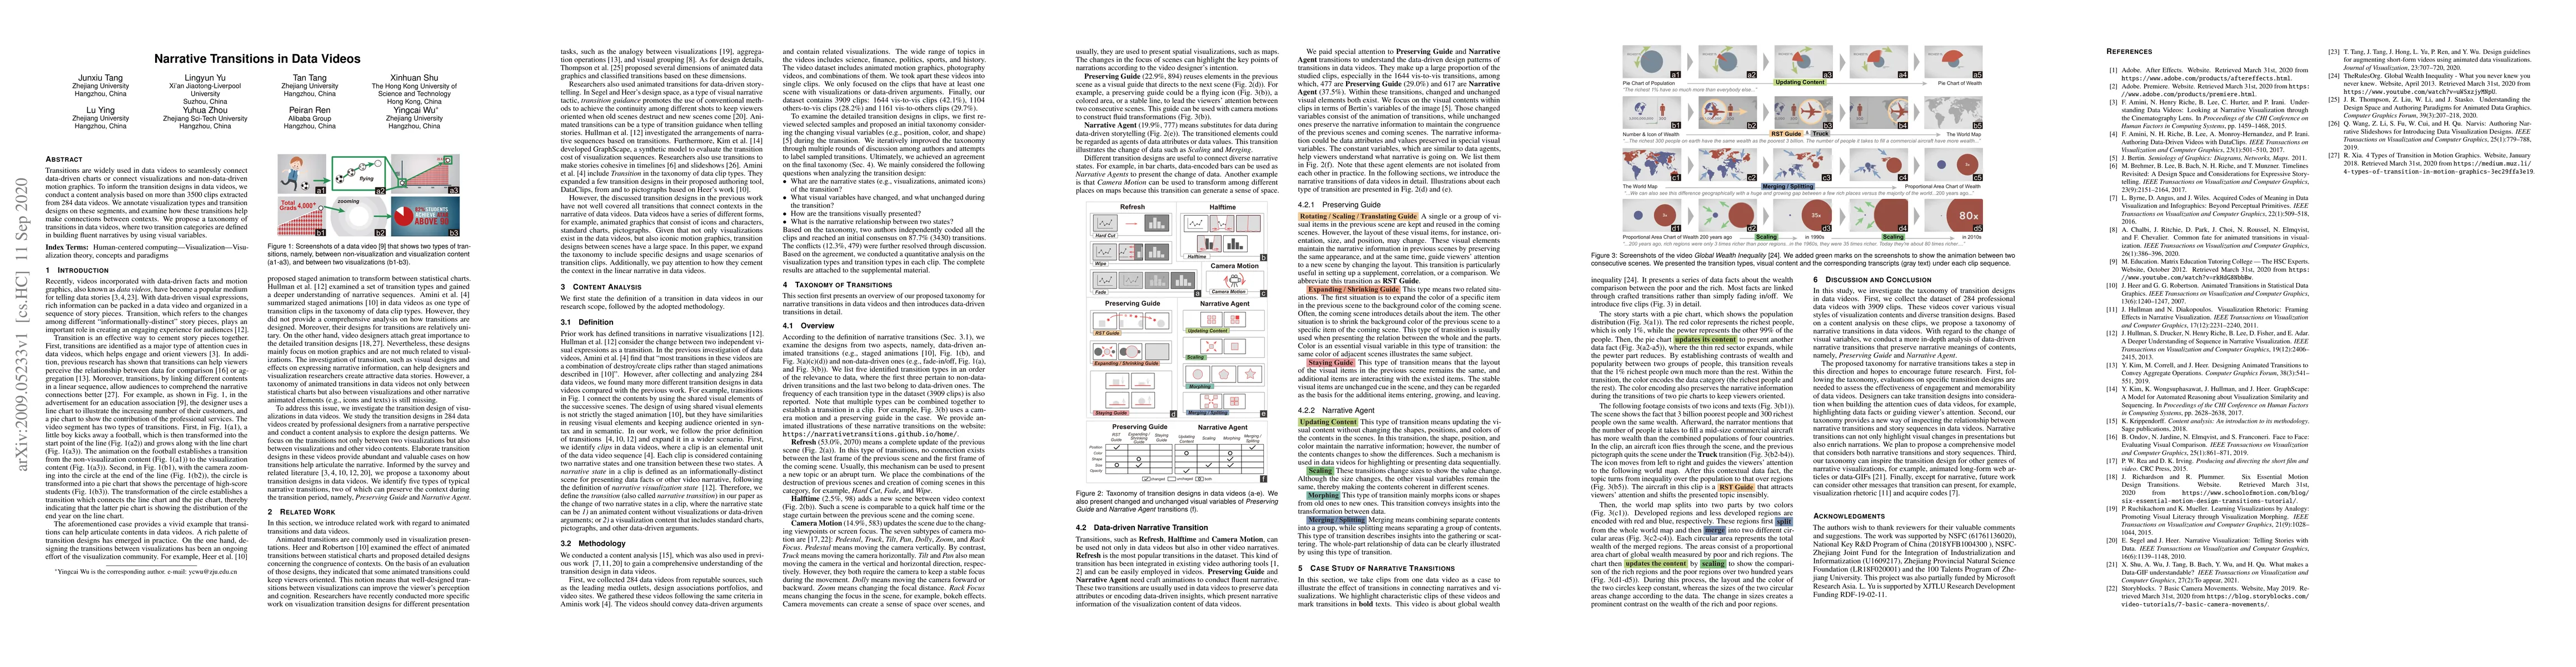
Transitions are widely used in data videos to seamlessly connect data-driven charts or connect visualizations and non-data-driven motion graphics. To inform the transition designs in data videos, we...
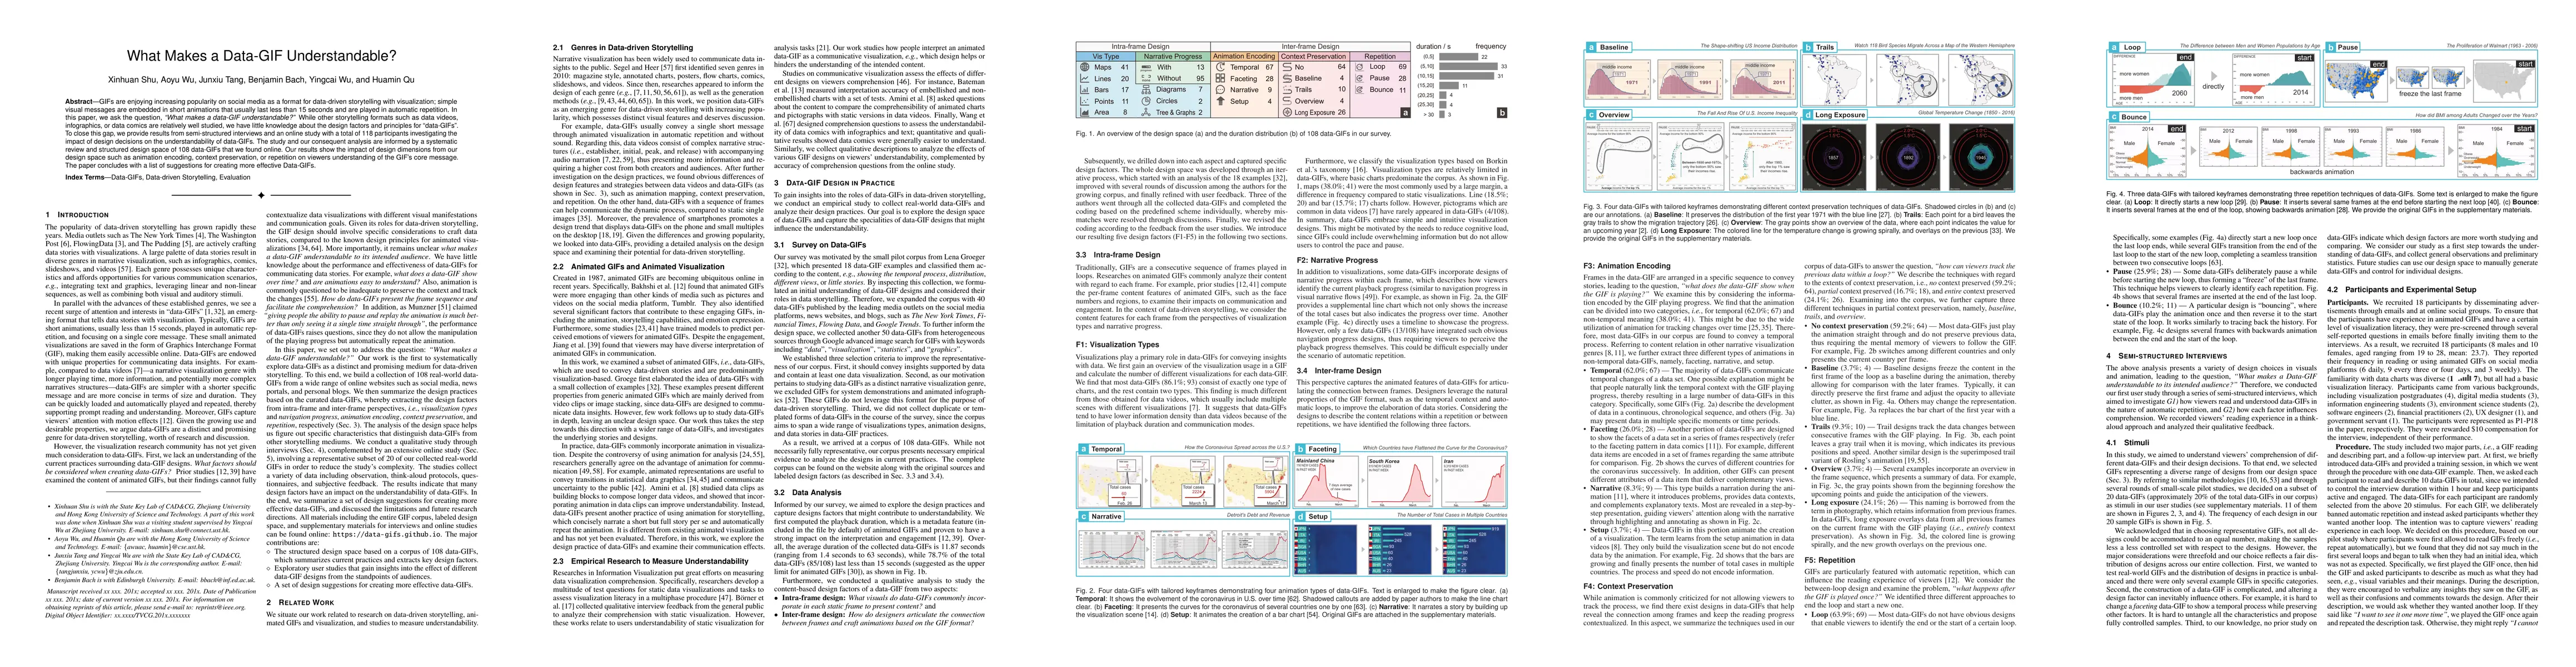
GIFs are enjoying increasing popularity on social media as a format for data-driven storytelling with visualization; simple visual messages are embedded in short animations that usually last less th...
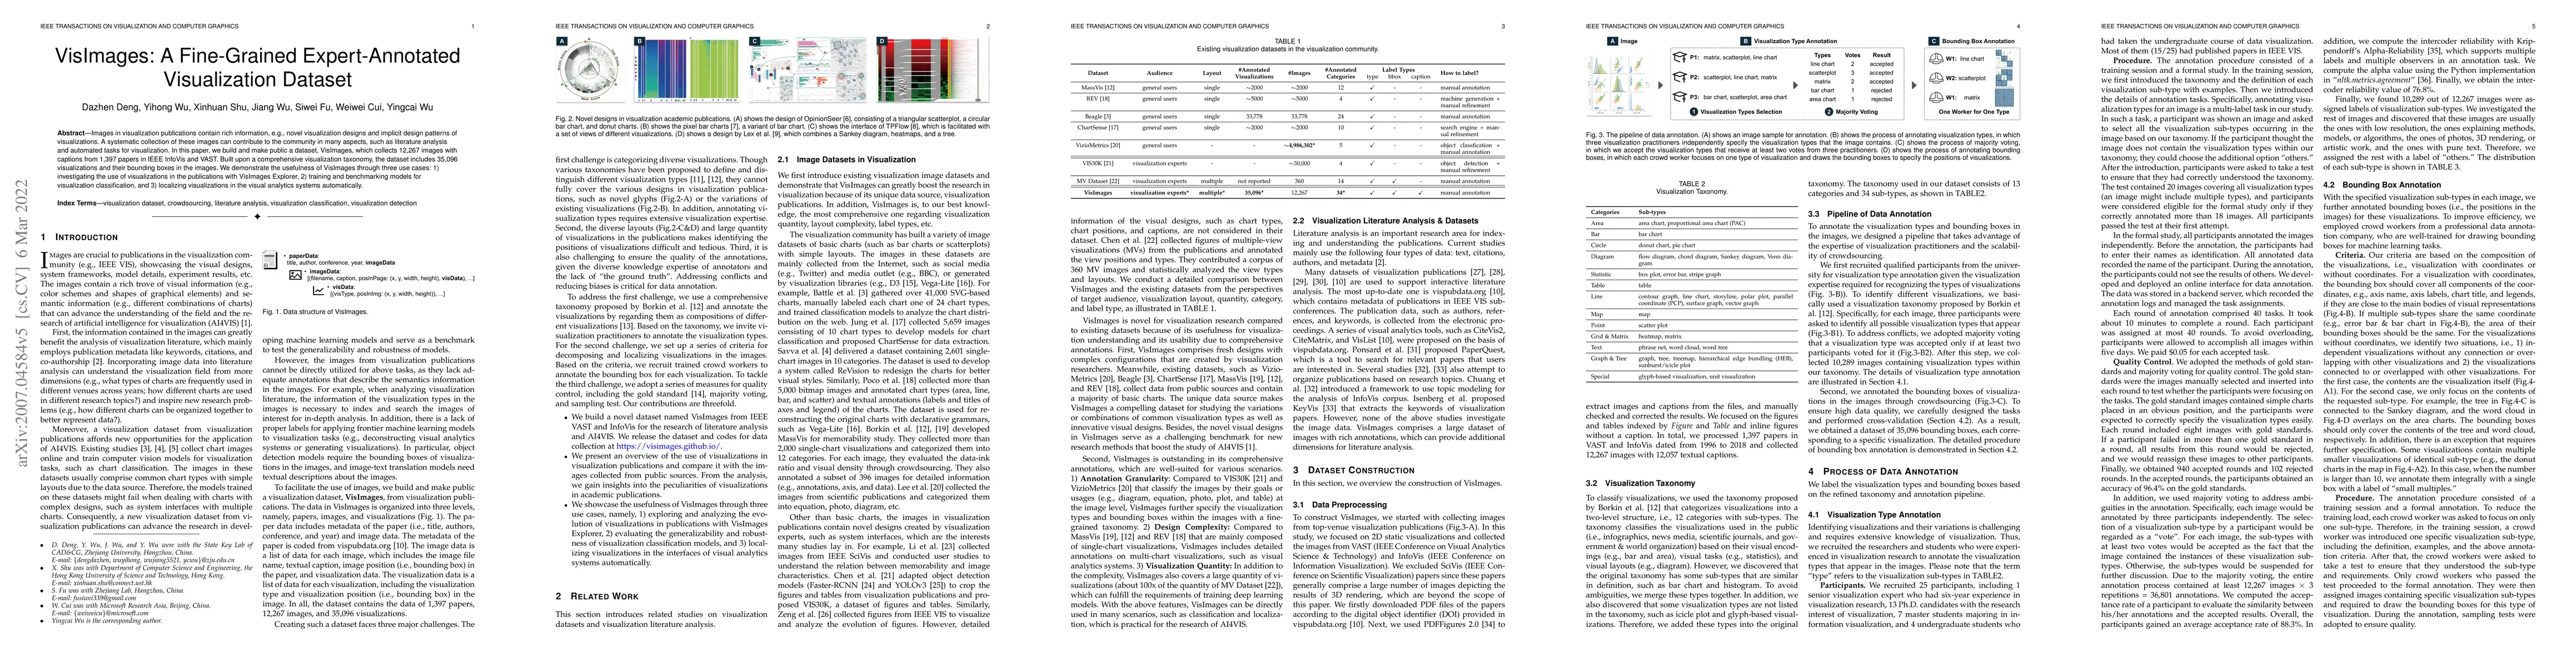
Images in visualization publications contain rich information, e.g., novel visualization designs and implicit design patterns of visualizations. A systematic collection of these images can contribut...
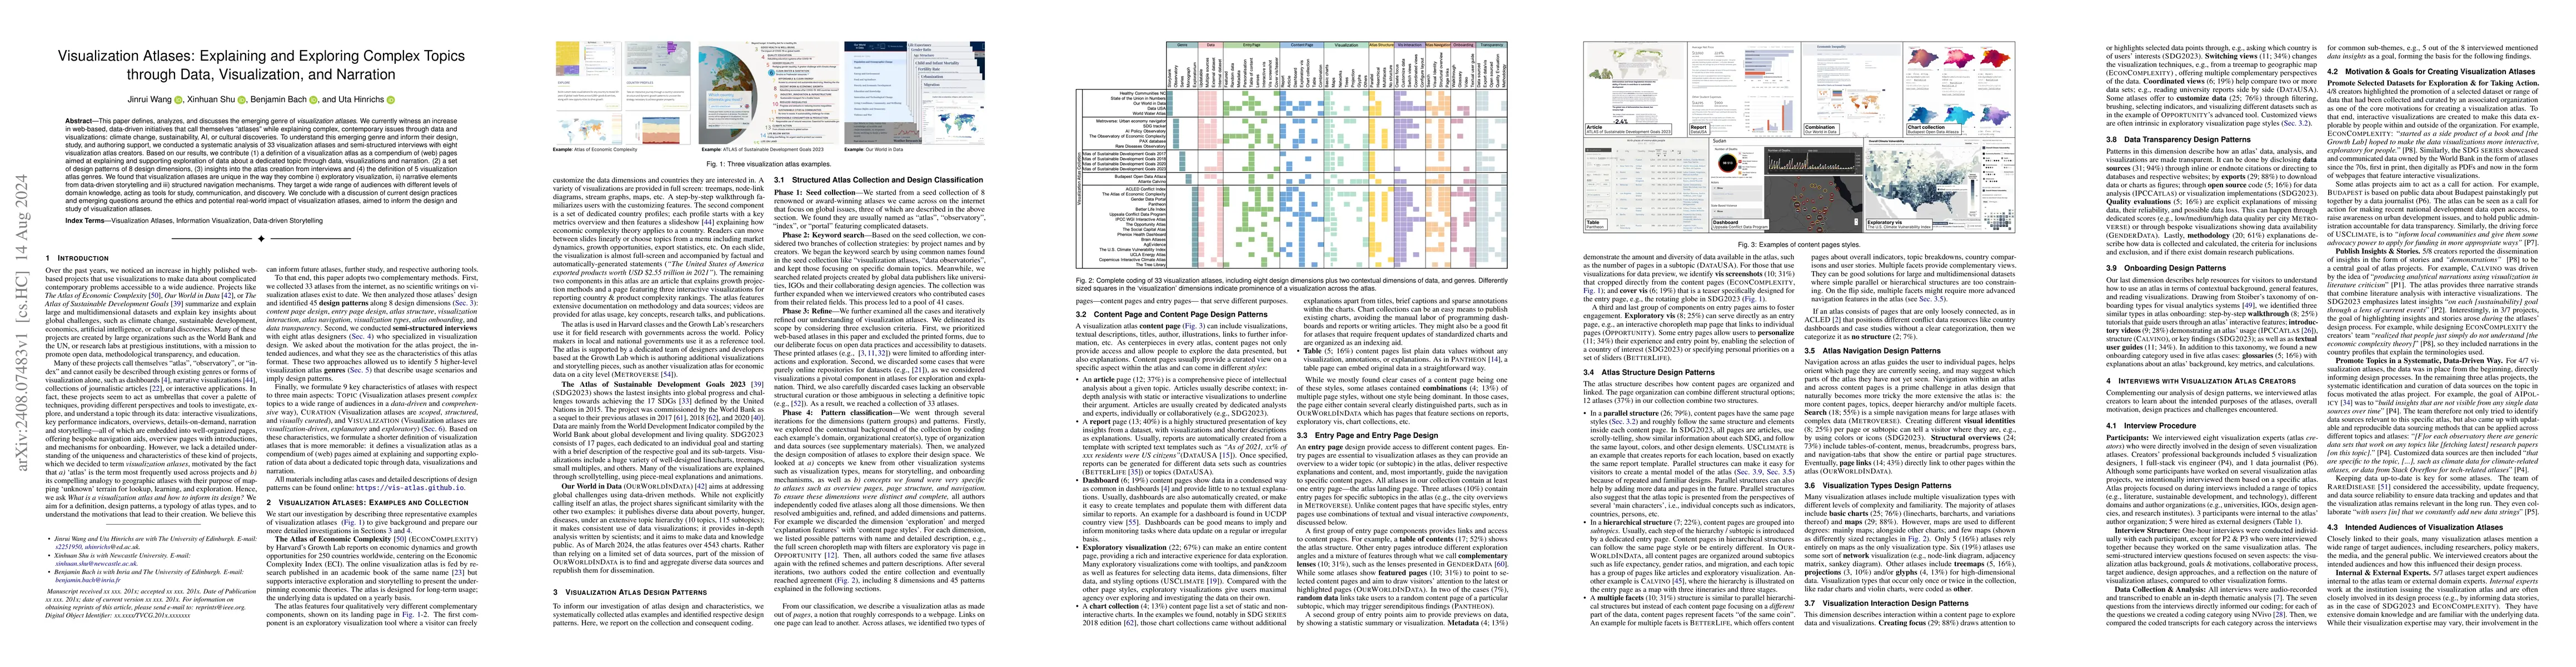
This paper defines, analyzes, and discusses the emerging genre of visualization atlases. We currently witness an increase in web-based, data-driven initiatives that call themselves "atlases" while exp...
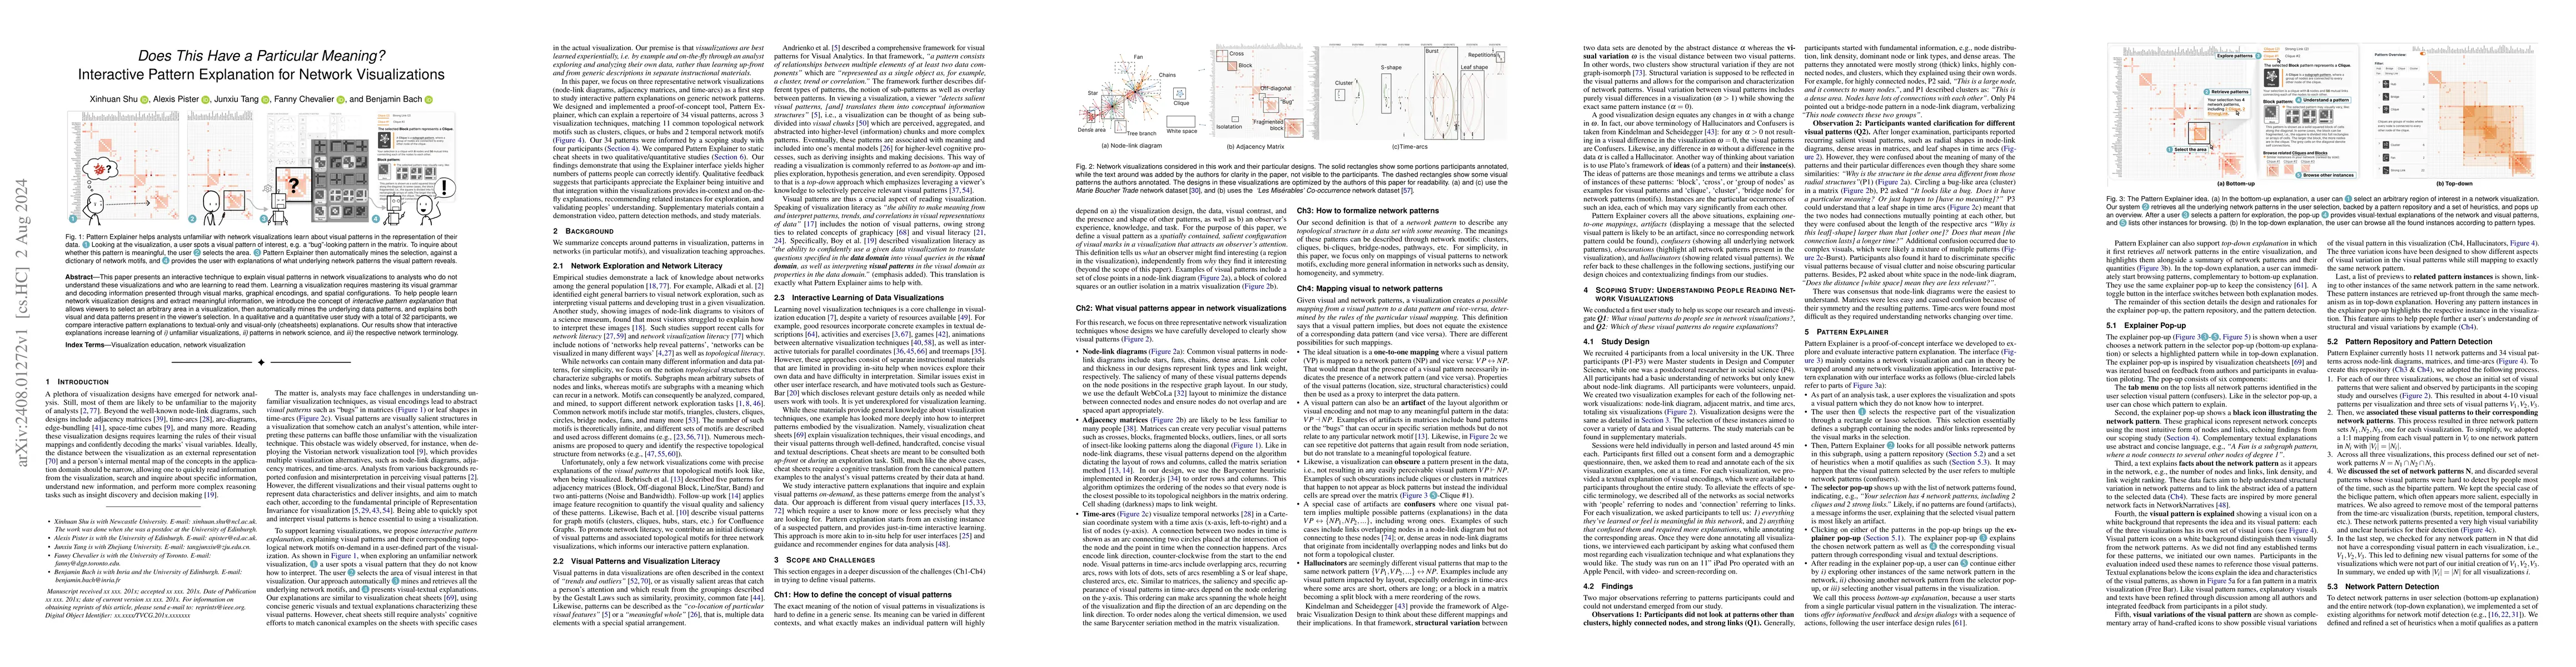
This paper presents an interactive technique to explain visual patterns in network visualizations to analysts who do not understand these visualizations and who are learning to read them. Learning a v...
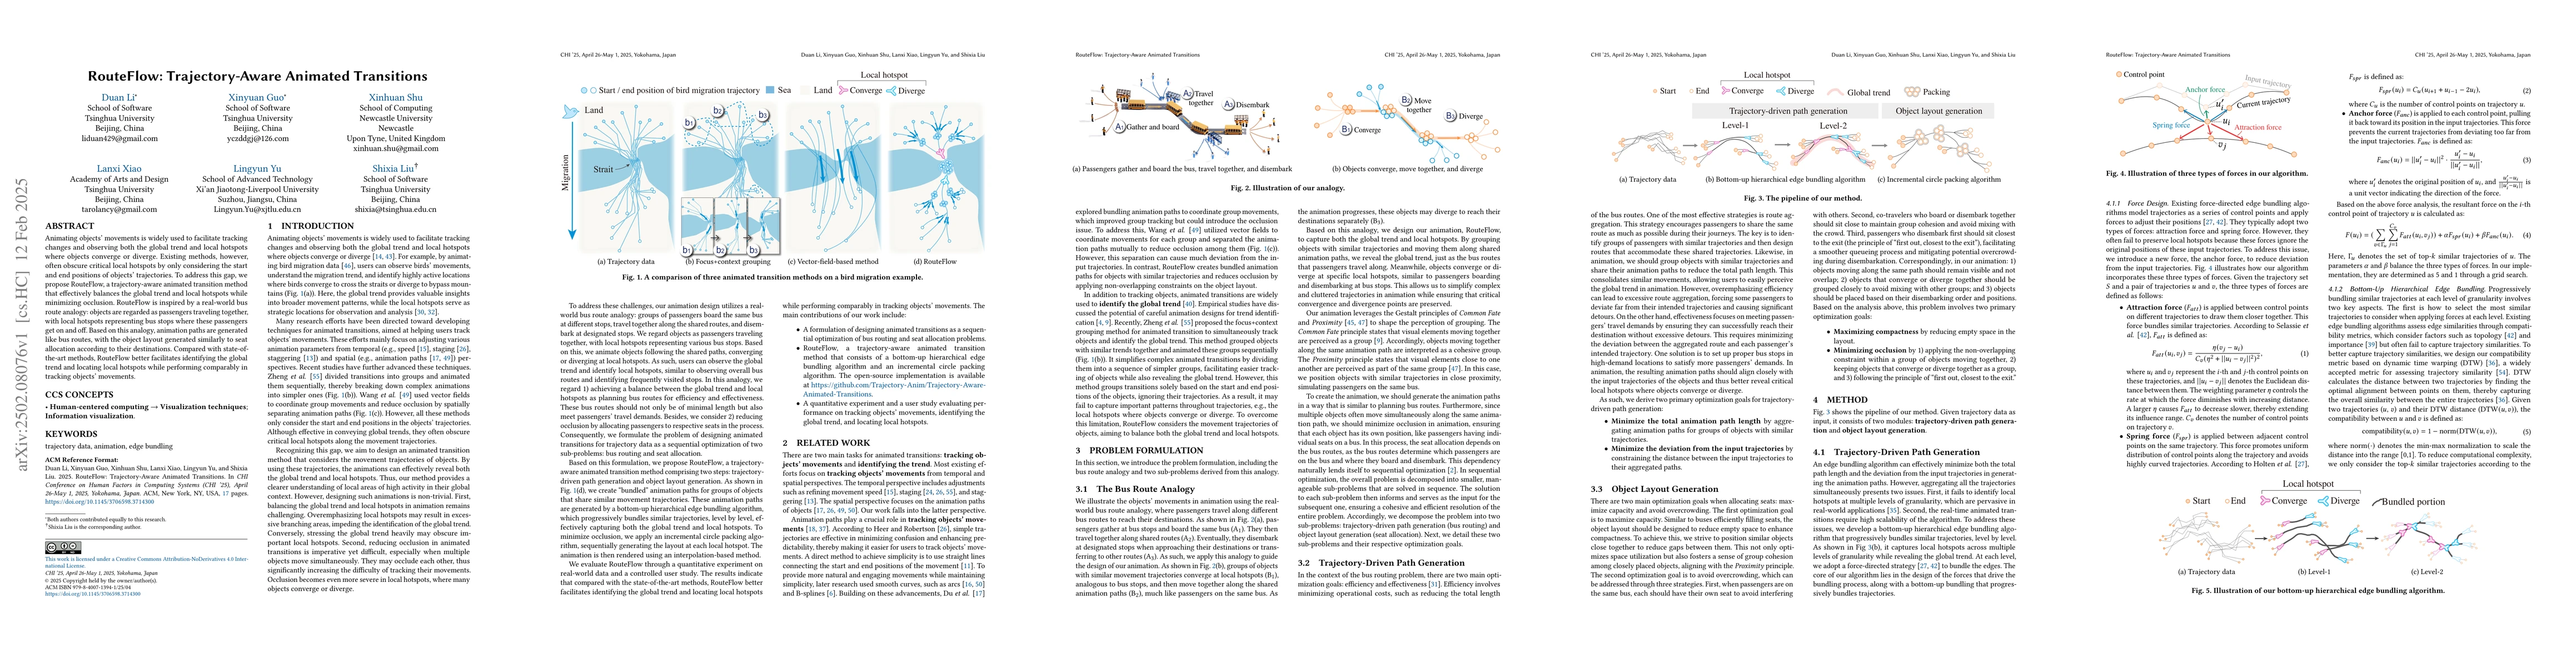
Animating objects' movements is widely used to facilitate tracking changes and observing both the global trend and local hotspots where objects converge or diverge. Existing methods, however, often ob...
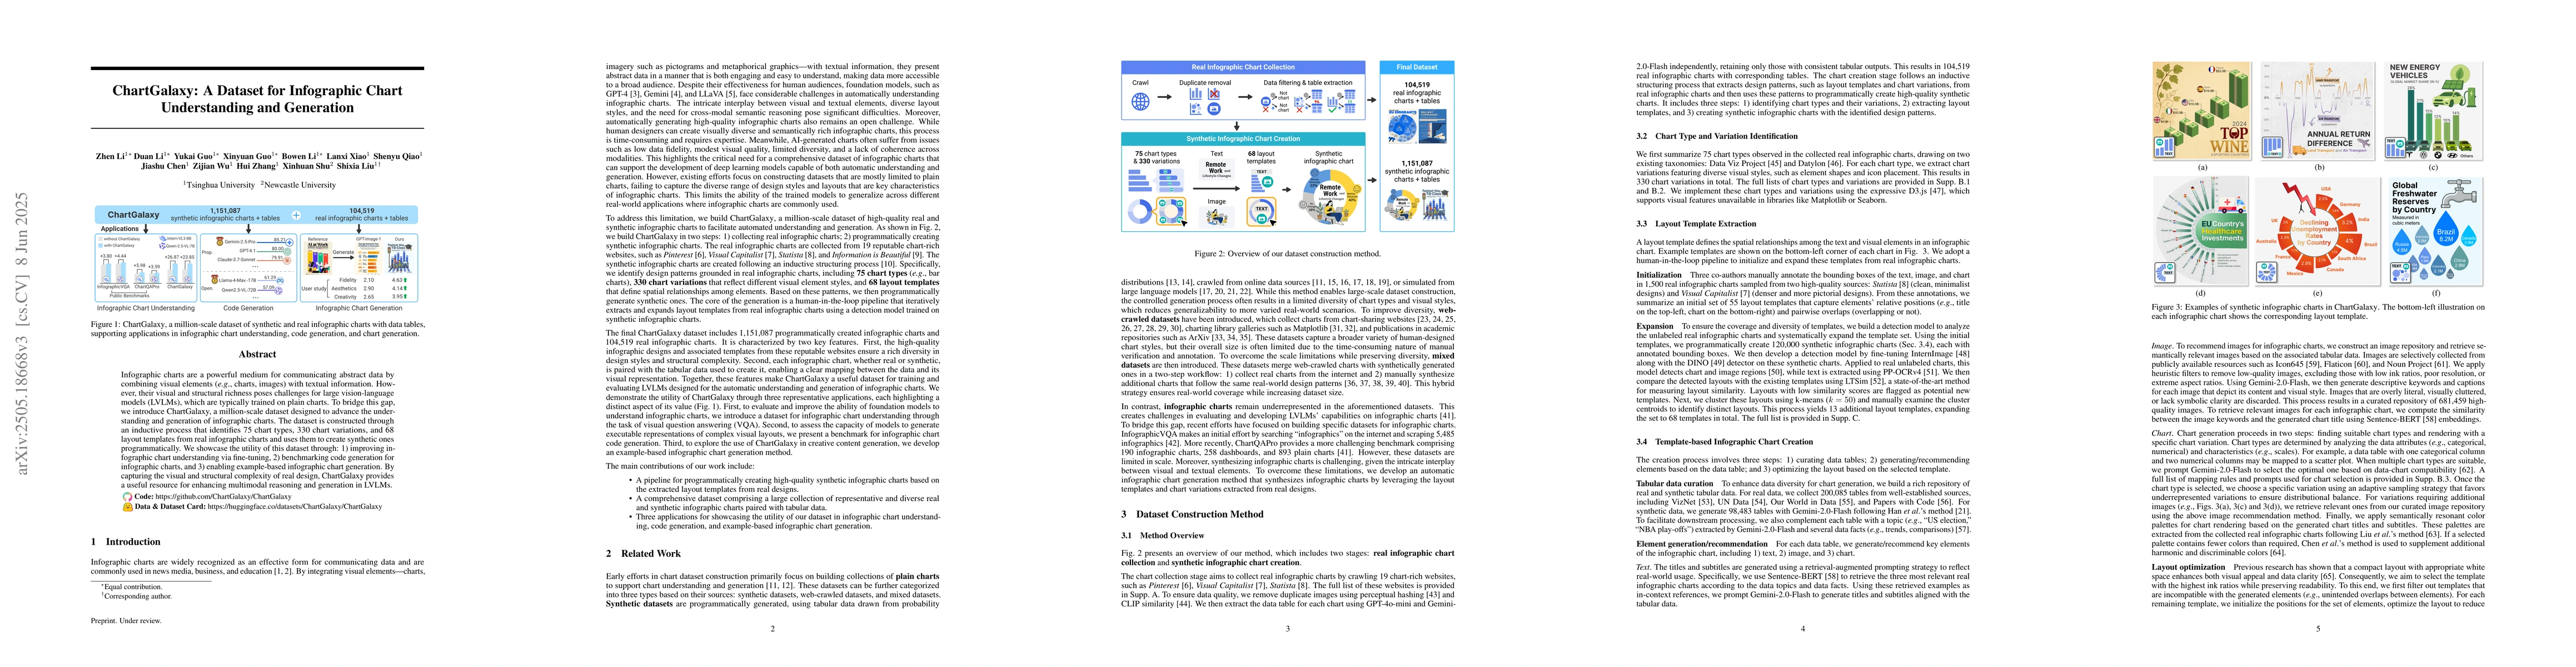
Infographic charts are a powerful medium for communicating abstract data by combining visual elements (e.g., charts, images) with textual information. However, their visual and structural richness pos...
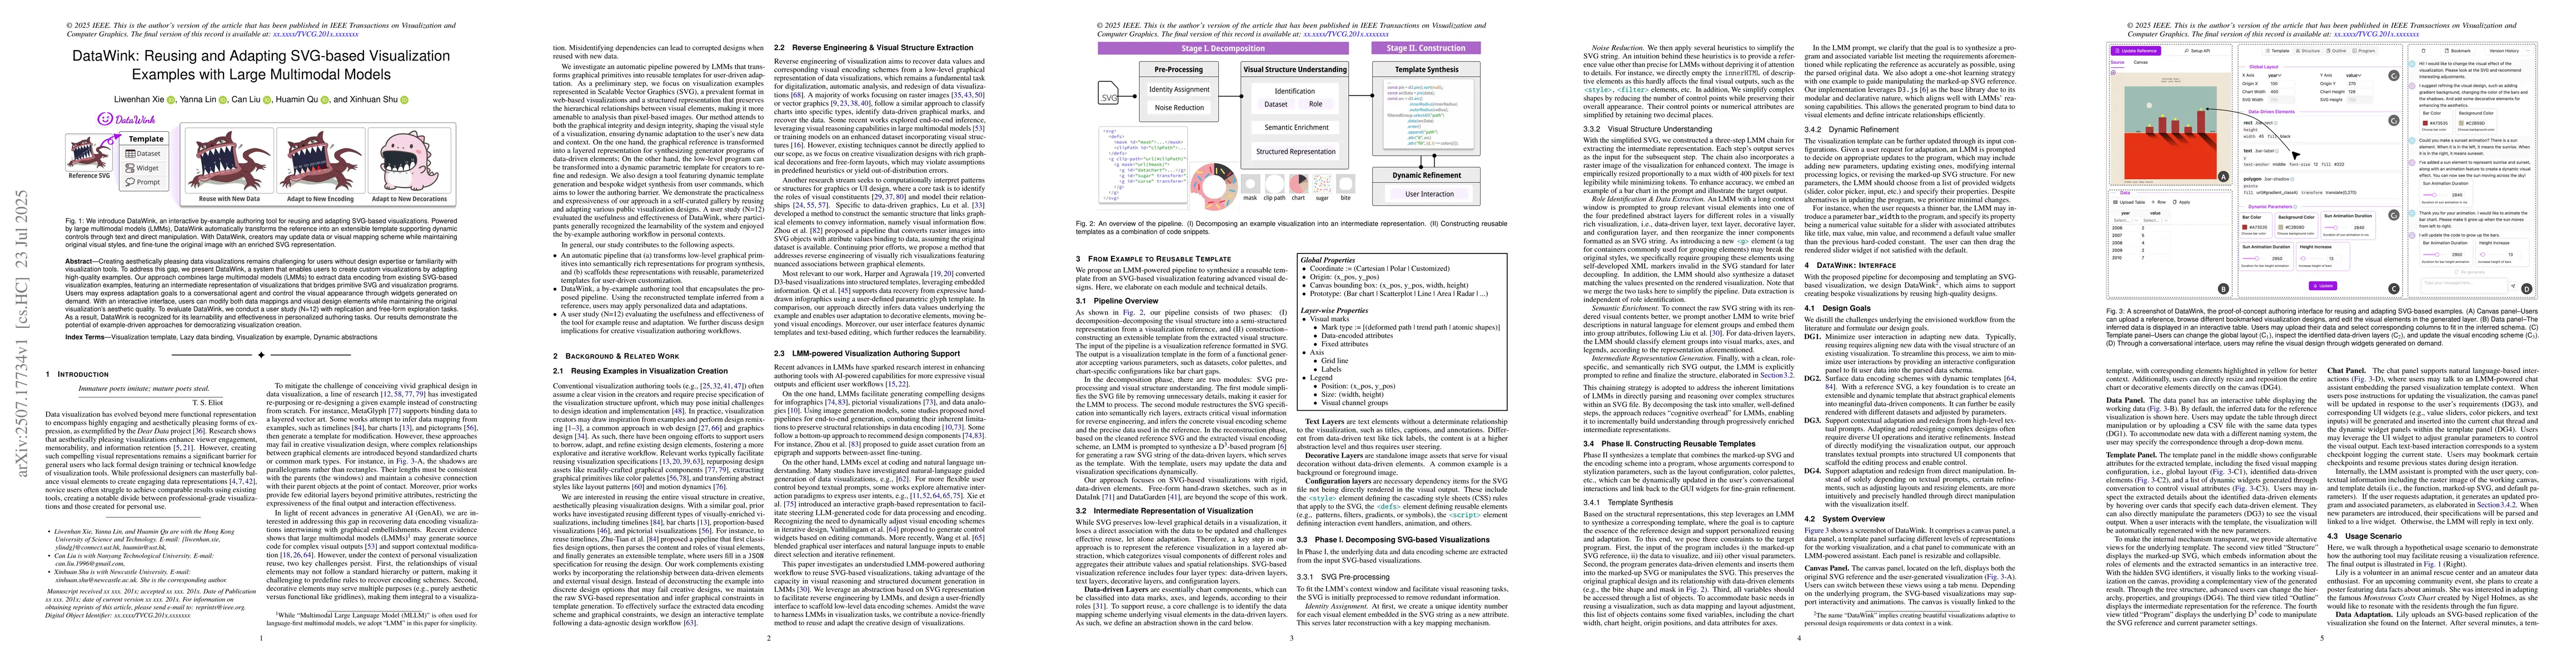
Creating aesthetically pleasing data visualizations remains challenging for users without design expertise or familiarity with visualization tools. To address this gap, we present DataWink, a system t...
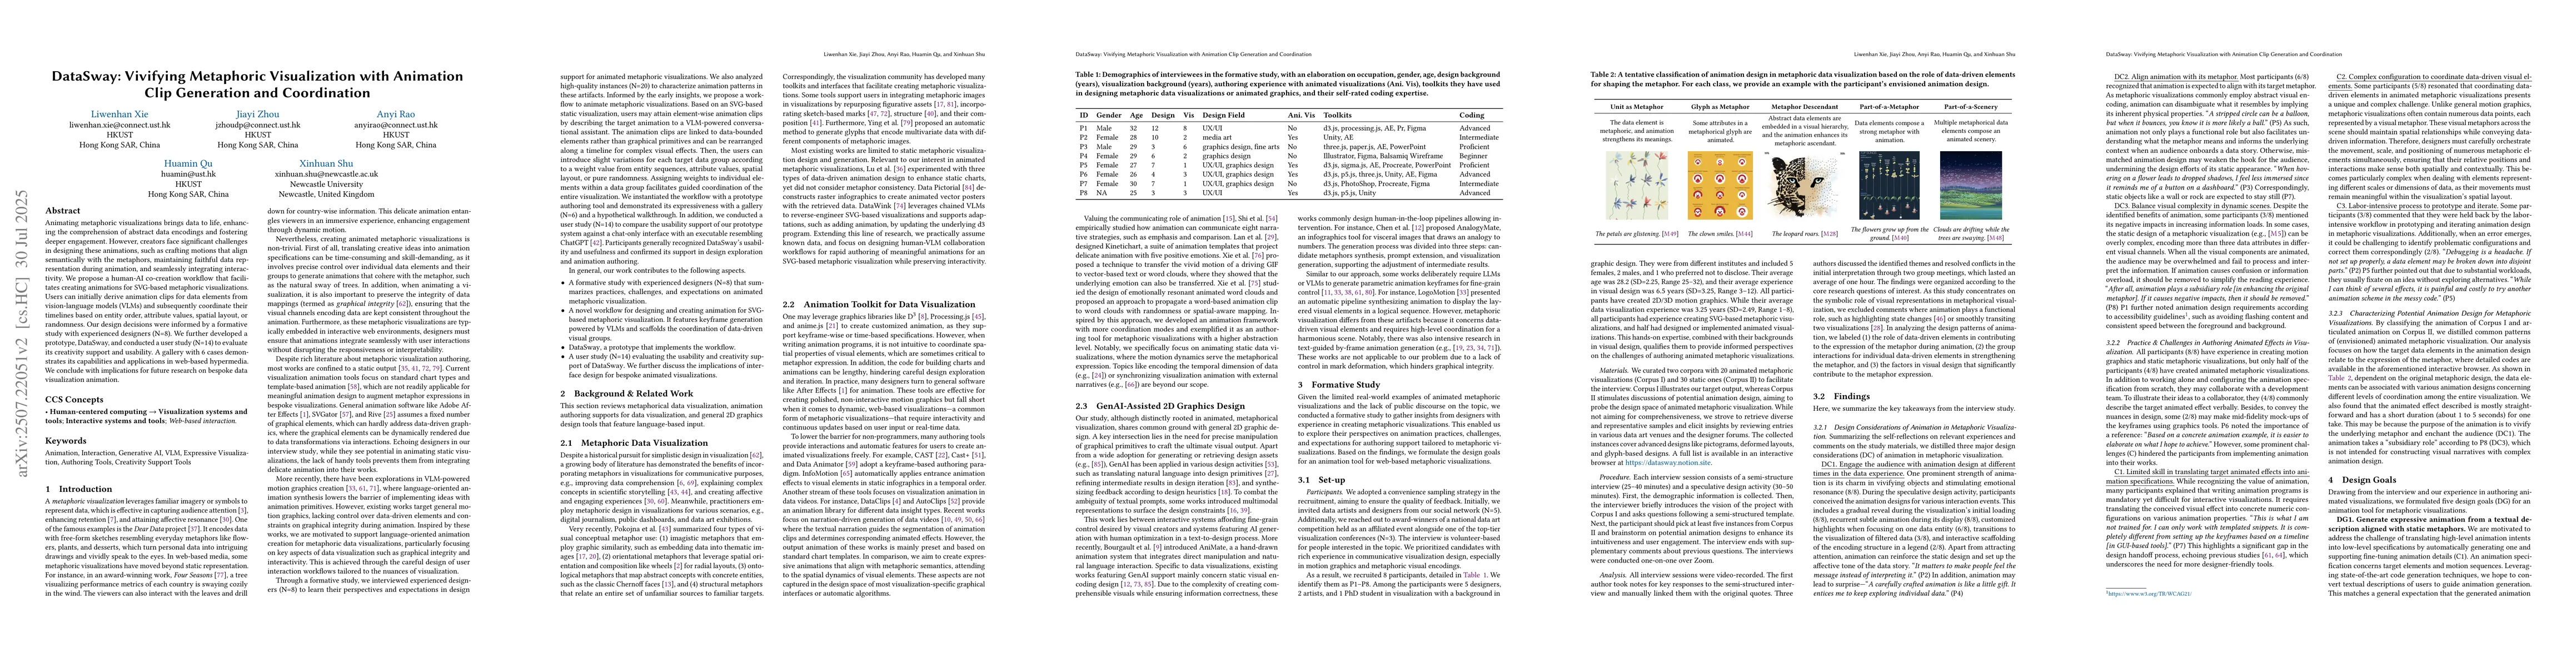
Animating metaphoric visualizations brings data to life, enhancing the comprehension of abstract data encodings and fostering deeper engagement. However, creators face significant challenges in design...
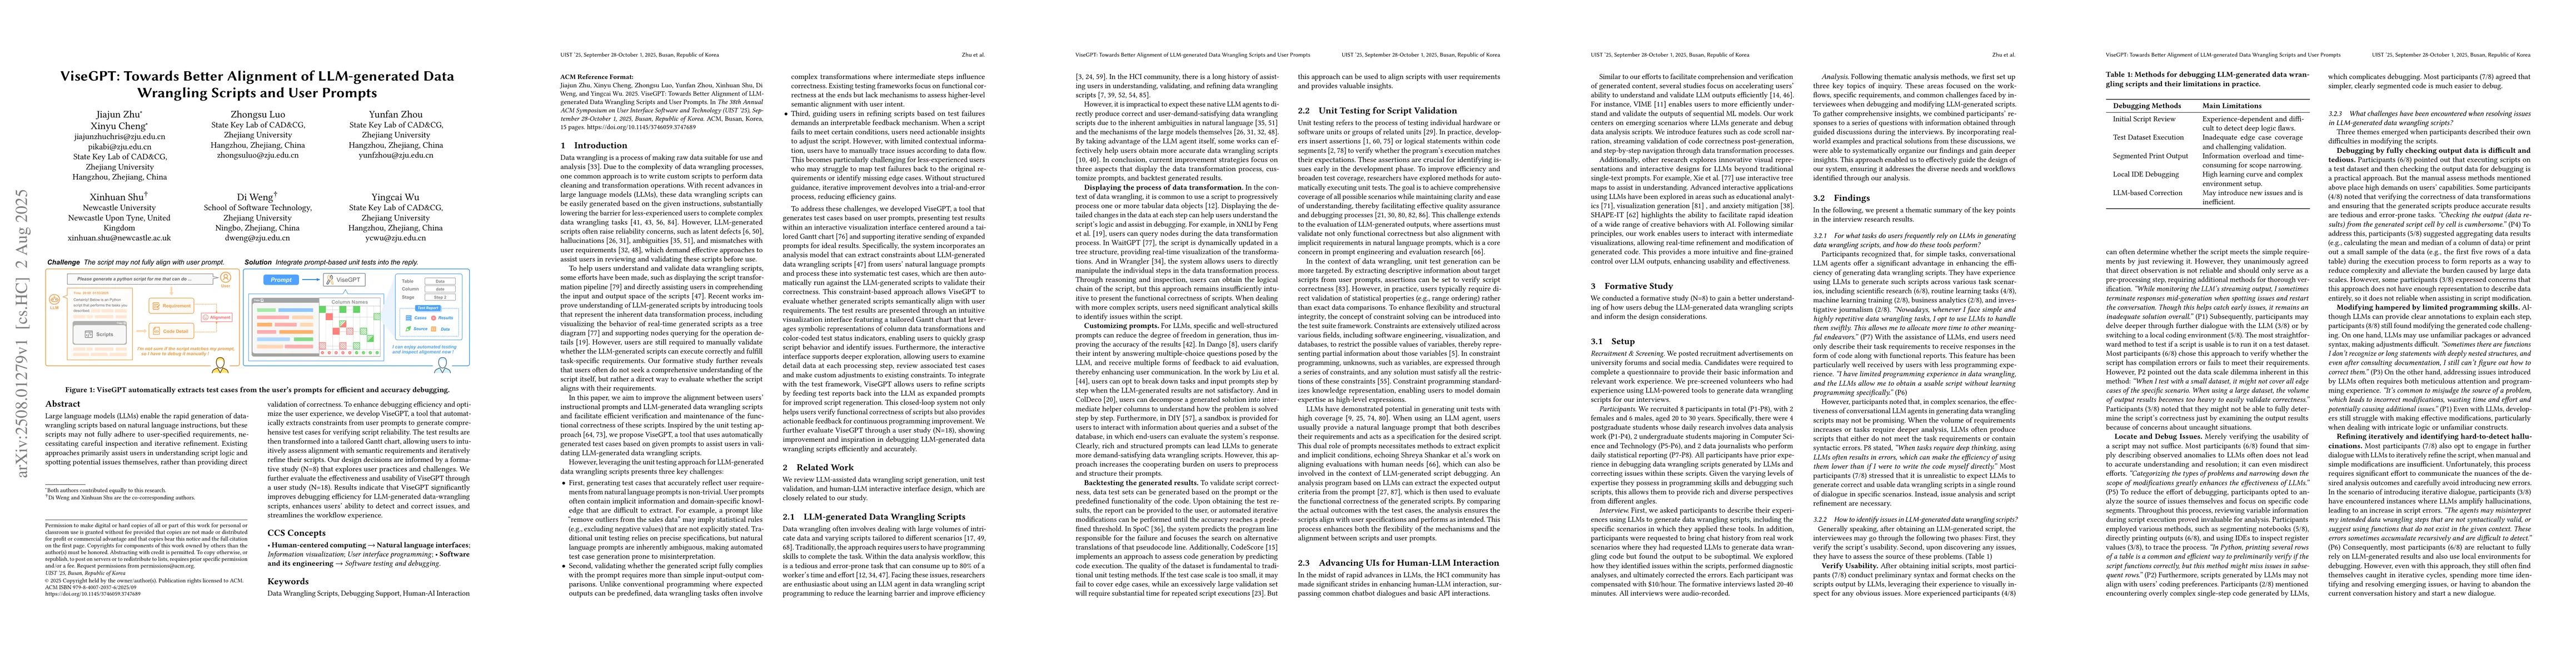
Large language models (LLMs) enable the rapid generation of data wrangling scripts based on natural language instructions, but these scripts may not fully adhere to user-specified requirements, necess...