MetaGlyph is an automatic system designed to generate metaphoric glyph-based visualizations from spreadsheets, leveraging metaphoric image selection and a Monte Carlo tree search algorithm to create effective visual metaphors. The system provides customization options and was validated through expert interviews.
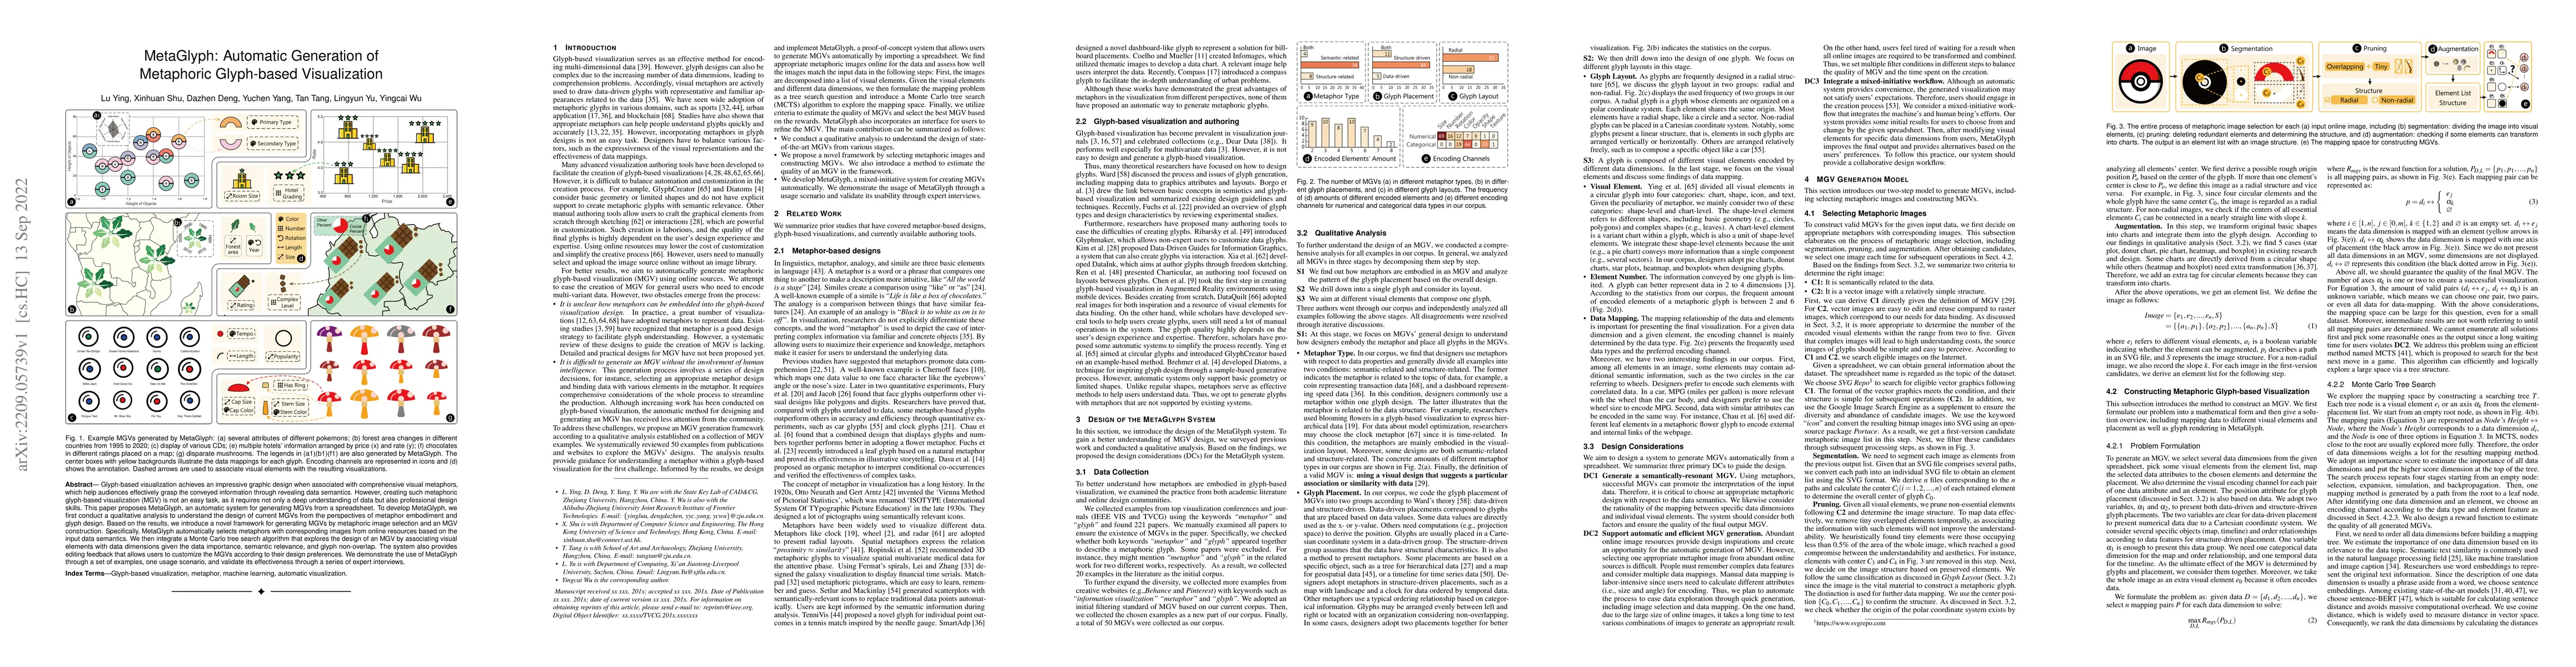
Glyph-based visualization achieves an impressive graphic design when associated with comprehensive visual metaphors, which help audiences effectively grasp the conveyed information through revealing data semantics. However, creating such metaphoric glyph-based visualization (MGV) is not an easy task, as it requires not only a deep understanding of data but also professional design skills. This paper proposes MetaGlyph, an automatic system for generating MGVs from a spreadsheet. To develop MetaGlyph, we first conduct a qualitative analysis to understand the design of current MGVs from the perspectives of metaphor embodiment and glyph design. Based on the results, we introduce a novel framework for generating MGVs by metaphoric image selection and an MGV construction. Specifically, MetaGlyph automatically selects metaphors with corresponding images from online resources based on the input data semantics. We then integrate a Monte Carlo tree search algorithm that explores the design of an MGV by associating visual elements with data dimensions given the data importance, semantic relevance, and glyph non-overlap. The system also provides editing feedback that allows users to customize the MGVs according to their design preferences. We demonstrate the use of MetaGlyph through a set of examples, one usage scenario, and validate its effectiveness through a series of expert interviews.
This graph shows how this paper is connected to other research. The current paper is shown in dark gray, papers that cite it are in green, and papers it references are in blue. You can:
• Hover over any node to see the paper title
• Click a node to view that paper's details
• Drag nodes to rearrange the graph
• Use the zoom controls (bottom right) to zoom in/out
Title | Authors | Year | Actions |
---|---|---|---|
Reflection on Data Storytelling Tools in the Generative AI Era from the Human-AI Collaboration Perspective
|
Haotian Li, Yun Wang, Huamin Qu
|
2025
|
View Paper |
Glyph design for communication initiation in real-time human-automation collaboration
|
Magnus Nylin, Jonas Lundberg, Magnus Bång, Kostiantyn Kucher
|
2024
|
View Paper |
An Empirical Evaluation of the GPT-4 Multimodal Language Model on Visualization Literacy Tasks
|
Alexander Bendeck, John Stasko
|
2024
|
View Paper |
AdaMotif: Graph Simplification via Adaptive Motif Design
|
Hong Zhou, Peifeng Lai, Zhida Sun, Xiangyuan Chen, Yang Chen, Huisi Wu, Yong Wang
|
2024
|
View Paper |
The Data-Wink Ratio: Emoji Encoder for Generating Semantically-Resonant Unit Charts
|
Matthew Brehmer, V. Setlur, Tableau Research, Zoe ‡ McGraw, Hill Michael Correll
|
2024
|
View Paper |
Path-Based Design Model for Constructing and Exploring Alternative Visualisations
|
James R. Jackson, Panagiotis D. Ritsos, P. Butcher, Jonathan C. Roberts
|
2024
|
View Paper |
The Language of Infographics: Toward Understanding Conceptual Metaphor Use in Scientific Storytelling
|
Hana Pokojná, Tobias Isenberg, Stefan Bruckner, Barbora Kozlíková, L. Garrison
|
2024
|
View Paper |
LSDvis: Hallucinatory Data Visualisations in Real World Environments
|
Ari Kouts, Lonni Besançon, Michael Sedlmair, Benjamin Lee
|
2023
|
View Paper |
ChartGPT: Leveraging LLMs to Generate Charts From Abstract Natural Language
|
Yuan Tian, Weiwei Cui, Dazhen Deng, Xinjing Yi, Yurun Yang, Haidong Zhang, Yingcai Wu
|
2023
|
View Paper |
Visualizing Large-Scale Spatial Time Series with GeoChron
|
Zikun Deng, Shifu Chen, T. Schreck, Dazhen Deng, Tan Tang, Mingliang Xu, Di Weng, Yingcai Wu
|
2023
|
View Paper |
Foundation Models Meet Visualizations: Challenges and Opportunities
|
Weikai Yang, Mengchen Liu, Zheng Wang, Shixia Liu
|
2023
|
View Paper |
Reviving Static Charts into Live Charts
|
Lu Ying, Yun Wang, Haotian Li, Shuguang Dou, Haidong Zhang, Xinyang Jiang, Huamin Qu, Yingcai Wu
|
2023
|
View Paper |
Data Player: Automatic Generation of Data Videos with Narration-Animation Interplay
|
Leixian Shen, Yizhi Zhang, Haidong Zhang, Yun Wang
|
2023
|
View Paper |
Towards Contextual Glyph Design: Visualizing Hearing Screenings
|
Barbara Nascimento Ramos, Catarina Maçãs, Nuno Lourenço, Evgheni Polisciuc
|
2023
|
View Paper |
Doom or Deliciousness: Challenges and Opportunities for Visualization in the Age of Generative Models
|
V. Schetinger, Sara Di Bartolomeo, Mennatallah El-Assady, A. Mcnutt, M. Miller, J. P. A. Passos, J. L. Adams
|
2023
|
View Paper |
Let the Chart Spark: Embedding Semantic Context into Chart with Text-to-Image Generative Model
|
Shishi Xiao, Suizi Huang, Yue Lin, Yilin Ye, Weizhen Zeng
|
2023
|
View Paper |
viz2viz: Prompt-driven stylized visualization generation using a diffusion model
|
Jiaqi Wu, John Joon Young Chung, Eytan Adar
|
2023
|
View Paper |
Graph Visualization: Alternative Models Inspired by Bioinformatics
|
M. Kolomeets, V. Desnitsky, Igor Kotenko, A. Chechulin
|
2023
|
View Paper |
Multi-Criteria Decision Analysis for Aiding Glyph Design
|
H. Hsieh, A. Zavatsky, Min Chen
|
2023
|
View Paper |
VAID: Indexing View Designs in Visual Analytics System
|
Lu Ying, Aoyu Wu, Haotian Li, Zikun Deng, Ji Lan, Jiang Wu, Yong Wang, Huamin Qu, Dazhen Deng, Yingcai Wu
|
2022
|
View Paper |
DashBot: Insight-Driven Dashboard Generation Based on Deep Reinforcement Learning
|
Dazhen Deng, Aoyu Wu, Huamin Qu, Yingcai Wu
|
2022
|
View Paper |
RASIPAM: Interactive Pattern Mining of Multivariate Event Sequences in Racket Sports
|
Jiang Wu, Dongyu Liu, Ziyang Guo, Yingnian Wu
|
2022
|
View Paper |
MultiCMET: A Novel Chinese Benchmark for Understanding Multimodal Metaphor
|
Dongyu Zhang, Jingwei Yu, Senyuan Jin, Liang Yang, Hongfei Lin
|
2023
|
View Paper |
Zachary Morrow, Jixian Li, Bart van Bloemen Waanders, Chris R. Johnson, Timbwaoga A. J. Ouermi
Published: 2024-08-18
Comments (0)