Glyph from Icon -- Automated Generation of Metaphoric Glyphs
Publication
Metrics
AI Quick Summary
This paper introduces the Glyph-from-Icon (GfI) approach for automated generation of metaphoric glyphs from specified icons, enhancing data visualization readability. It employs a parametric representation based on diffusion curves and evaluates its effectiveness through user studies, demonstrating its application in visualizing COVID-19 data.
Paper Preview
Abstract
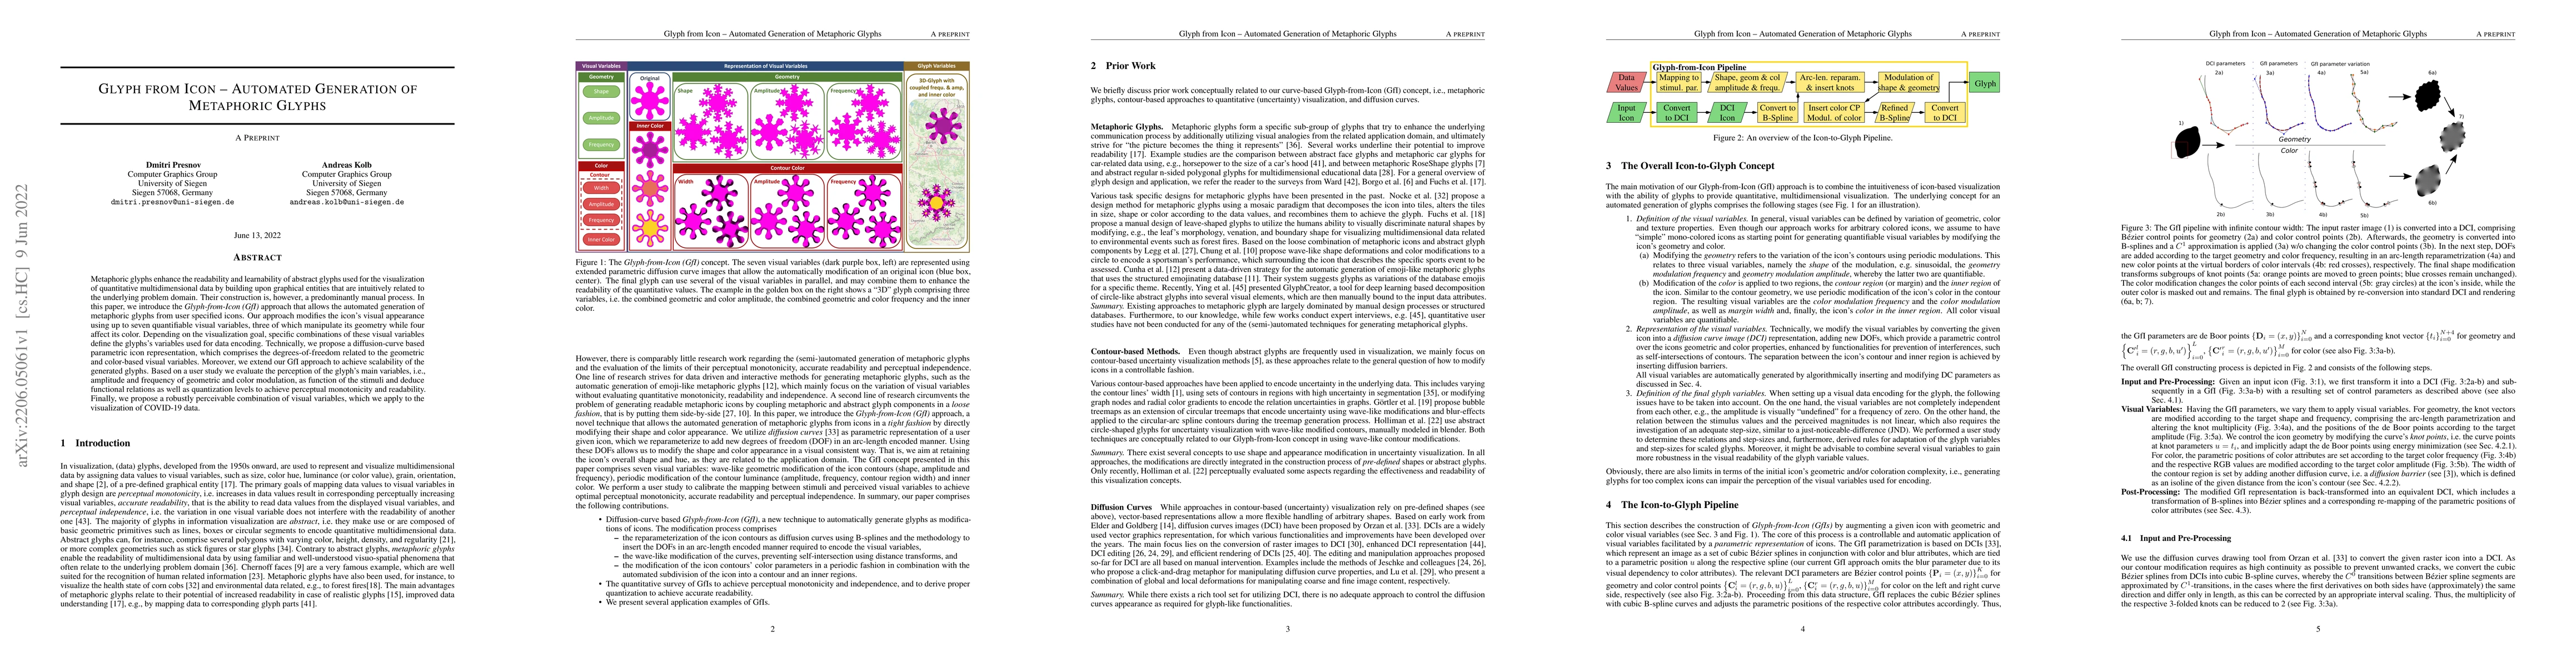
Metaphoric glyphs enhance the readability and learnability of abstract glyphs used for the visualization of quantitative multidimensional data by building upon graphical entities that are intuitively related to the underlying problem domain. Their construction is, however, a predominantly manual process. In this paper, we introduce the Glyph-from-Icon (GfI) approach that allows the automated generation of metaphoric glyphs from user specified icons. Our approach modifies the icon's visual appearance using up to seven quantifiable visual variables, three of which manipulate its geometry while four affect its color. Depending on the visualization goal, specific combinations of these visual variables define the glyphs's variables used for data encoding. Technically, we propose a diffusion-curve based parametric icon representation, which comprises the degrees-of-freedom related to the geometric and color-based visual variables. Moreover, we extend our GfI approach to achieve scalability of the generated glyphs. Based on a user study we evaluate the perception of the glyph's main variables, i.e., amplitude and frequency of geometric and color modulation, as function of the stimuli and deduce functional relations as well as quantization levels to achieve perceptual monotonicity and readability. Finally, we propose a robustly perceivable combination of visual variables, which we apply to the visualization of COVID-19 data.
AI Key Findings
Get AI-generated insights about this paper's methodology, results, significance, and more — seven facets brought into focus.
Impact
Paper Details
Authors
PDF Preview
Key Terms
Citation Network
Current paper (gray), citations (green), references (blue)
Display is limited for performance on very large graphs.
Discussion 0